


The Reserve Rights (RSR) price returned to validate a crucial support level after previously breaking out from it. Despite the re-test, lower time-frames are showing weakness, suggesting that a drop is expected.
Re-Testing the breakout level
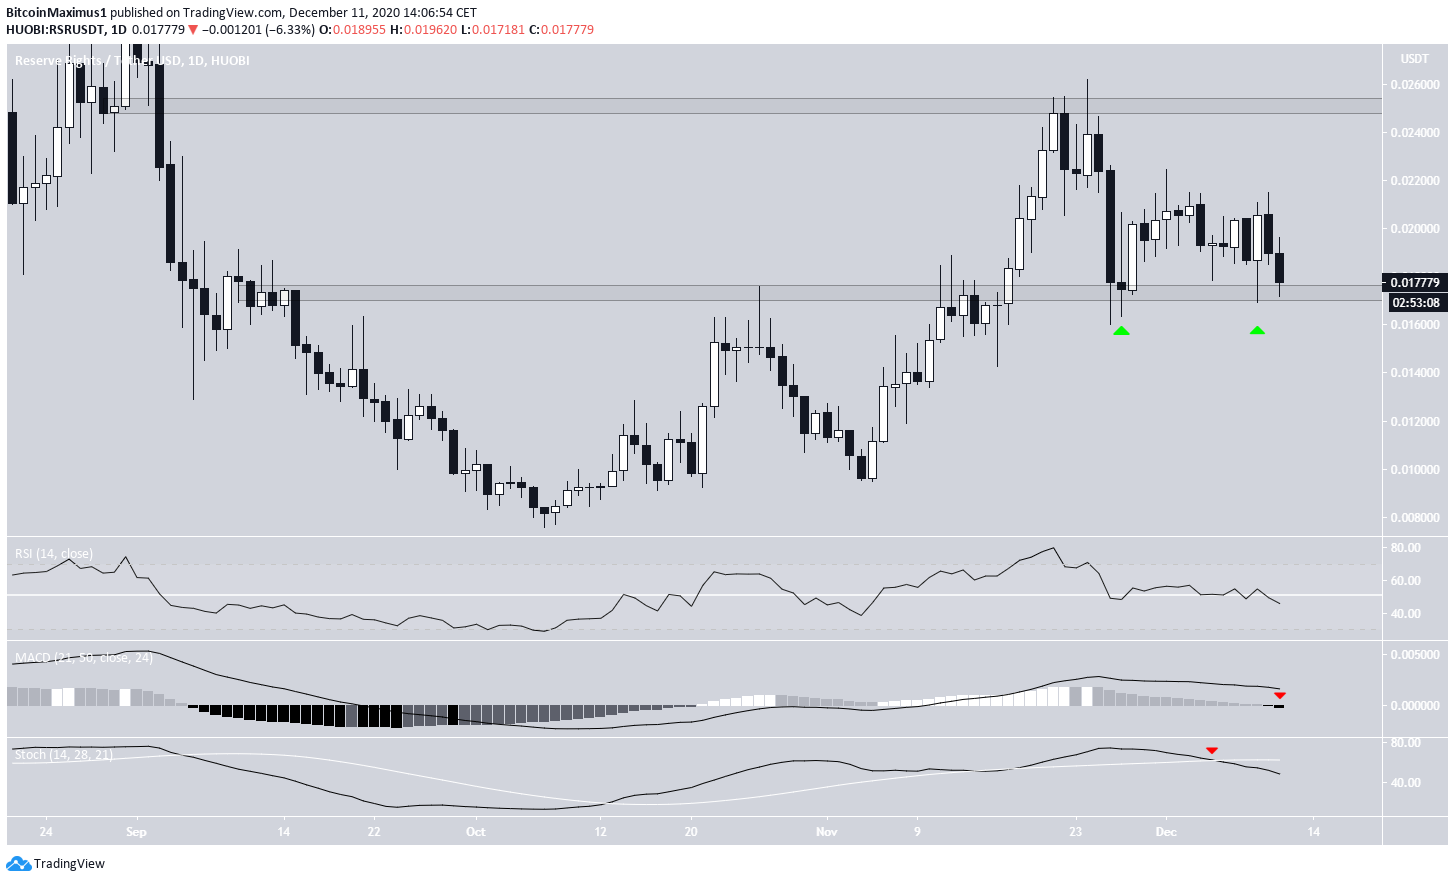
The RSR price has been increasing since a low of $0.0075 was reached on Oct 7. Initially, the $0.0175 area acted as resistance. RSR managed to break out on Nov. 17, proceeding to reach a high of $0.026 on Nov. 24.
However, a drop followed and RSR returned to the $0.0175 area once more, validating it as support and potentially creating a double bottom pattern just above it. However ,the second bounce has been weaker than the first one, a sign of dissipating strength.
Despite the fact that a double bottom is generally a bullish pattern, technical indicators are turning bearish.
The RSI dropped below 50, the MACD is decreasing and the Stochastic Oscillator just made a bearish cross.
Therefore, a look at lower time-frames is required in order to determine the direction of the next move.
Short-term movement
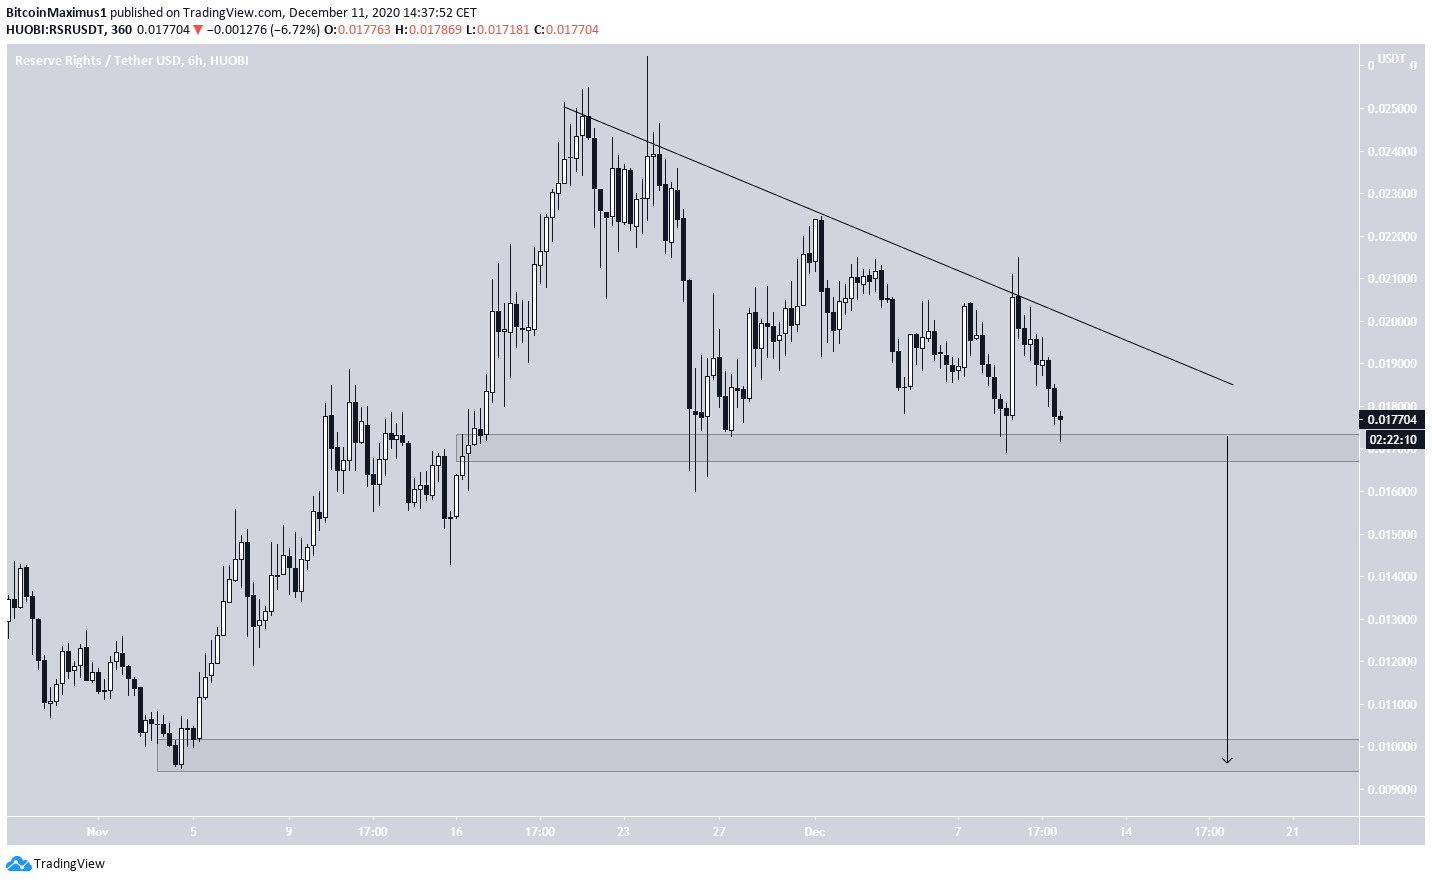
The shorter-term 6-hour chart shows that RSR has been following a descending resistance line since reaching the Nov. 24 high. Combined with the current support, this creates a descending triangle, which is considered a bearish pattern.
A breakdown that travels the entire height of the pattern would take RSR all the way down to the Nov. lows at $0.010, which would be the maximum target for a possible drop. However, it is more likely to find support somewhere between these two levels and begin to move upwards.
Cryptocurrency trader @Daancrypto tweeted out a short-term RSR chart, saying that he is looking to enter on a re-test of the resistance line from which the alt-coin has broken out.
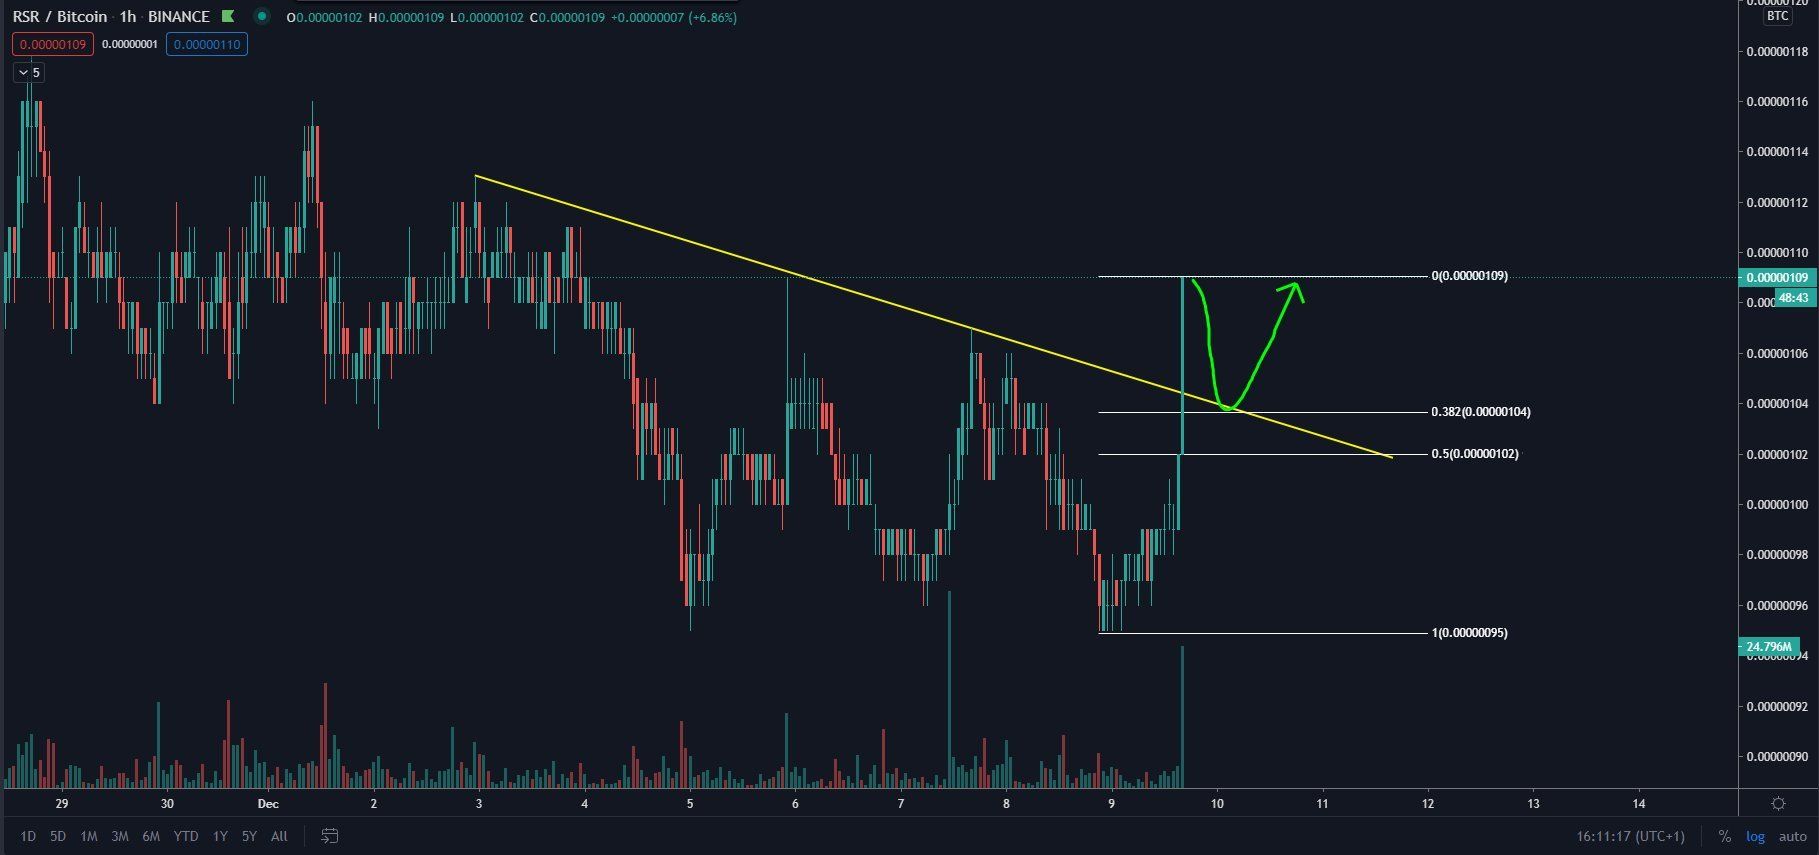
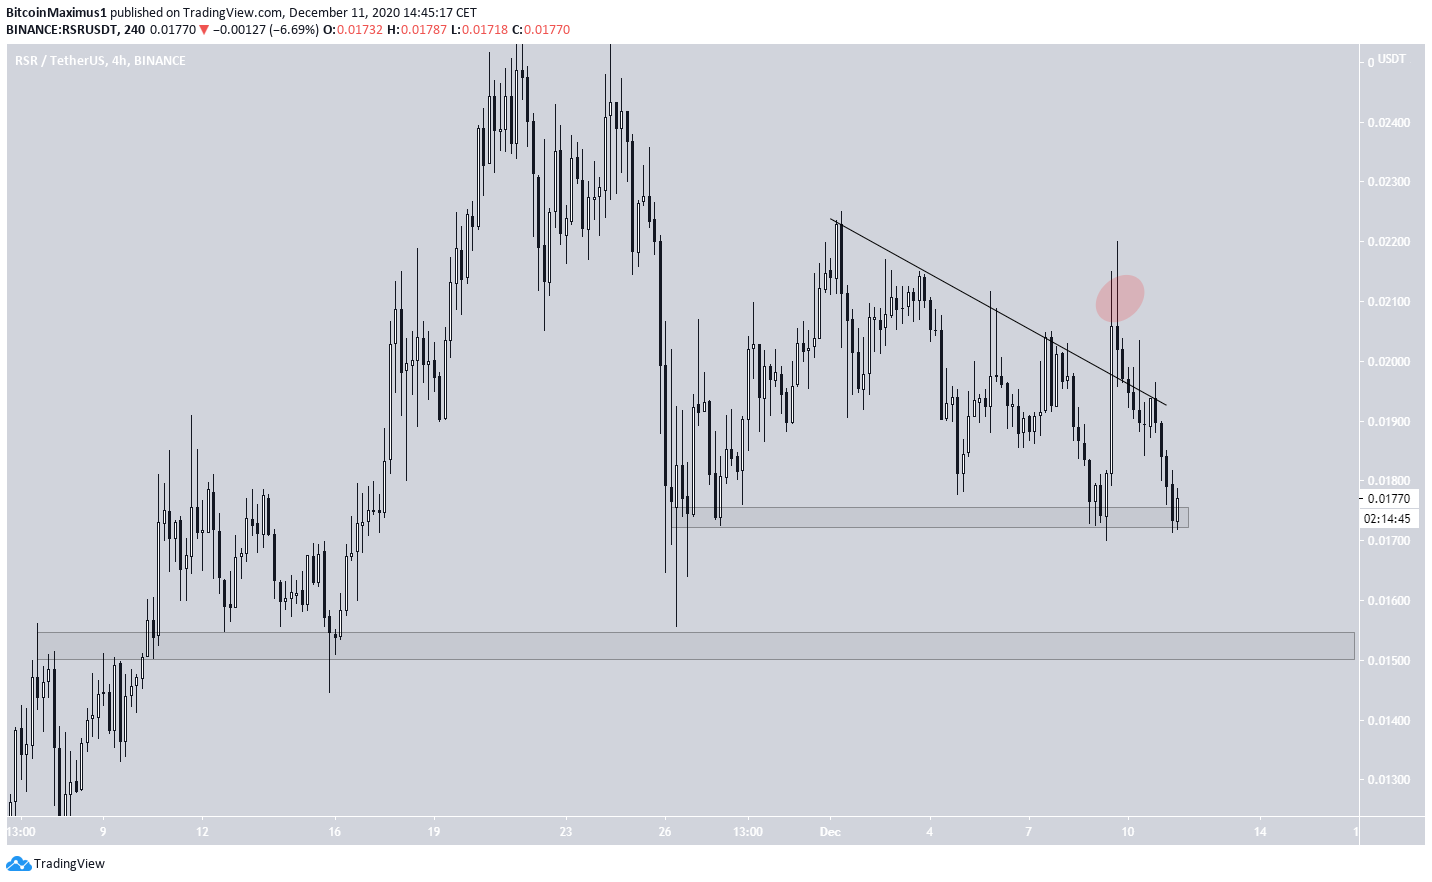
However, RSR has since fallen down below the line, making the previous breakout only a deviation.
This further solidifies the possibility of a breakdown, since such deviations are often followed by a sharp move in the other direction.
If RSR breaks down, the closest support area would be at $0.0152.
Conclusion
To conclude, the RSR price is expected to break down from the current support area and drop towards the support area at $0.0152. The reaction, once it gets there, will be helpful in determining if another drop is in store or if the alt-coin will begin to move upwards once more.
For BeInCrypto’s latest ICX analysis, click here!
Disclaimer: Cryptocurrency trading carries a high level of risk and may not be suitable for all investors. The views expressed in this article do not reflect those of BeInCrypto


