The Ripple (XRP) price has reached a weekly close above a crucial resistance level, indicating that the trend is bullish and the price could continue moving upwards to create new higher-highs.
The XRP price began to pick up steam at the beginning of July. when the price created a massive bullish engulfing candlestick in the weekly time-frame.
XRP Long-Term Bullish Close
Last week, the price reached a close of $0.307. Besides being the highest weekly close in a year, it was also notable for closing above the $0.29 level, which acted as support in the period from August 2018 to August 2019. Afterwards, the same area turned to resistance, rejecting the price on multiple occasions since.
Technical indicators show that the trend is still strong. Both the MACD and the RSI are moving upwards, and neither has generated bearish divergence. Furthermore, the long-term MACD has just turned positive, a sign that the price has likely begun a new bullish trend.

Cryptocurrency trader @Pentosh1 stated that XRP has made a higher-high in the weekly time-frame for the first time in 959 days. Pentoshi believes that this will be the start of the bull run and gave targets of $0.47 and $0.93, both of which are previous resistance and important Fib levels.

The Increase Continues
The XRP price has been increasing at an accelerated rate since July 19, when the price broke out and validated a massive descending resistance line. Afterward, the price found resistance near $0.315, was rejected, and is currently making another attempt at breaking out.
The MACD has made a bullish reversal and the RSI has broken out from a descending trend-line, both signs that the price will move upwards.

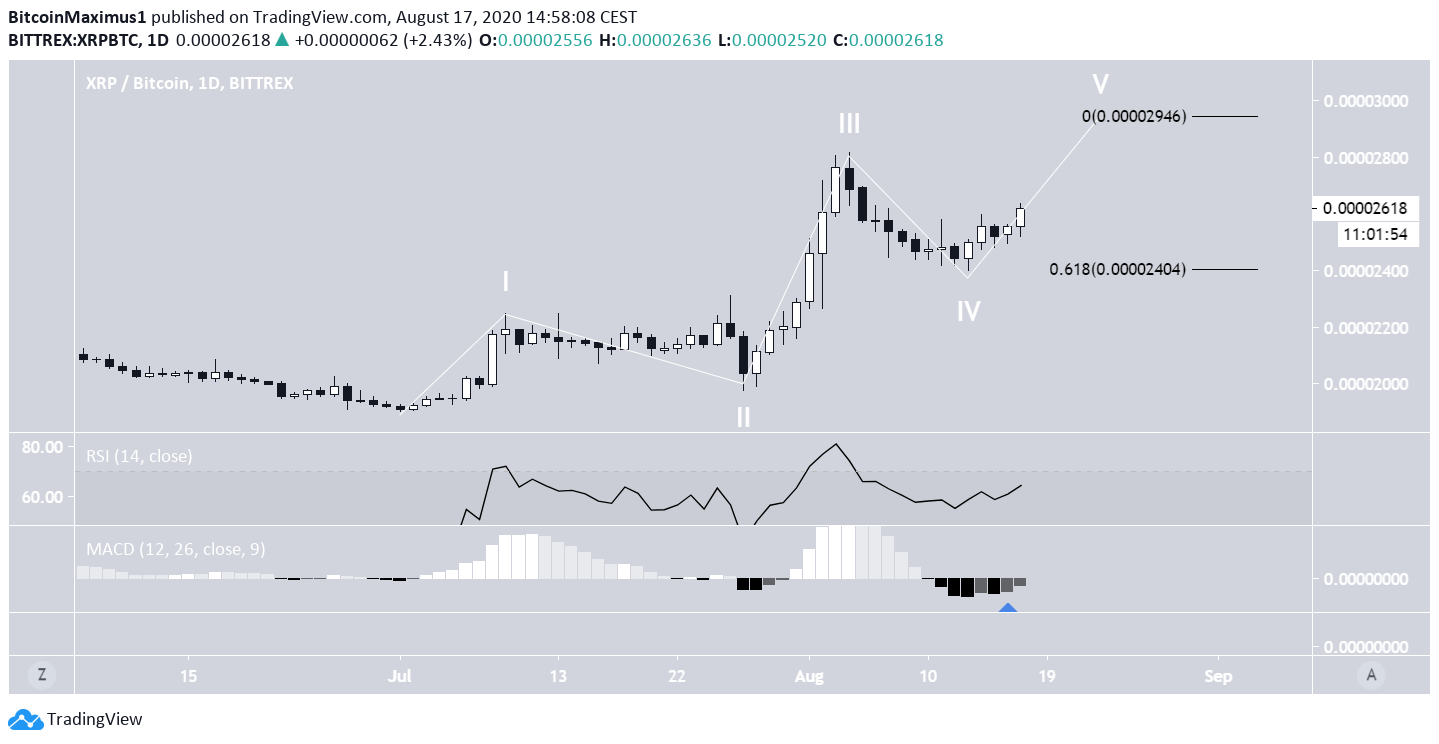
XRP/BTC
The XRP/BTC movement and technical readings are similar, both suggesting that the price will continue moving upwards.
It seems that XRP has just completed the fourth wave of an Elliott formation and has just begun the fifth. This gives us a minimum target of 2,944 satoshis and a likely target of 3,261 satoshis.
Both the daily MACD and RSI are bullish.