The Ripple (XRP) price is trading inside a descending wedge, from which it is expected to break out.
An eventual breakout above the current descending resistance line is also likely, though not in the short-term.
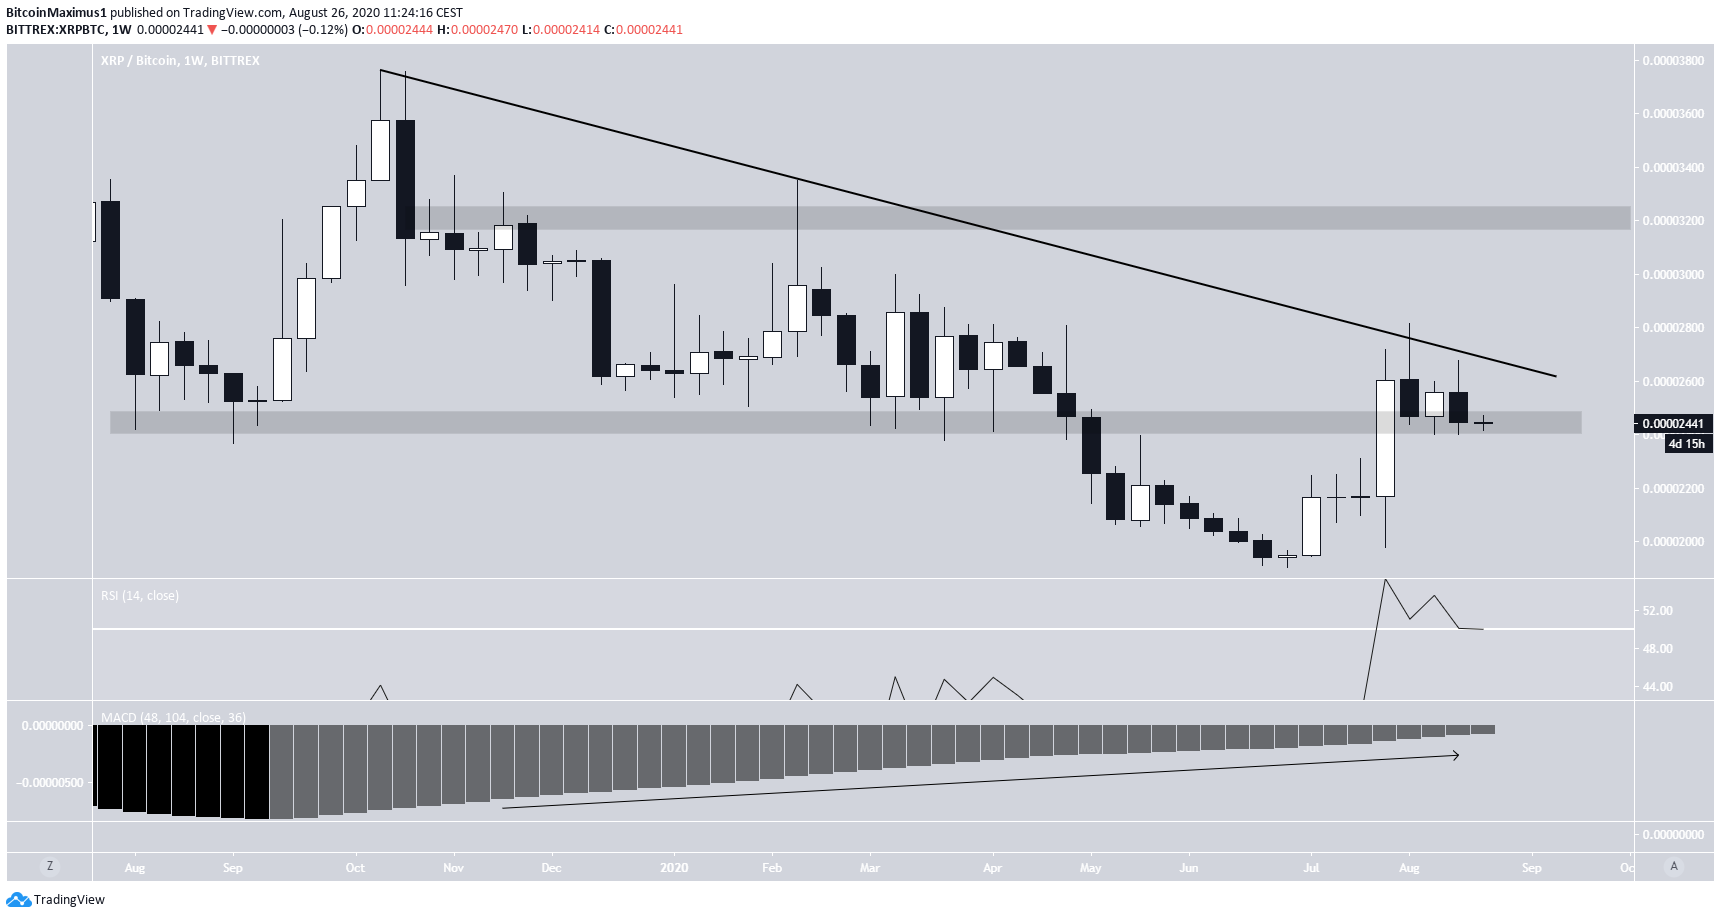
XRP Follows Descending Resistance Line
The XRP price has been following a descending resistance line since it reached a high of 3,760 satoshis in October 2019. Since then, the price has been rejected multiple times, most recently in August 2020.
The price has reclaimed the 2,450 satoshi level, which had previously acted as support throughout 2019. As long as the price is trading above this level, it is expected to eventually break out from the resistance line. If so, the next closest resistance area would likely be found at 3,200 satoshis.
Technical indicators are bullish. The RSI seems ready to bounce at 50, and the long-term MACD has been increasing for a long period of time and has almost crossed into positive territory.
This suggests that even if the price falls down below the current support area, it would still be expected to break out above the descending resistance line.
Short-Term Movement
Cryptocurrency trader @Crypto_Iso stated that the XRP price is expected to continue moving upwards to reach a descending resistance line at 2,650 satoshis:
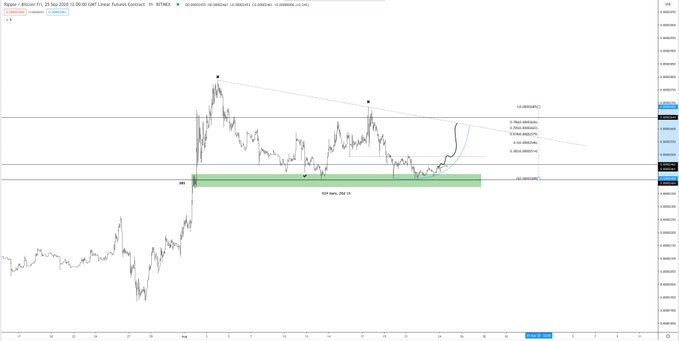
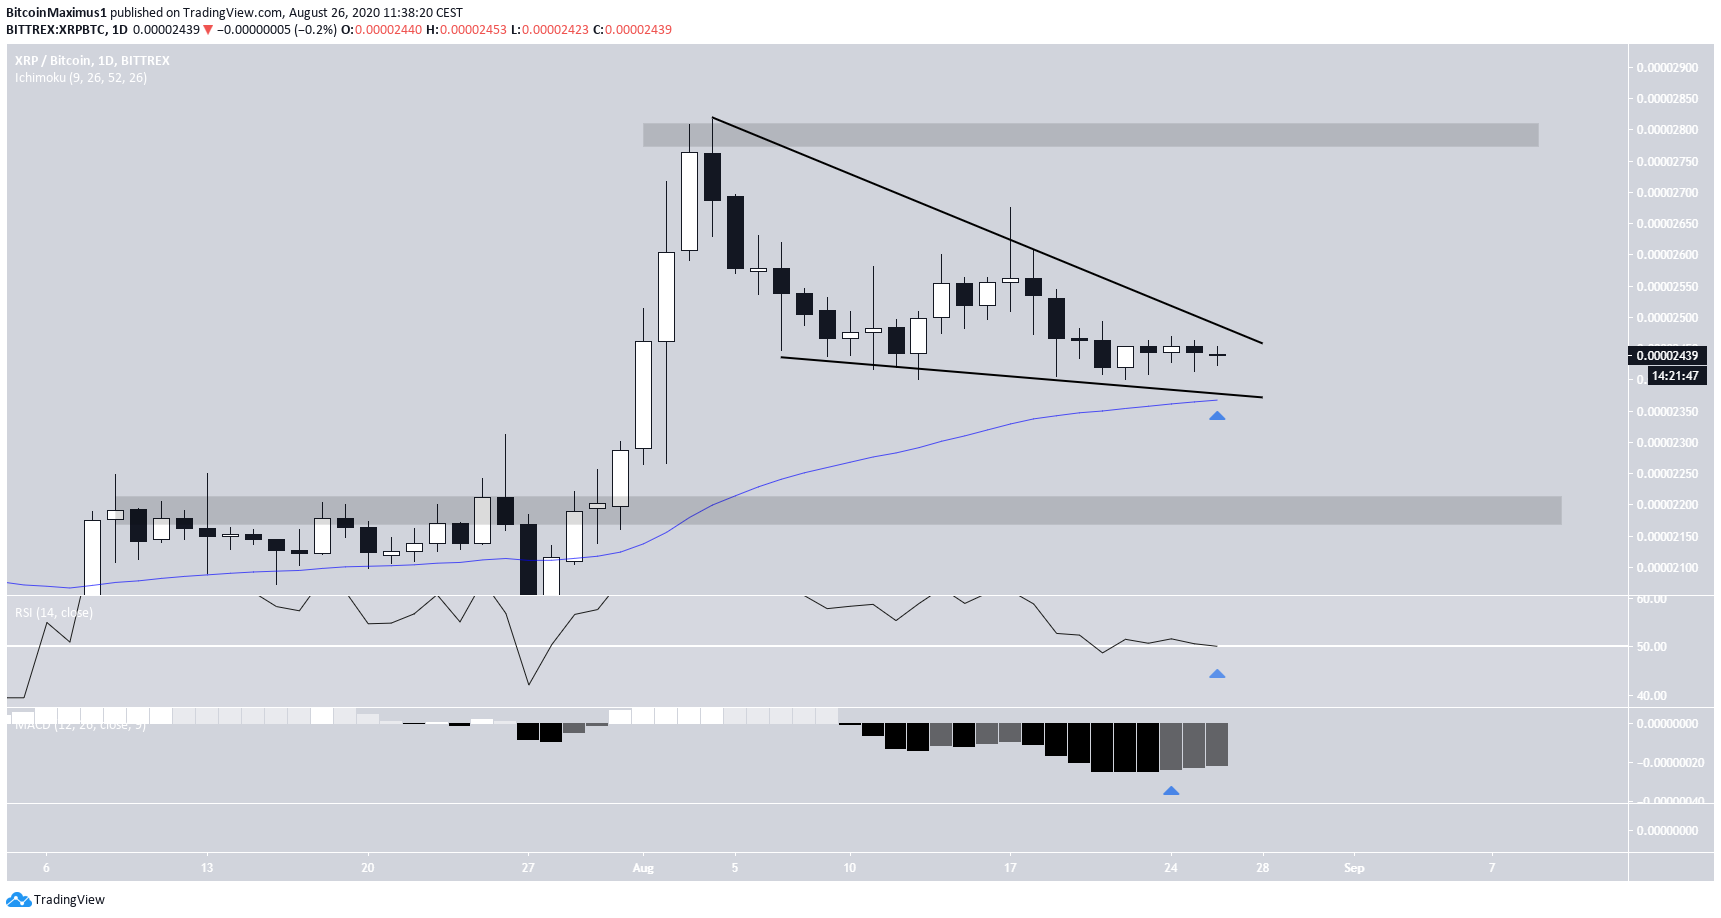
However, when looking at a shorter-term chart, it seems that the price is trading inside a descending wedge that is very near the current price. If the XRP breaks out, the next resistance would be found at 2,800 satoshis.
The price has sprung off the 50-day moving average (MA) and the RSI is at the 50-line, so this is a good spot for a bounce to the upside.
While there is no bullish divergence in the RSI, the MACD has given a bullish reversal signal.
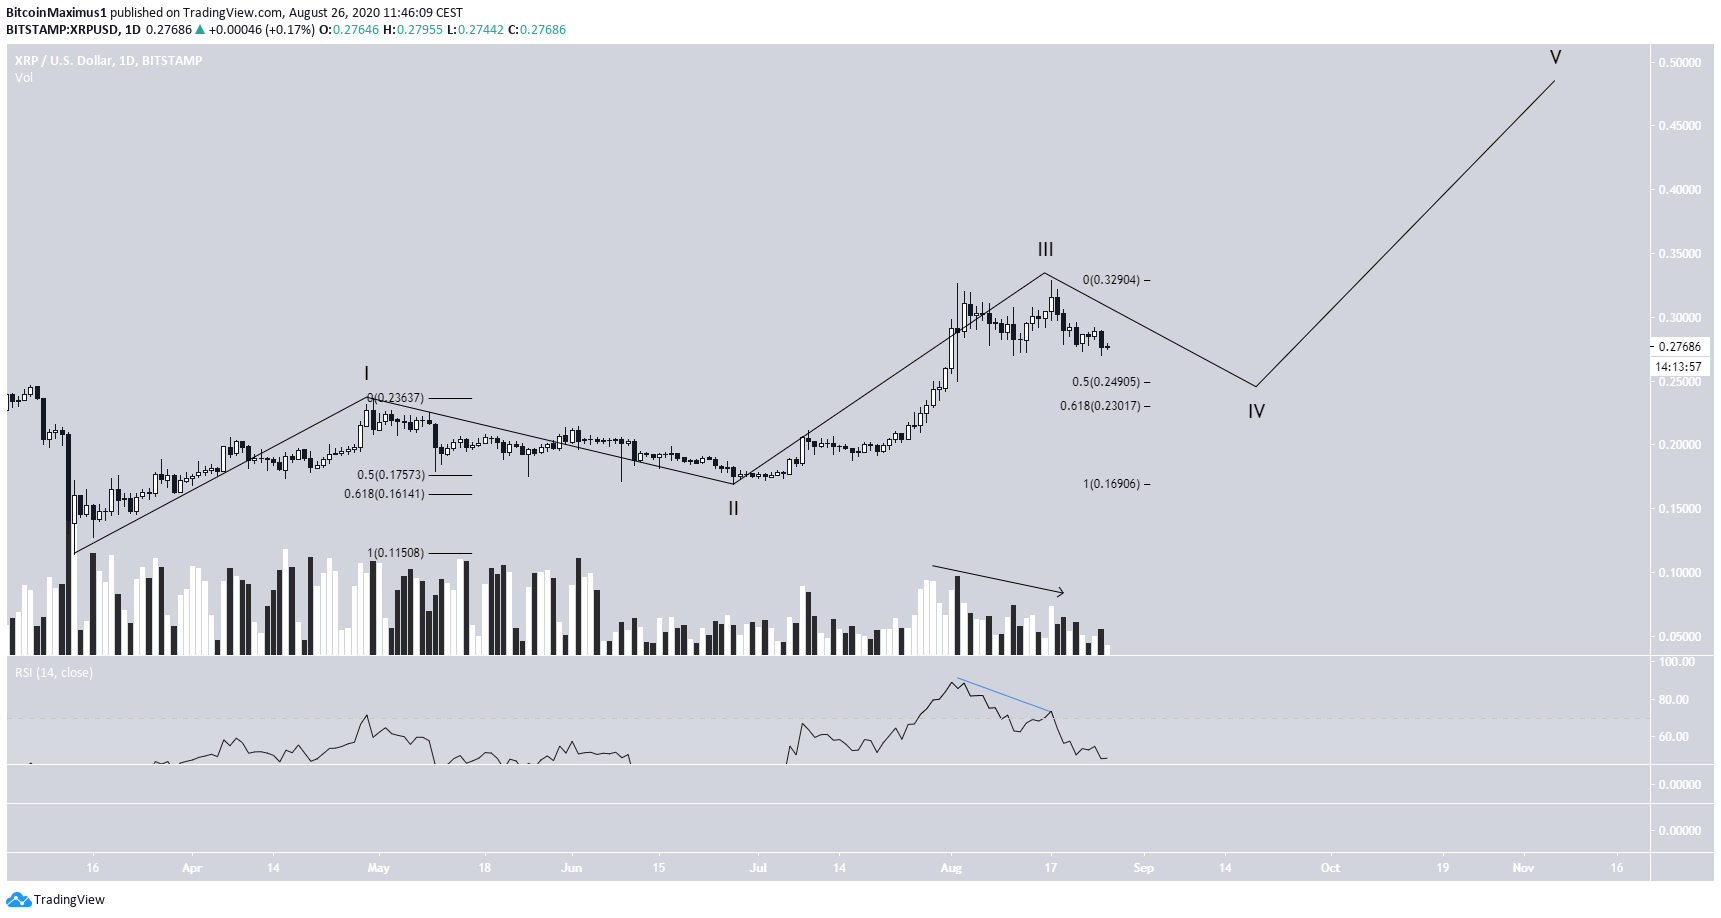
Wave Count
Beginning in March, the XRP price seems to have completed three waves out of a five-wave formation and is currently in the fourth.
Since the wave-1 high at $0.236 would invalidate this particular wave count, it’s expected to end at the 0.5 Fib level at $0.24.