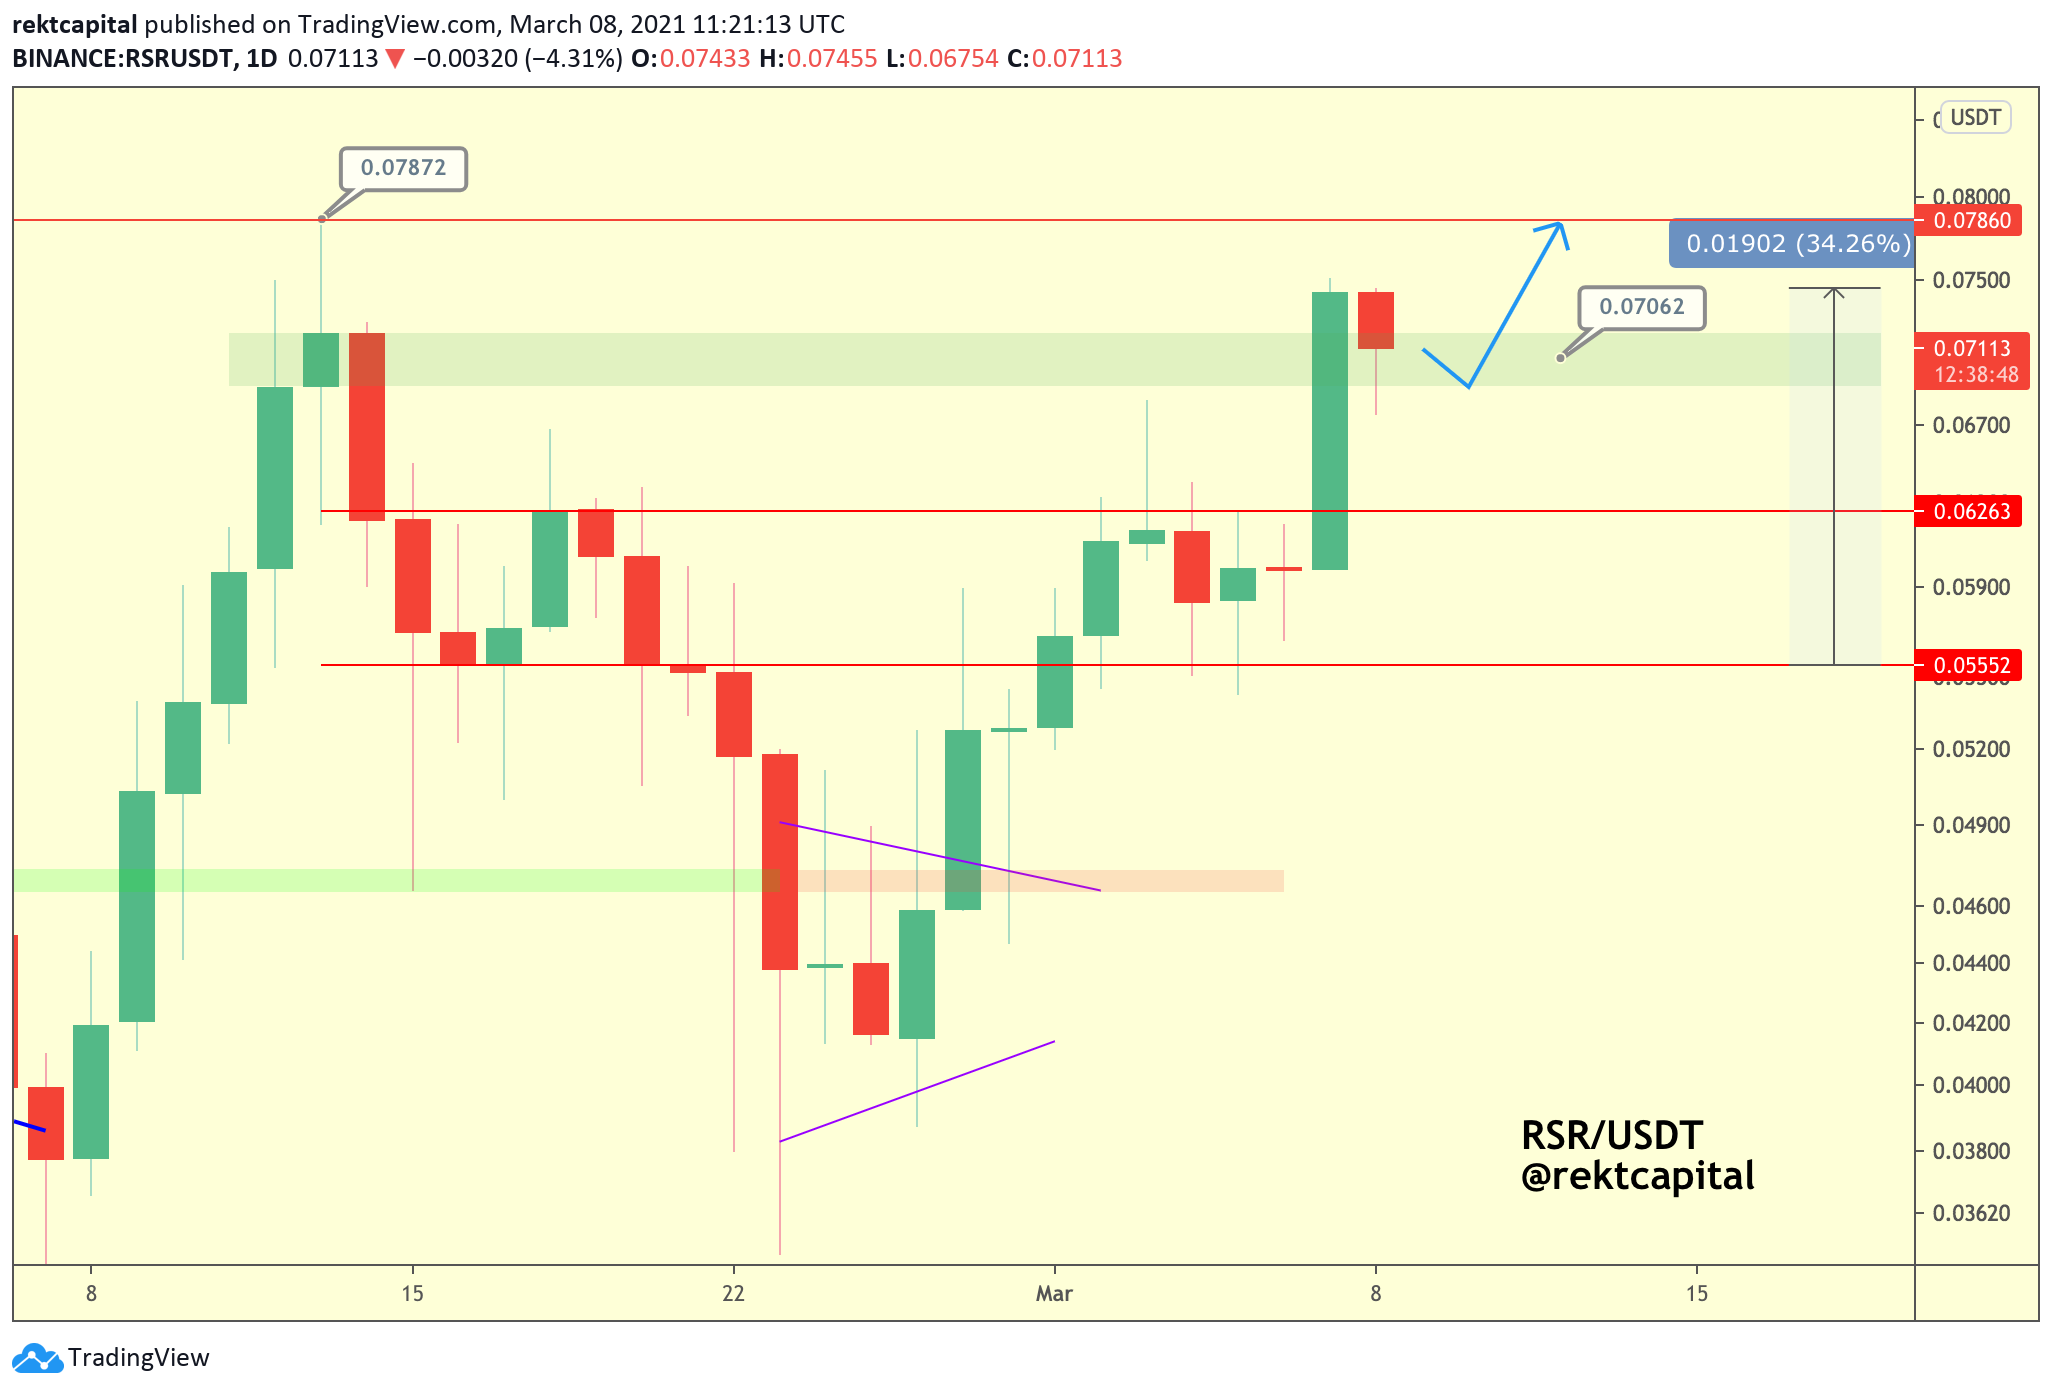
The Reserve Rights (RSR) price has been moving downwards since reaching an all-time high price of $0.078 on Feb. 14.
Despite the drop, Reserve Rights has bounced at the previous resistance area and is expected to reach a new all-time high price soon.
Reserve Rights Bounces At Previous All-Time High
During the week of Feb. 18- 15, RSR created a large bullish candlestick and reached an all-time high price of $0.078 on Feb. 14.
While it decreased afterward, it managed to reach a close above the previous all-time high resistance area of $0.0465, validating it as support. Later, it bounced considerably, creating a bullish engulfing candlestick last week.
Currently, RSR is trading near $0.07, close to reaching a new all-time high price.
While the RSI has generated bearish divergence, both the MACD & Stochastic oscillator are increasing, a sign of a bullish trend.
New All-Time High?
Cryptocurrency trader @Rektcapital outlined an RSR chart, stating that it is very close to reaching a new all-time high and moving into price discovery.
There are mixed signs on the daily time-frame.
On the bullish side, yesterday’s close is the highest ever. It is even higher than that on Feb. 14, when it reached the all-time high price. The Stochastic oscillator has just made a bullish cross, and the MACD is positive.
On the bearish side, there is bearish divergence in both the MACD & RSI. Furthermore, it is possible that RSR has created a double top pattern. The double top is considered a bearish reversal pattern.
Nevertheless, there are strong support areas that RSR has reclaimed, so even if a short-term drop were to occur, RSR would be expected to find support at one of these levels. The support areas are at $0.068, $0.056, and $0.050.
There is some bearish divergence in the MACD, and the RSI has crossed below 70, so a small drop might occur before continuation.
The most likely one would be the $0.056 one, the 0.5 Fib retracement of the entire upward move.
If RSR goes to price discovery, a potential target for the top of the move is found at $0.01.
RSR/BTC
The RSR/BTC price had been trading below the 130 satoshi resistance area since September 20.
However, it is currently in the process of breaking out, having reached its highest close since Sept 0 last week.
As evidenced by the bullish reversal signal in the MACD and the bullish cross in the Stochastic oscillator, technical indicators are bullish.
If RSR continues to move upwards, it will find the next closest resistance area at 190 satoshis.
Conclusion
To conclude, while the possibility of a short-term drop remains, RSR/USD could reach a new all-time high price.
RSR/BTC is expected to increase towards 190 satoshis.
For BeInCrypto’s latest Bitcoin (BTC) analysis, click here.
Disclaimer
In line with the Trust Project guidelines, this price analysis article is for informational purposes only and should not be considered financial or investment advice. BeInCrypto is committed to accurate, unbiased reporting, but market conditions are subject to change without notice. Always conduct your own research and consult with a professional before making any financial decisions. Please note that our Terms and Conditions, Privacy Policy, and Disclaimers have been updated.


