


The Reserve Rights (RSR) price has been increasing since Oct 7 and just broke out from an important resistance area.
The increase is expected to accelerate if RSR can break out from its current short-term pattern.
RSR Breakout Above Resistance
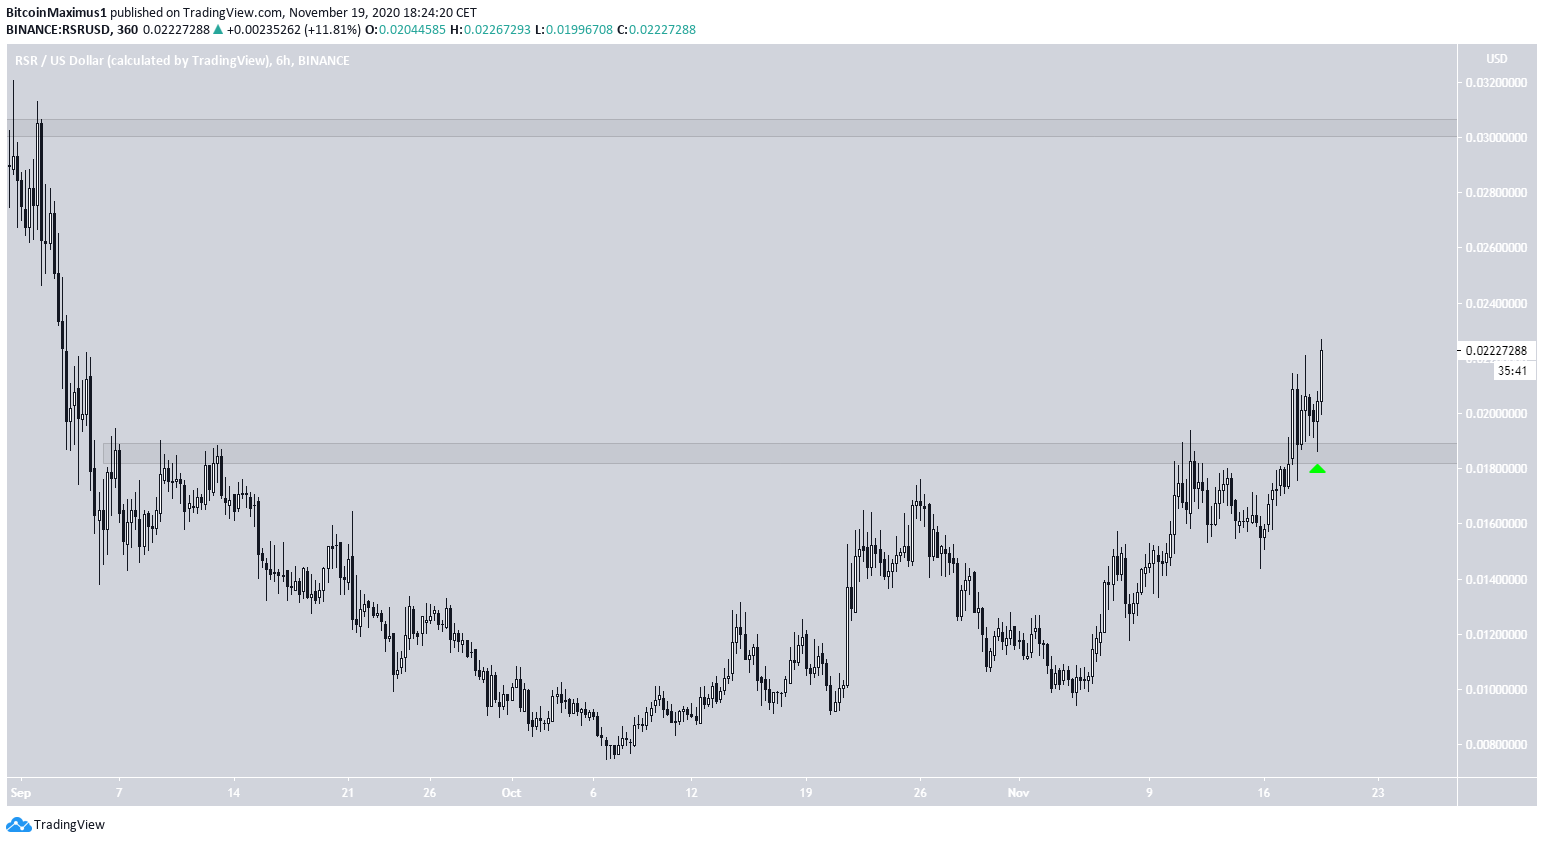
The RSR price has been moving upwards since it reached a low on Oct 7. The price broke out from the resistance area of $0.0185 on Nov 17, validated it as support in the form of a long lower wick, and has been moving upwards since.
There is a lack of resistance above the current price, and the next resistance area is found near the previous all-time high at $0.03.
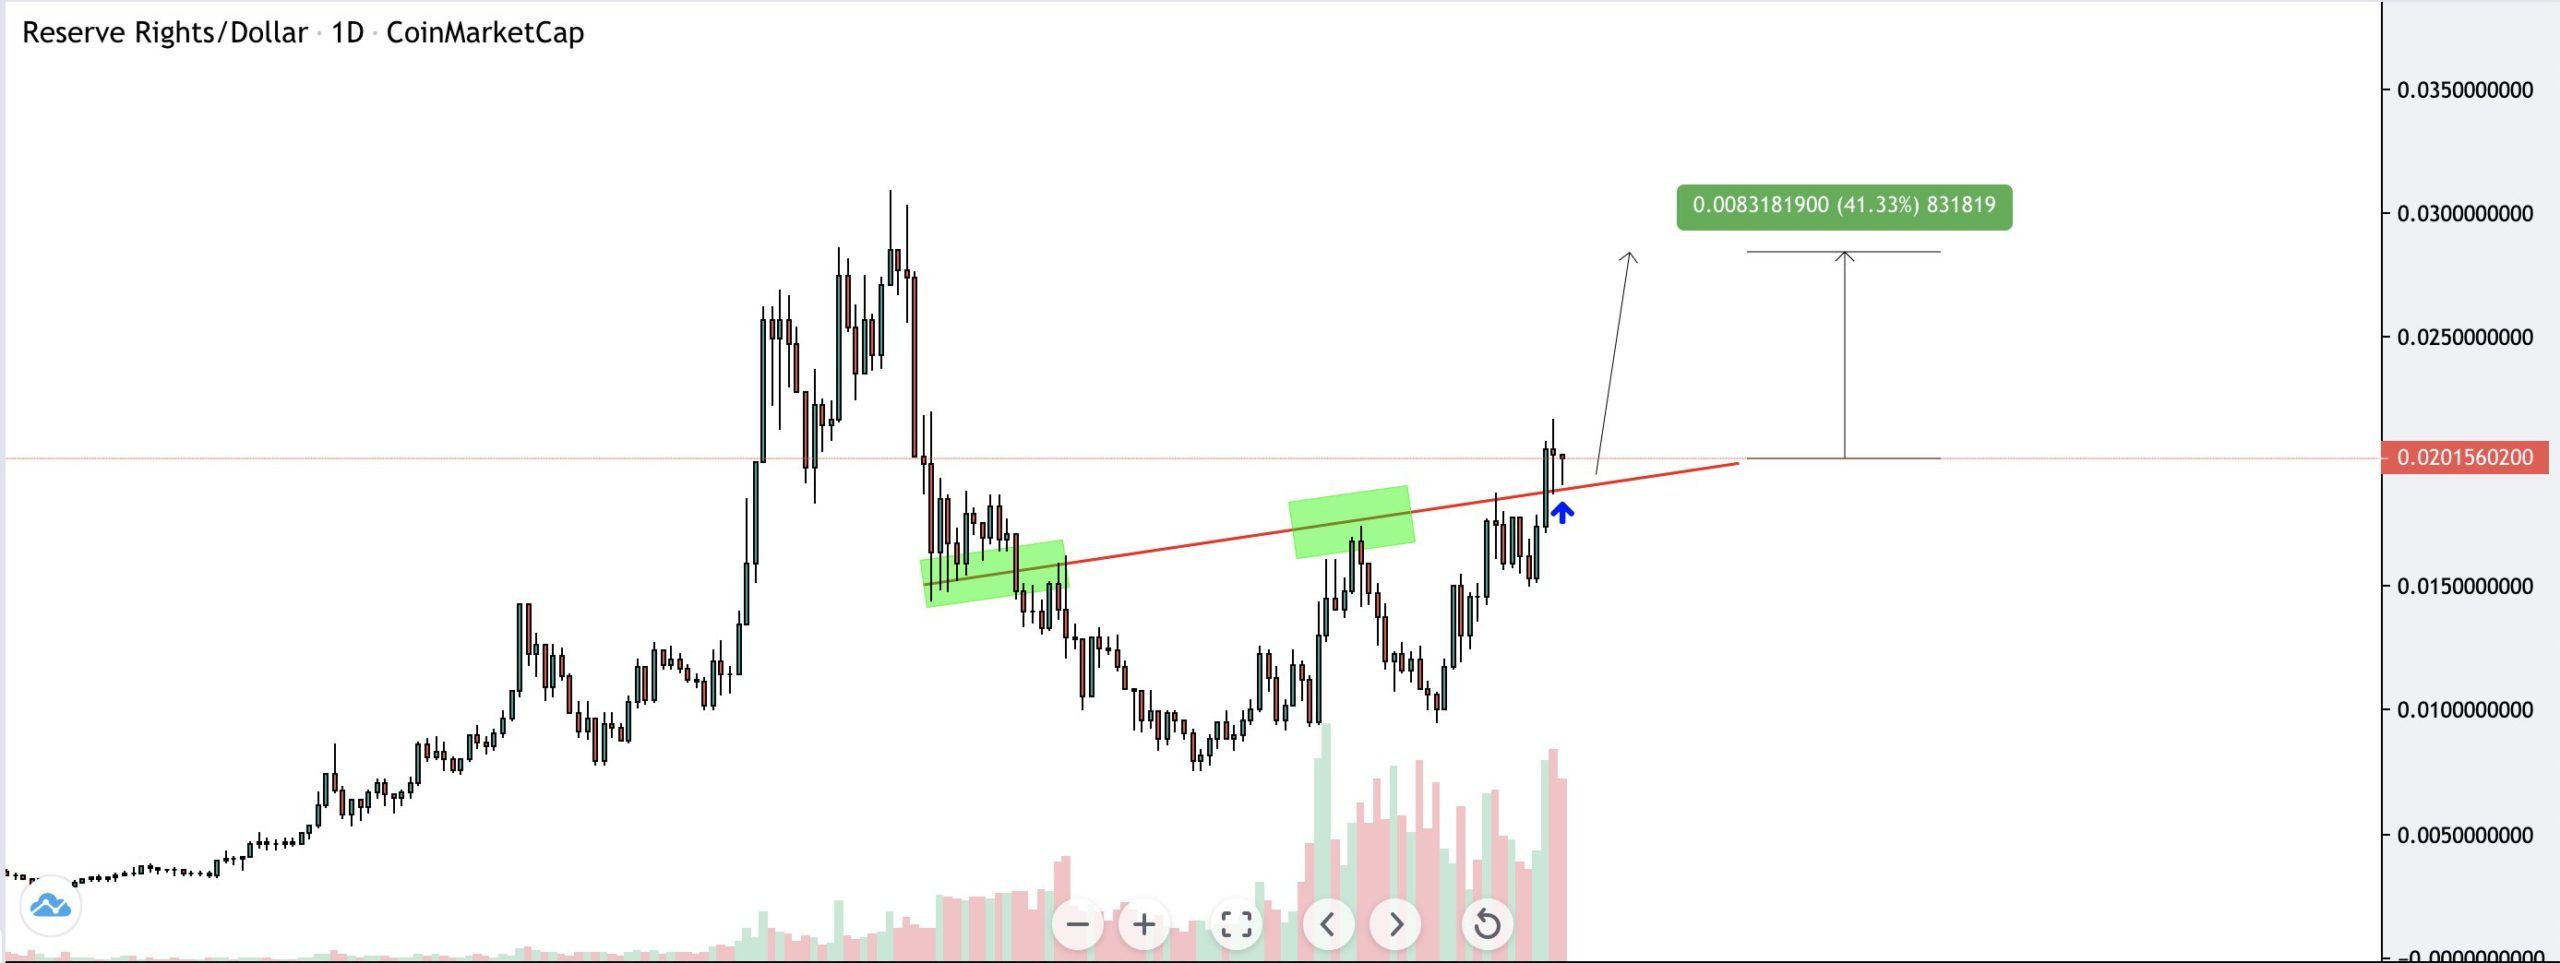
Cryptocurrency trader @CryptoNewton outlined an RSR chart and predicted that the price is likely to move higher, also giving a target near $0.03. Due to the lack of resistance between the current price and $0.03, it seems likely to be reached.
Future Movement
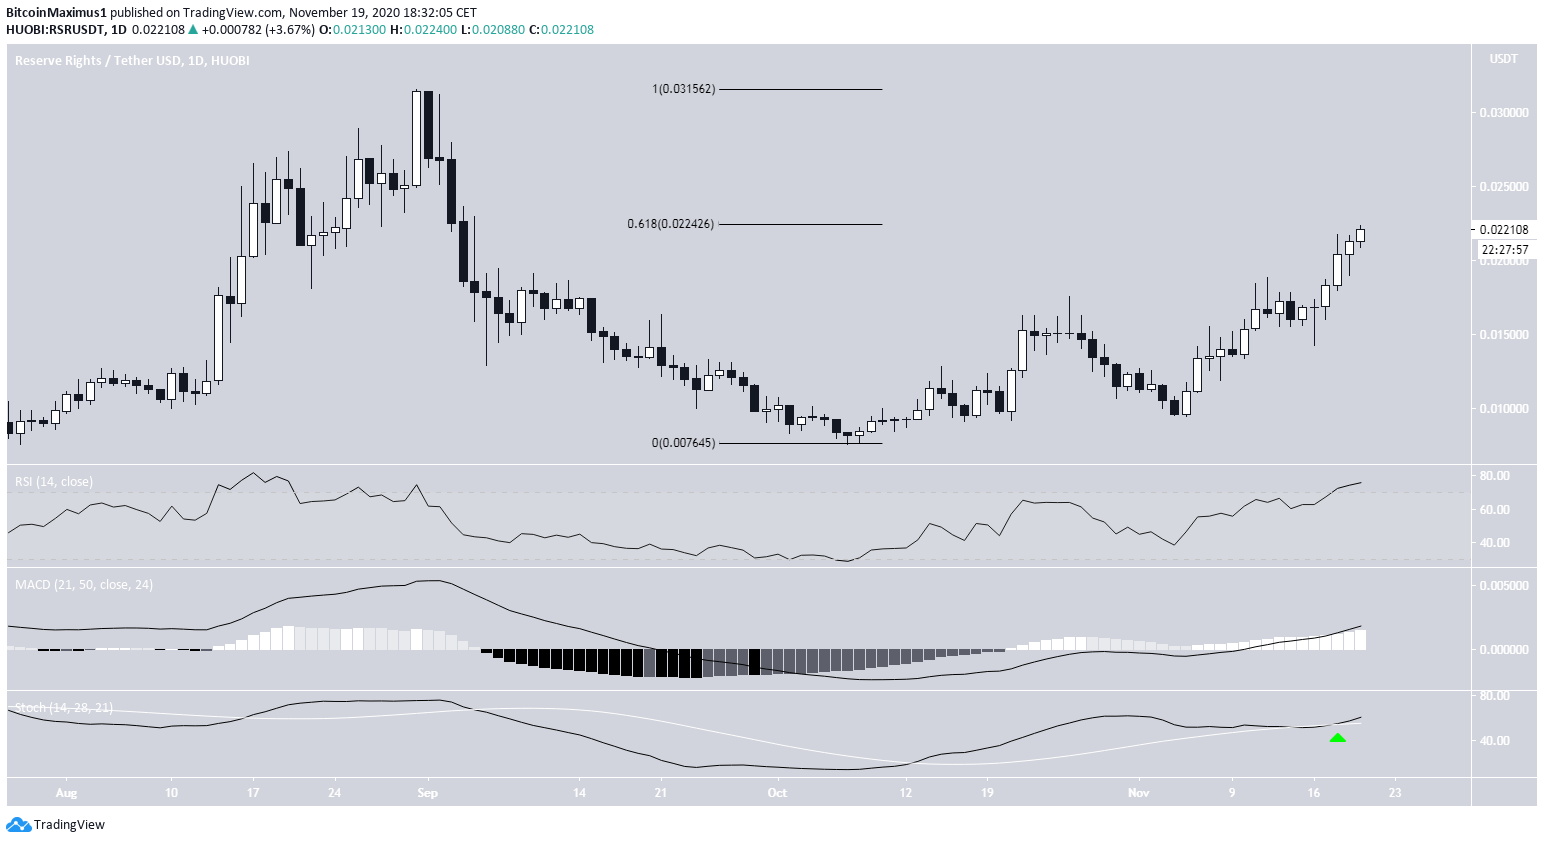
Technical indicators in the daily time-frame are bullish. The RSI, MACD, and Stochastic oscillator are increasing, and the latter has made a bullish cross. However, the RSI is overbought, suggesting that the rally is overextended.
While the long-term trend seems to be bullish, the price is trading right at the 0.618 Fib retracement level, suggesting that a possible short-term rejection could occur.
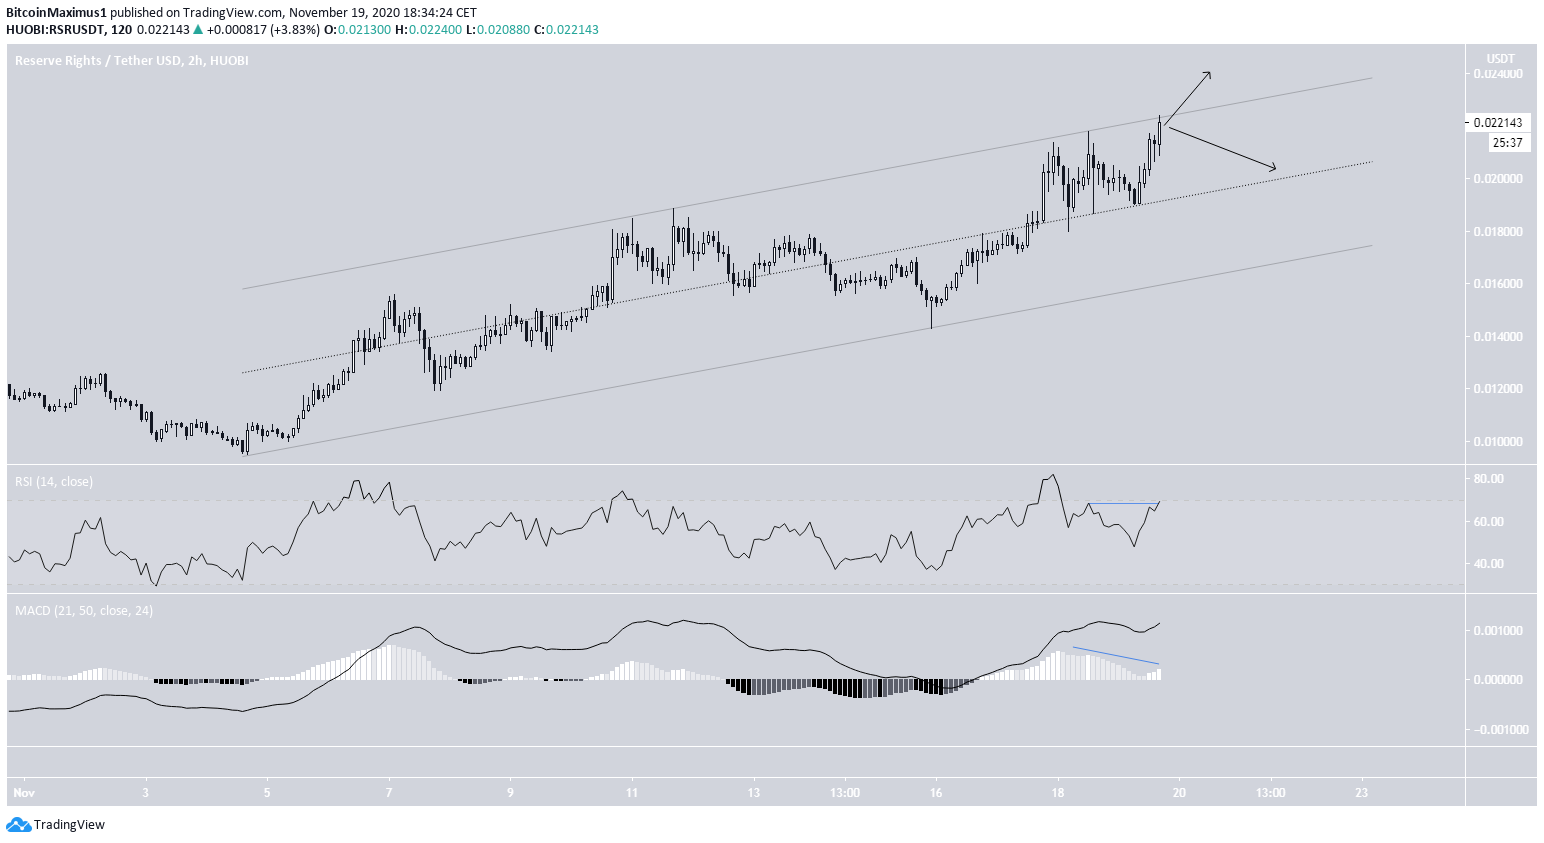
The short-term chart shows that the price is trading inside an ascending parallel channel, and is currently right at the resistance line of the pattern.
There is a bearish divergence in the MACD and an unconfirmed bearish divergence in the RSI. If a rejection occurs, which would also fit with the 0.618 Fib retracement level, the RSR price could decrease towards the middle of the channel before eventually moving upwards.
If a breakout occurs, the rate of increase is likely to accelerate quickly towards $0.03.
Conclusion
To conclude, while a short-term rejection could occur, the RSR price is expected to move towards $0.03. The rate of increase is likely to accelerate if RSR breaks out from its current short-term pattern.
For BeInCrypto’s latest Bitcoin analysis, click here!
Disclaimer: Cryptocurrency trading carries a high level of risk and may not be suitable for all investors. The views expressed in this article do not reflect those of BeInCrypto


