


The REN (REN) price is making an attempt at moving above an important resistance area, a breakout above which could trigger a rapid increase.
Rapid Upward Move Has Stalled
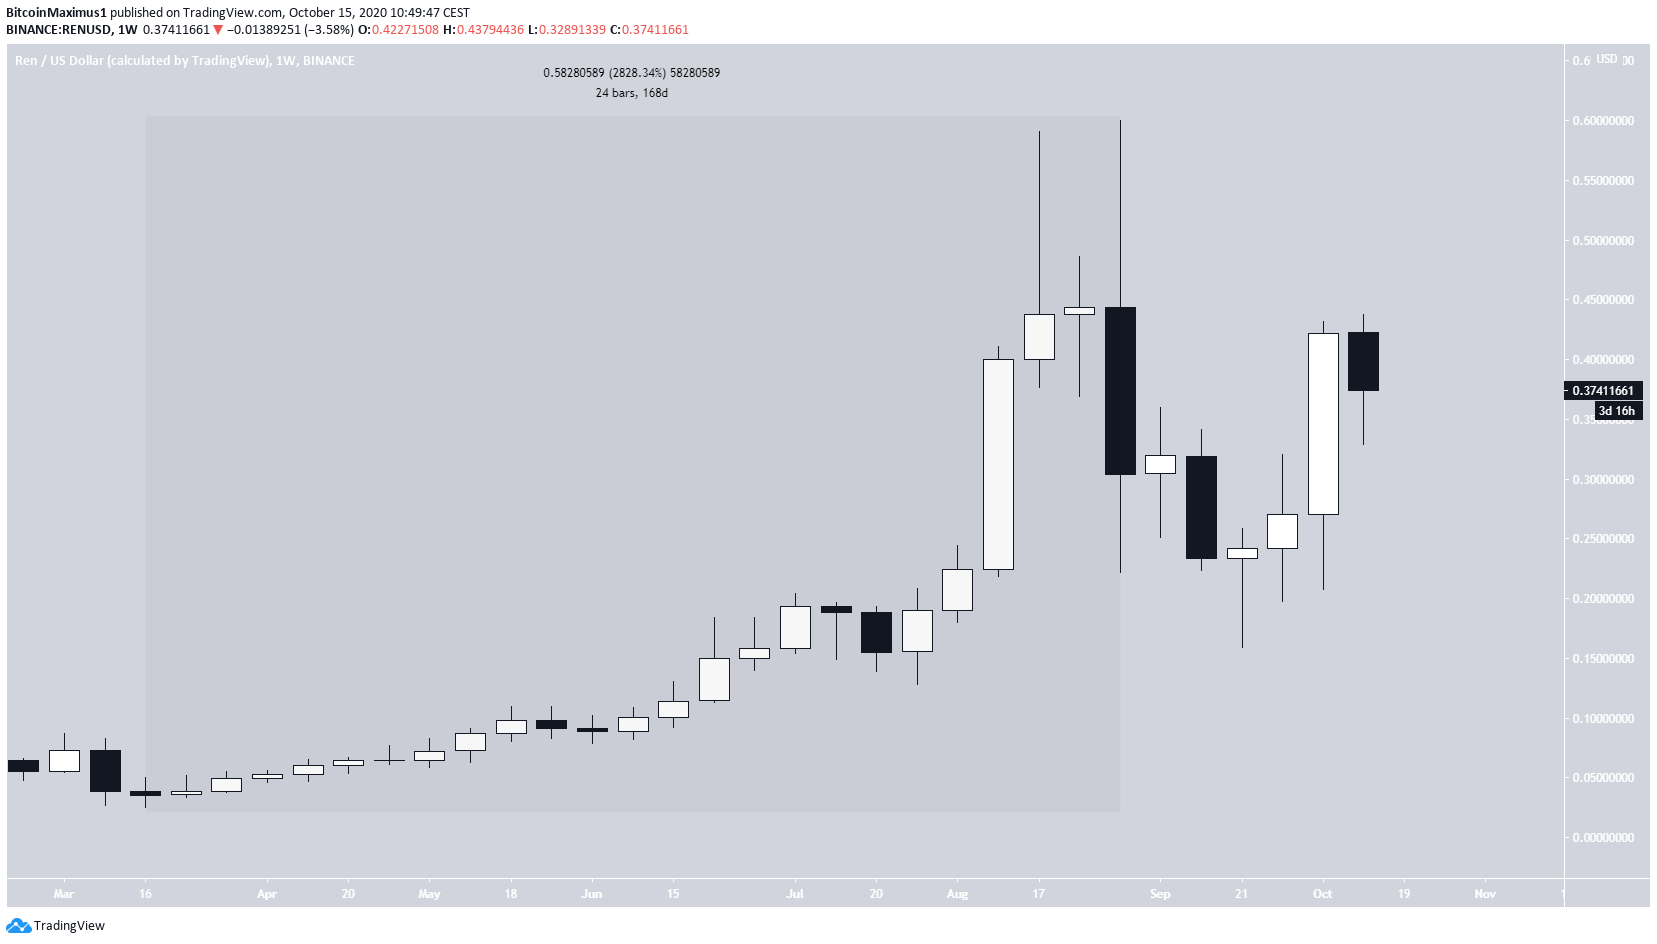
Since the beginning of March, the REN price has been subject to a rapid upward move that culminated with a high of $0.60, reached on Sept. 1. The high amounted to an increase of 2,828% when measuring from the March low of $0.0251.
However, the price has been decreasing since.
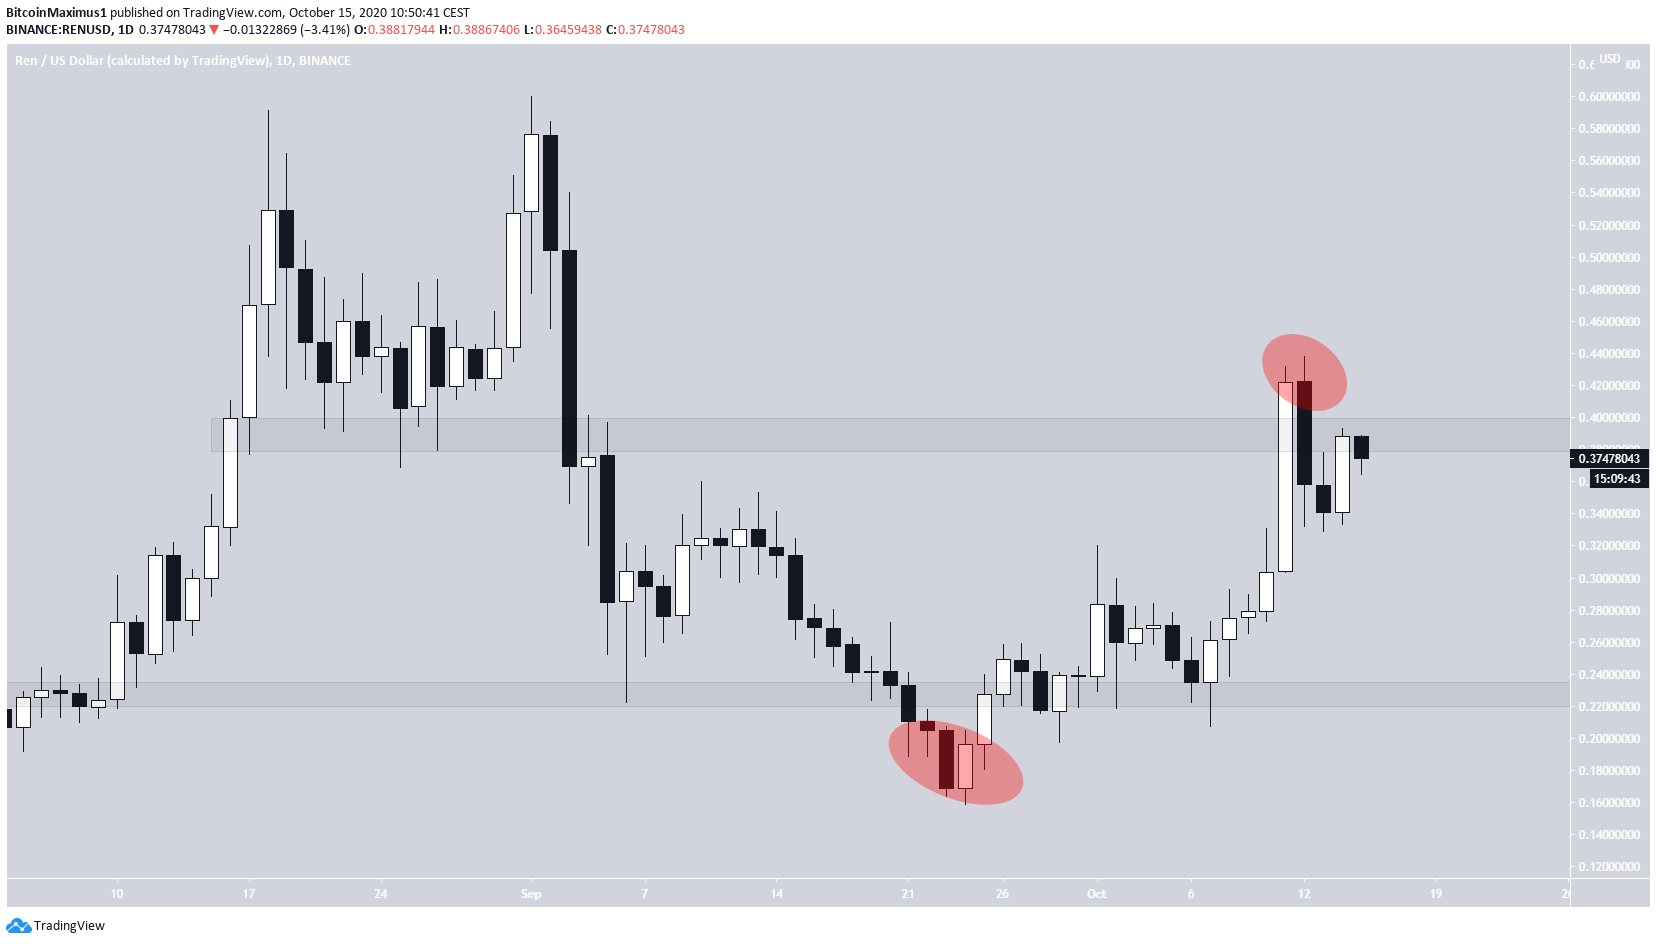
Throughout the decrease, the price has been generally trading in a range between $0.23 and $0.29. However, it has deviated below and above this range twice, on Sept. 23 and Oct. 12 respectively.
The deviation below the support area was followed by an increase towards resistance. Since the deviation above the resistance area, the price has decreased below it once more, possibly validating it as resistance. However, the price still has not lost the support of the bullish engulfing candlestick that caused the breakout.
Therefore, a look at technical indicators is required to determine whether the price will decrease towards support or continue its ascent.
Breakout And Re-test
Cryptocurrency trader @Tradingroomapp tweeted a REN chart that outlines a potential increase of 36%, which would take the price towards $0.35 and $0.39.
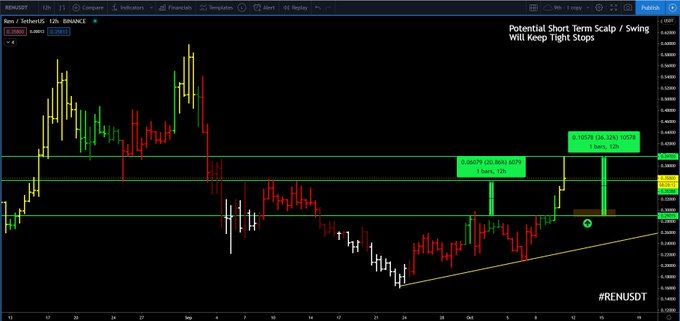
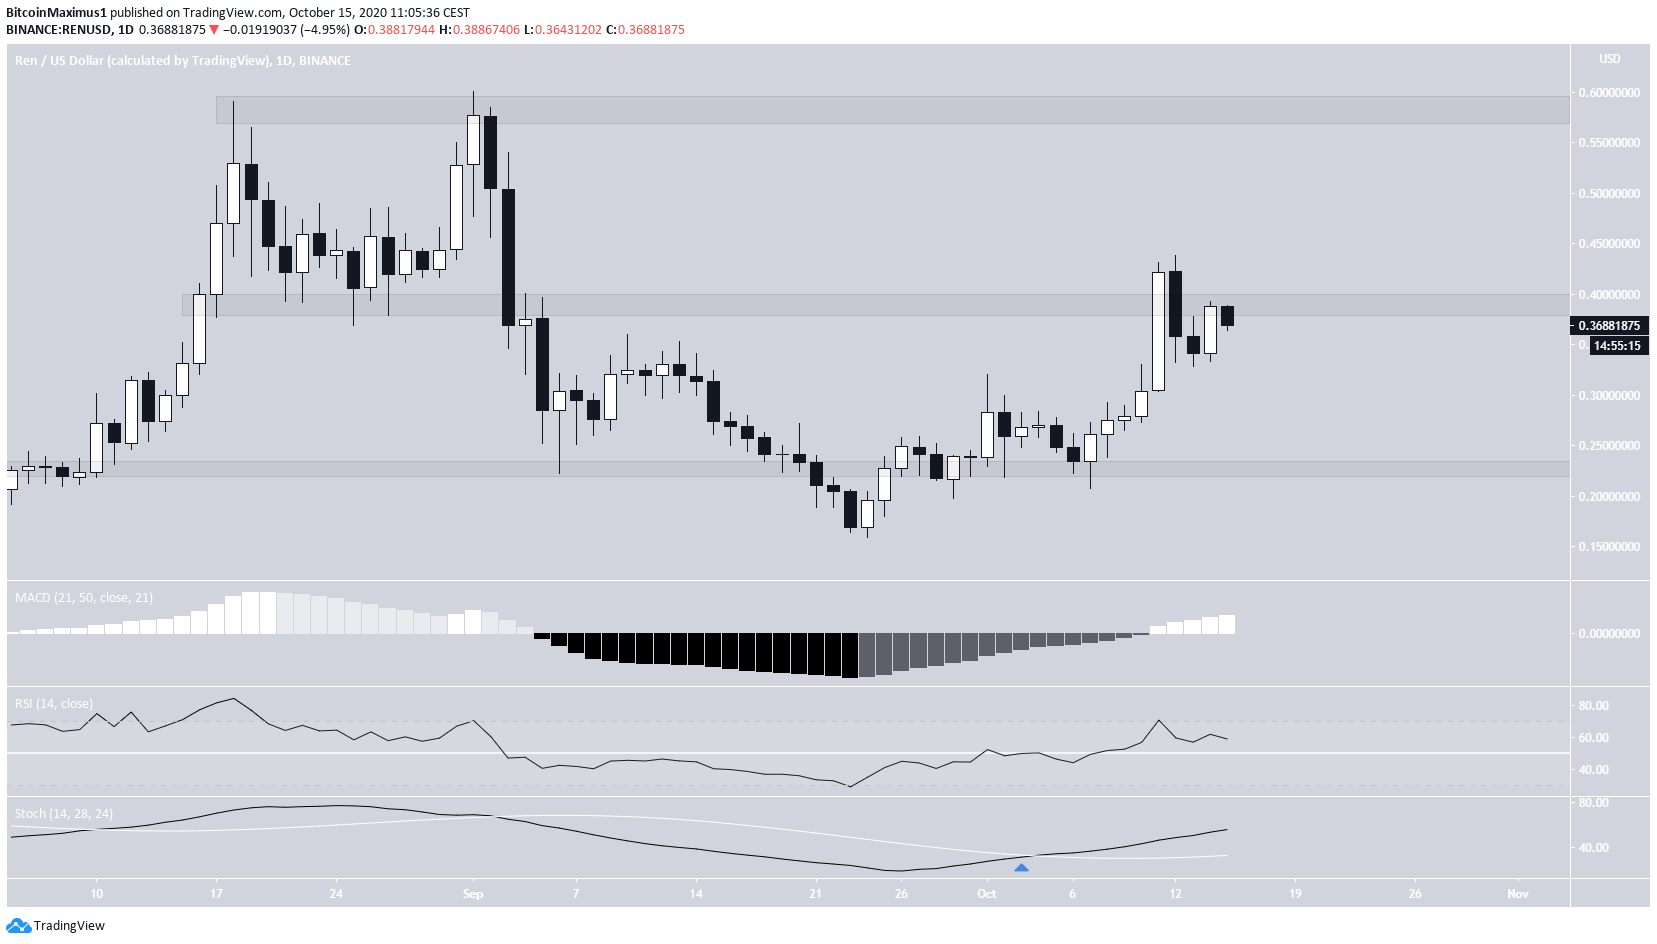
Since the tweet, the price has already reached the target, stalling right at the resistance area of $0.39. However, technical indicators in the daily time-frame are still bullish. All three of the MACD, RSI and Stochastic are increasing. Furthermore, the MACD has crossed into positive territory, the RSI is above 50 and Stochastic has made a bullish cross.
If the price manages to reclaim the $0.39 area, it could continue increasing all the way to $0.59.
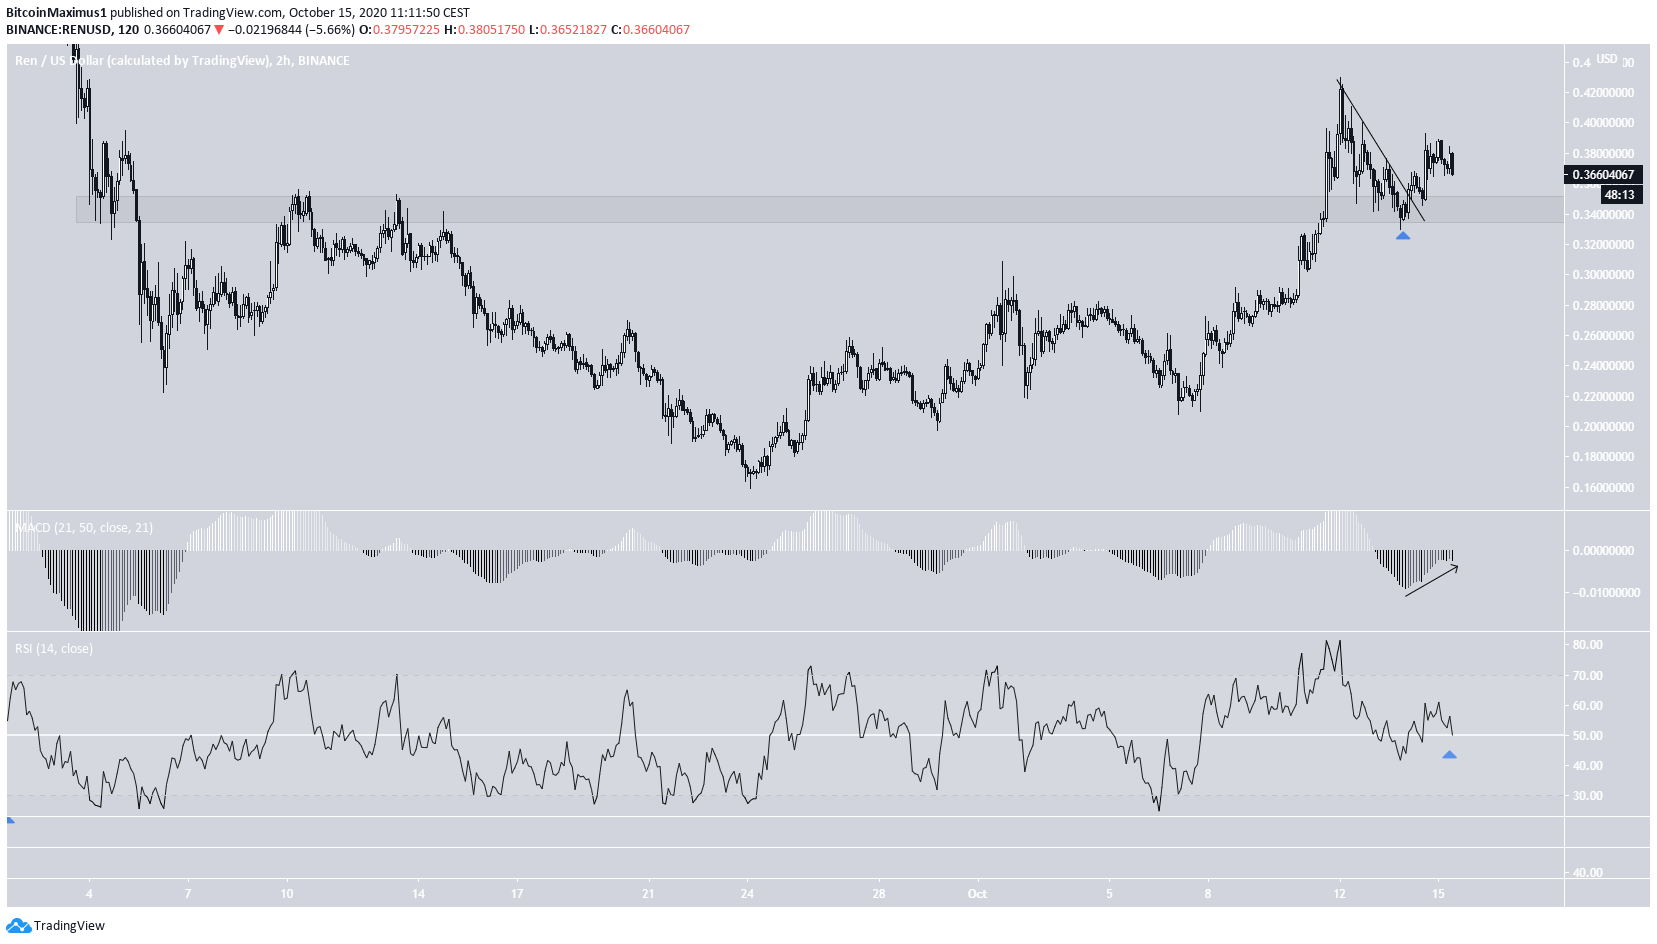
The two-hour chart supports this possibility, since the current decrease looks like a re-test of the most recent resistance area.
Furthermore, the price has already broken out from a descending resistance line, and technical indicators suggest an upward move is likely. A breakdown from the $0.34 minor support area would invalidate this possibility.
To conclude, the REN price is expected to continue moving upwards towards the closest resistance area.
For BeInCrypto’s latest Bitcoin analysis, click here!
Disclaimer: Cryptocurrency trading carries a high level of risk and may not be suitable for all investors. The views expressed in this article do not reflect those of BeInCrypto.


