


On February 3, the Ravencoin (RVN) price broke out from a descending wedge. It has been increasing since.
Ravencoin (RVN) Highlights
- The RVN price broke out from a descending wedge.
- It is trading inside an ascending channel.
- There is resistance at 450 satoshis.
- A long-term target is given at 650 satoshis.
- The weekly RSI is bullish.
Technical analyst @Pierre_crypt0 tweeted a Ravencoin chart that shows that the price is currently in the process of breaking out above a very significant daily moving average. If the price reaches a daily close above 370 satoshis, he believes that the breakout will be confirmed.
$RVN #Ravencoin – 1D – Update
Once again, a coin consolidating below 200d EMA and above 200d MA, with volume kicking in ended… Breaking up.
Will share a chart later, long road to go before daily close but ideally we get a close > 365-370 sats if #Bitcoin allows it. https://t.co/iai5NeMDDR
— Pierre (@pierre_crypt0) February 14, 2020
Will Ravencoin be successful in breaking out? If yes, where will it head afterward? Continue reading below if you want to find out.
Wedge Breakout
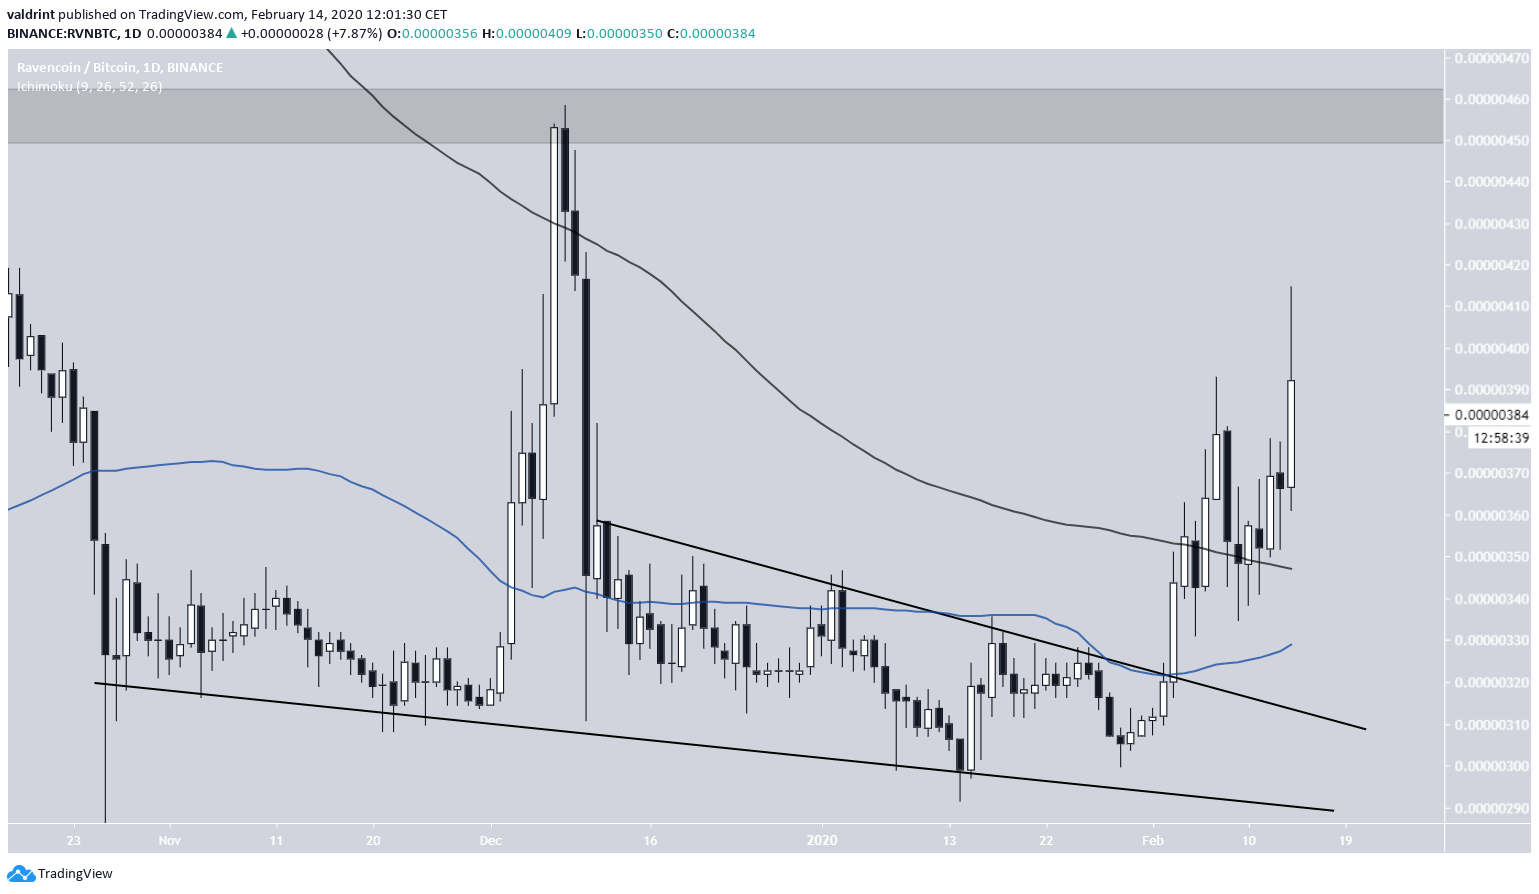
On February 3, the RVN price broke out from a descending wedge and has been increasing since.
The upward move has caused the RVN price to move above its 200-day moving average (MA), which was outlined in the tweet.
In addition, the 50-day MA is moving upwards with a steep slope, setting up a golden cross within the next week — confirming that the price is in a bullish trend.
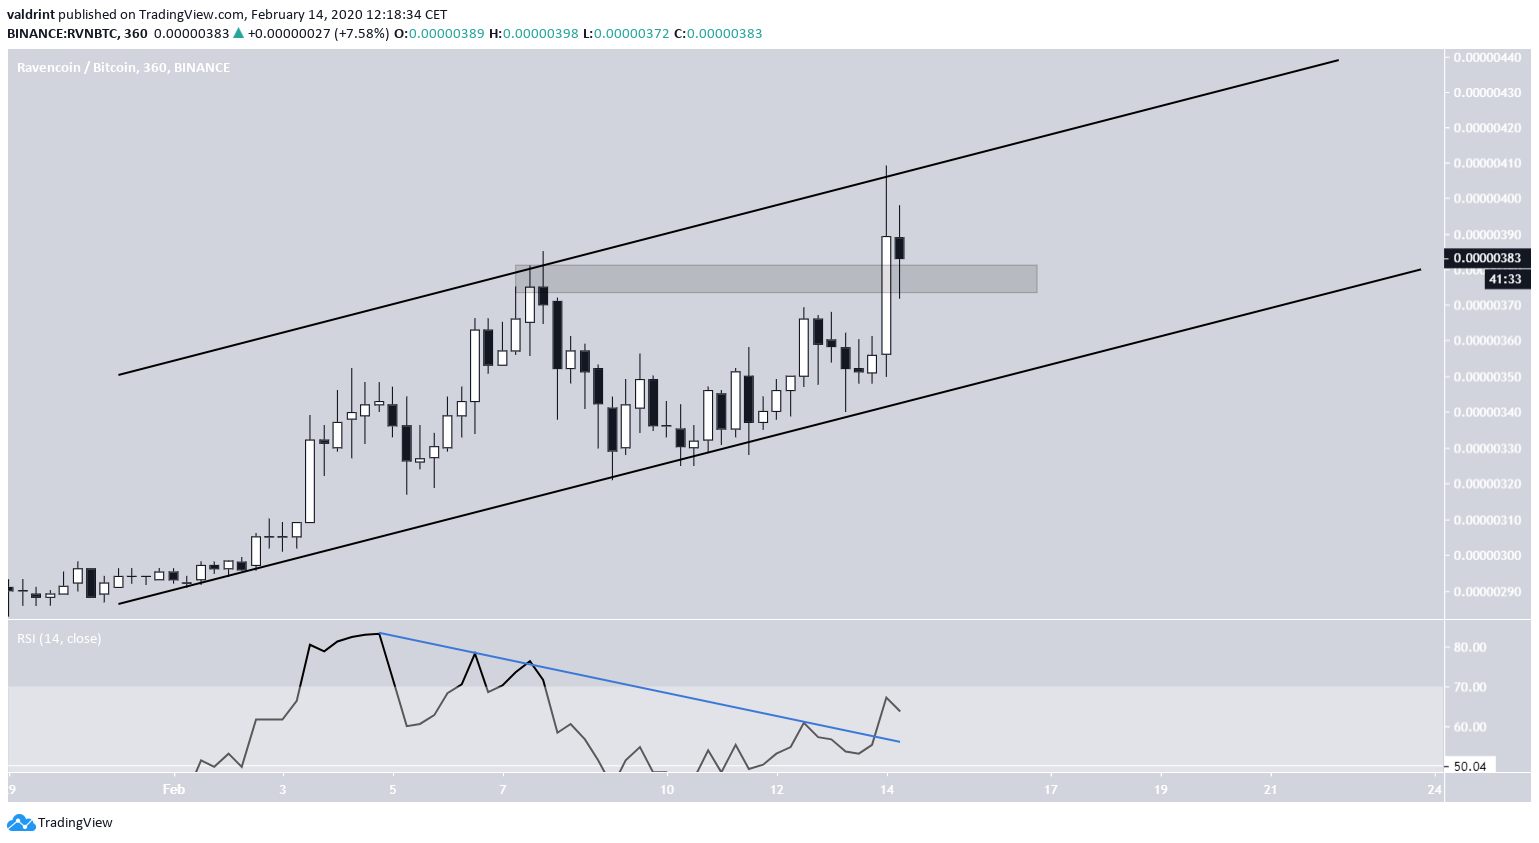
Since the breakout, the RVN price is likely trading inside an ascending channel and is very close to the resistance line of the channel, which has been reached in the form of an upper wick.
While the bearish divergence in the RSI raises some concerns, its trend-line has been broken.
Also, the price has possibly broken out above the previous high and validated it as support with the current candlestick. If this minor 380 area is used as support, the price is likely to stay near the resistance line of the channel and continue moving upwards until it reaches the aforementioned resistance area of 450 satoshis.
Long-Term Movement
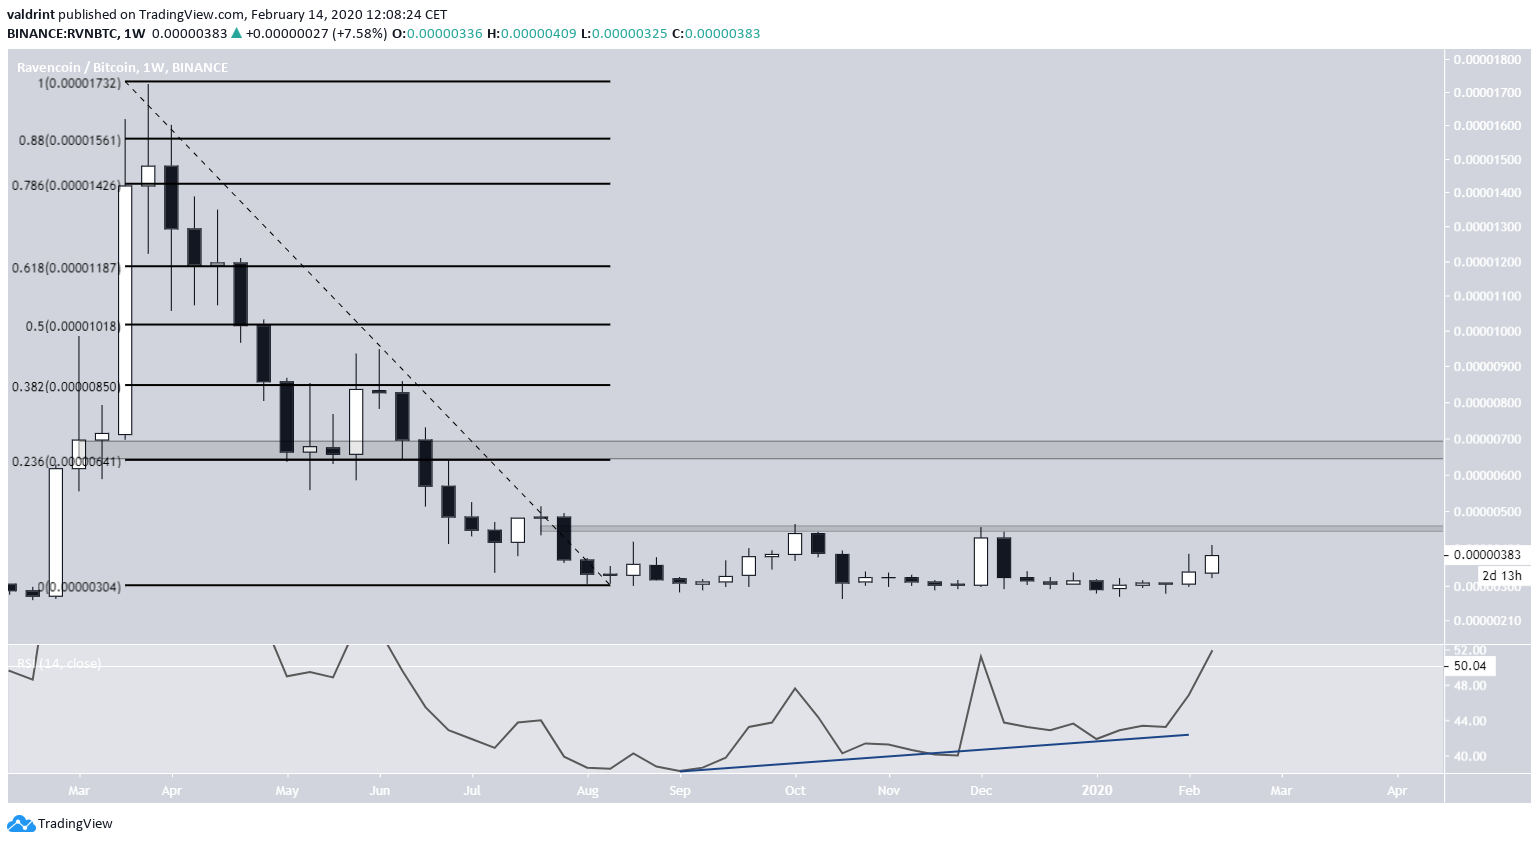
In the long-term, the first area that can credibly initiate a reversal is found at 6500 satoshis, being the 0.236 Fib level of the decrease from the all-time high.
A more interesting development comes from the weekly RSI. It has been generating bullish divergence since August 2019. In addition, the recent price increase caused it to move above the 50-line, confirming that the RVN price is in a bullish trend.
A price breakout above 450 satoshis would confirm that the consolidation phase has ended and RVN has begun a bullish market cycle.
To conclude, the RVN price has broken out from a descending wedge and its heading towards the range high at 450 satoshis. A breakout above this area would confirm that the price is in a bullish market cycle.


