


After failing for the past four months, the Ravencoin (RVN) price has finally flipped its 100-day moving average (MA) as support.
This could be a sign that the price will soon initiate an upward move.
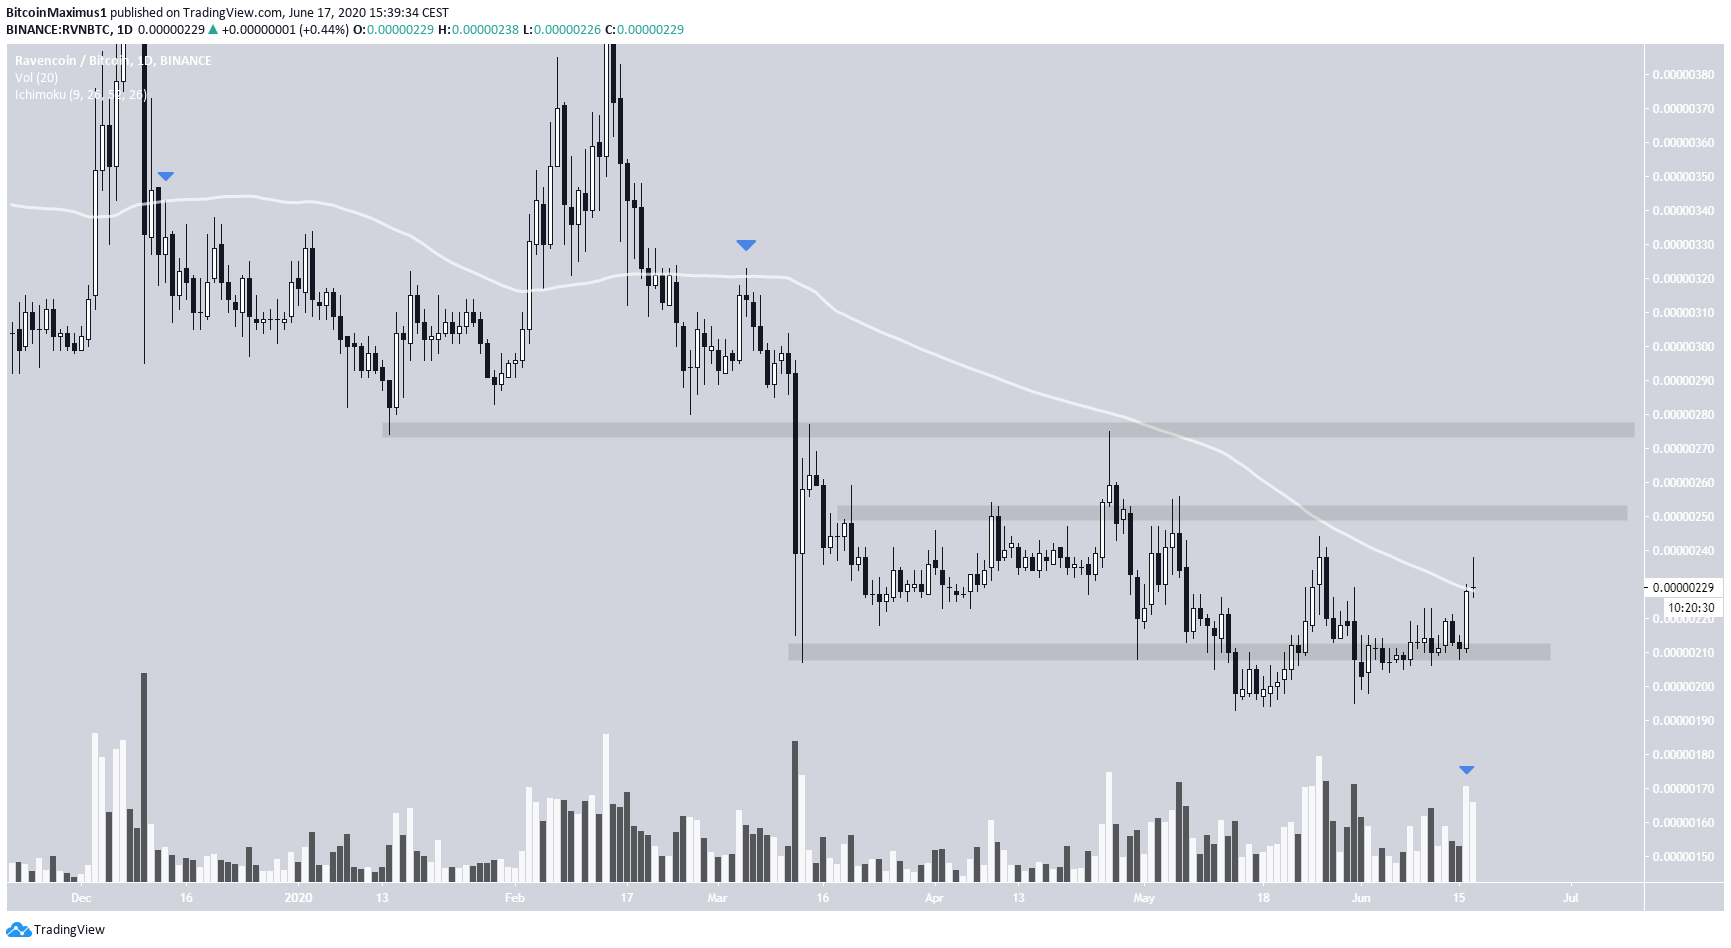
RVN 100-Day Moving Average
In the period beginning from December 2019, the 100-day MA has been an accurate determinant of Ravencoin’s trend. The trend has been bullish when the price has been above this MA, and bearish when trading below.
The price fell below this MA for the final time on Feb 10, validated it as resistance on March 8, and has been decreasing since.
The price reached a low of 207 satoshis on March 13 and has been trading near that level since, creating a support area near 210 satoshis. While the price fell below this area for a one-week period beginning on May 14, it has since reclaimed the area as support, a bullish sign that shows that the lower prices could not be sustained.
The price began an upward move with considerable volume on June 16 and is currently attempting to flip the 100-day MA as support. This would be an extremely bullish sign, suggesting that the price will move upwards and begin a bullish trend.
If it does, the closest resistance levels are found at 250 and 277 satoshis.
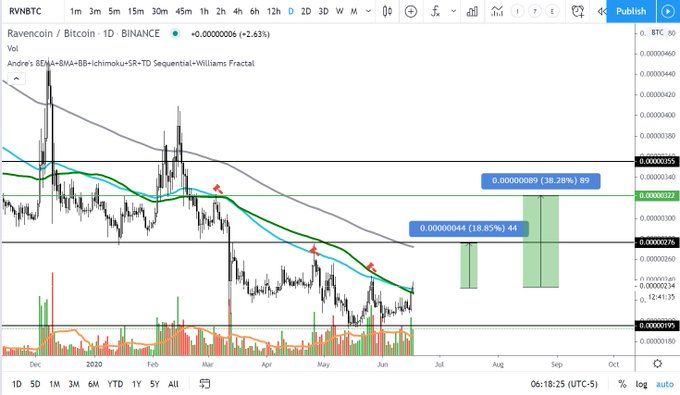
Well-known trader @devchart outlined a RVN price chart, giving two targets above the current price. The first being 276 sats, which aligns with our second resistance area, and 322 satoshis beyond that.
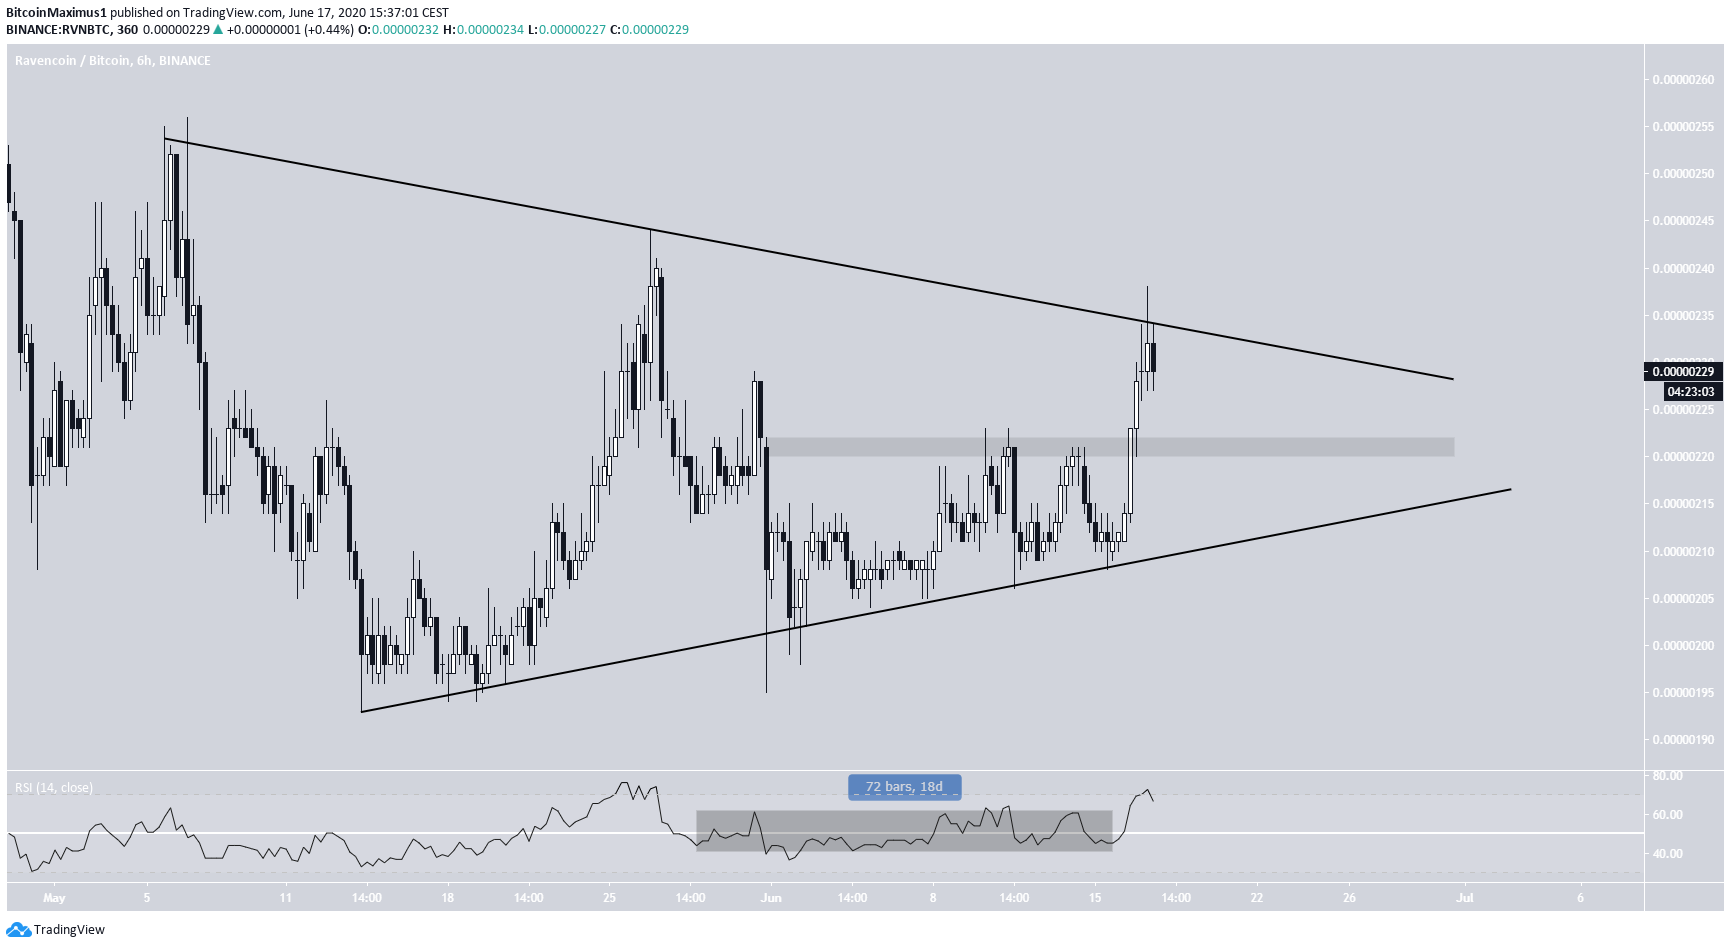
Symmetrical Triangle
In the shorter-term, the RVN price seems to be trading inside a symmetrical triangle, having just validated its resistance line. In addition, there is a minor support area at 210 satoshis which previously acted as a resistance.
The breakout above this level was combined with a decisive RSI breakout above 50, ending an 18-day consolidation period.
A breakout from this symmetrical triangle would likely indicate that the upward move discussed in the first section has begun.
To conclude, the RVN price has moved above an important moving average, indicating that it will likely begin an upward trend soon. The beginning of the bullish trend would be confirmed with a breakout from the current symmetrical triangle.


