
Quant (QNT) is in the process of creating a bullish structure and its first higher low since June 13. Despite the ongoing breakout, the bullish structure is not yet confirmed.
QNT Crypto Analysis: 287-Day Resistance Line Breakout | Coin of The Week – YouTube
QNT has been decreasing underneath a descending line since Sept, when it reached an all-time high price of $420. So far, it reached a low of $40 last month.
The price bounced afterward and broke out from the descending resistance line. At the time of the breakout, the line had been in place for 287 days. Additionally, the price reclaimed the $60 horizontal area, validating it as support in the process. If the upward movement continues, the next closest resistance area would be at $145.
However, the weekly RSI is below 50 in what is considered a sign of a bearish trend.

QNT enthusiast @Industry_q tweeted a weekly chart of QNT, stating that the next bull run will be glorious.

While the price has broken out from the long-term descending resistance line, there are no clear signs for such a long-term bullish reversal.
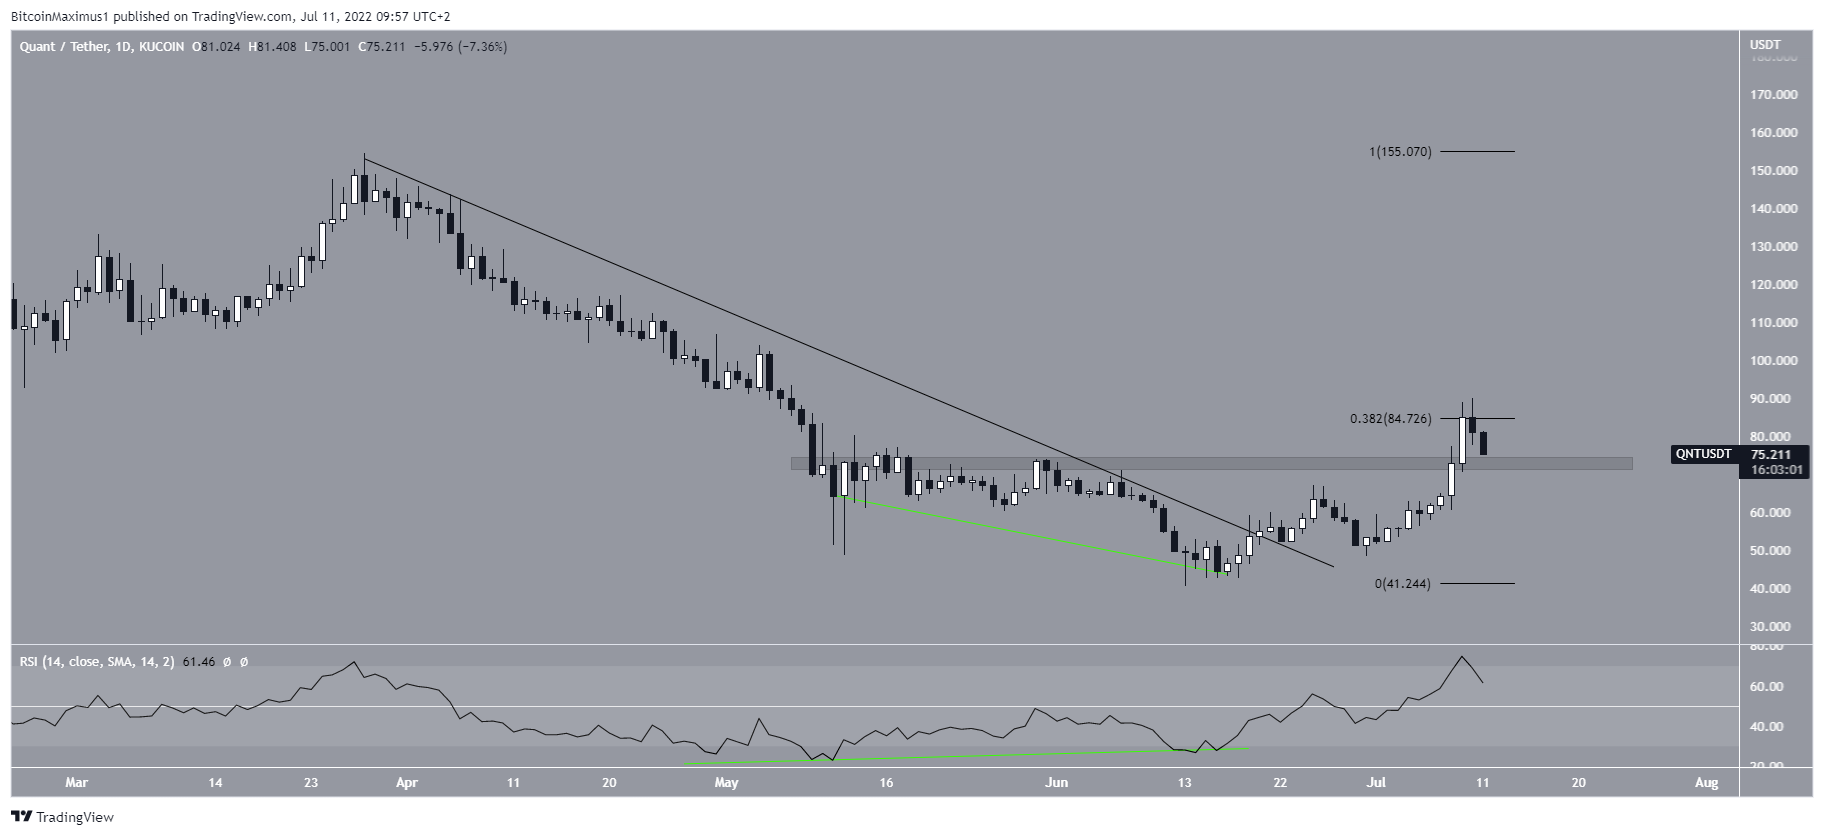
QNT breaks out
The daily chart provides a more bullish outlook, since the price has already broken out from a descending resistance line that had previously been in place since March 28.
The breakout was preceded by a significant bullish divergence in the daily RSI (green line). The RSI has now moved above 50 in what is considered a sign of a bullish trend.
While the price was rejected by the 0.382 Fib retracement resistance level at $85, it is currently attempting to hold on above the $73 horizontal support area. Doing so would lead to a higher low and possibly the continuation of the upward movement.
Future movement
Finally, the six-hour chart shows that QNT has broken out from an ascending parallel channel. This is usually a sign that a new upward movement has begun.
However, the price is still attempting to validate the resistance line of the channel as support. If it is successful in doing so, the upward movement can continue.
If however the price fall below the wave one high (red line) at $65, it would seem that the entire upward movement is corrective and new lows will follow.

For Be[in]Crypto’s latest bitcoin (BTC) analysis, click here.
Trusted
Disclaimer
In line with the Trust Project guidelines, this price analysis article is for informational purposes only and should not be considered financial or investment advice. BeInCrypto is committed to accurate, unbiased reporting, but market conditions are subject to change without notice. Always conduct your own research and consult with a professional before making any financial decisions. Please note that our Terms and Conditions, Privacy Policy, and Disclaimers have been updated.
