


The Quant (QNT) price has been decreasing since December 2 and broke down below a significant support line on December 7. A fractal-based on its early 2019 movement suggests that the price will make a bottom in January.
On Jan 8, BeInCrypto published an article outlining the top-five cryptocurrency projects to keep an eye on in 2020:
- QNT
- OCEAN
- XTZ
- DAG
- FCT
Here Are the Five Blockchain Projects to Keep an Eye on in 2020.$QNT $OCEAN $XTZ $DAG $FCT@quant_network @oceanprotocol @tezos @Conste11ation @factomhttps://t.co/TNRaVCHgcq
— BeInCrypto (@beincrypto) January 8, 2020
In this article, the first in a five-part series, we will take a closer look at Quant (QNT), and go over a few possible scenarios for its future movement.
Long-Term Trend Lines
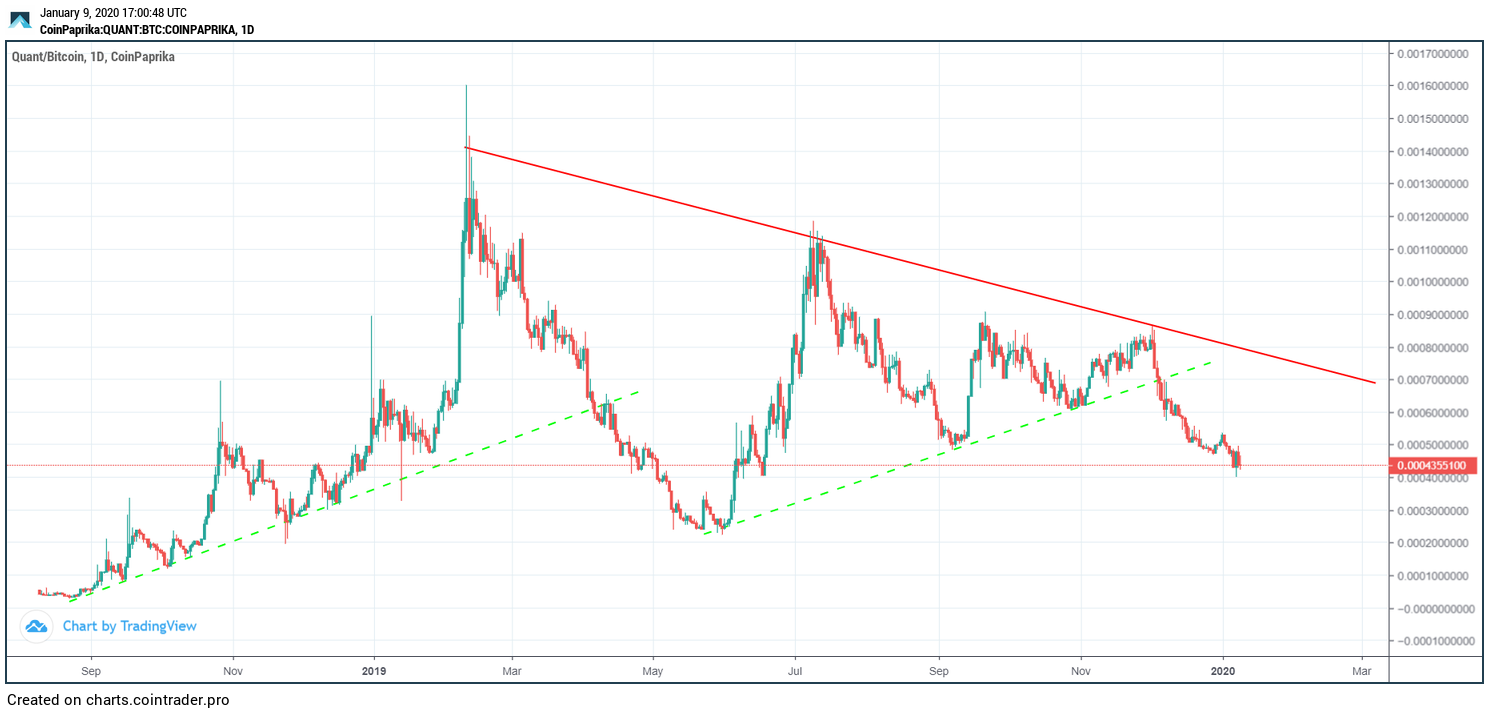
Since September 2018, the QNT price has followed two ascending support lines at different points in time. Both times, the price broke down from these lines.
The first one led to an all-time high of ₿0.0016 on February 10, 2019. Since then, the price has been following a descending resistance line that is still in place and has been validated three times.
The price created another ascending support line on May 22, out of which QNT broke down on December 4. The price has been decreasing since.
Technical Indicators
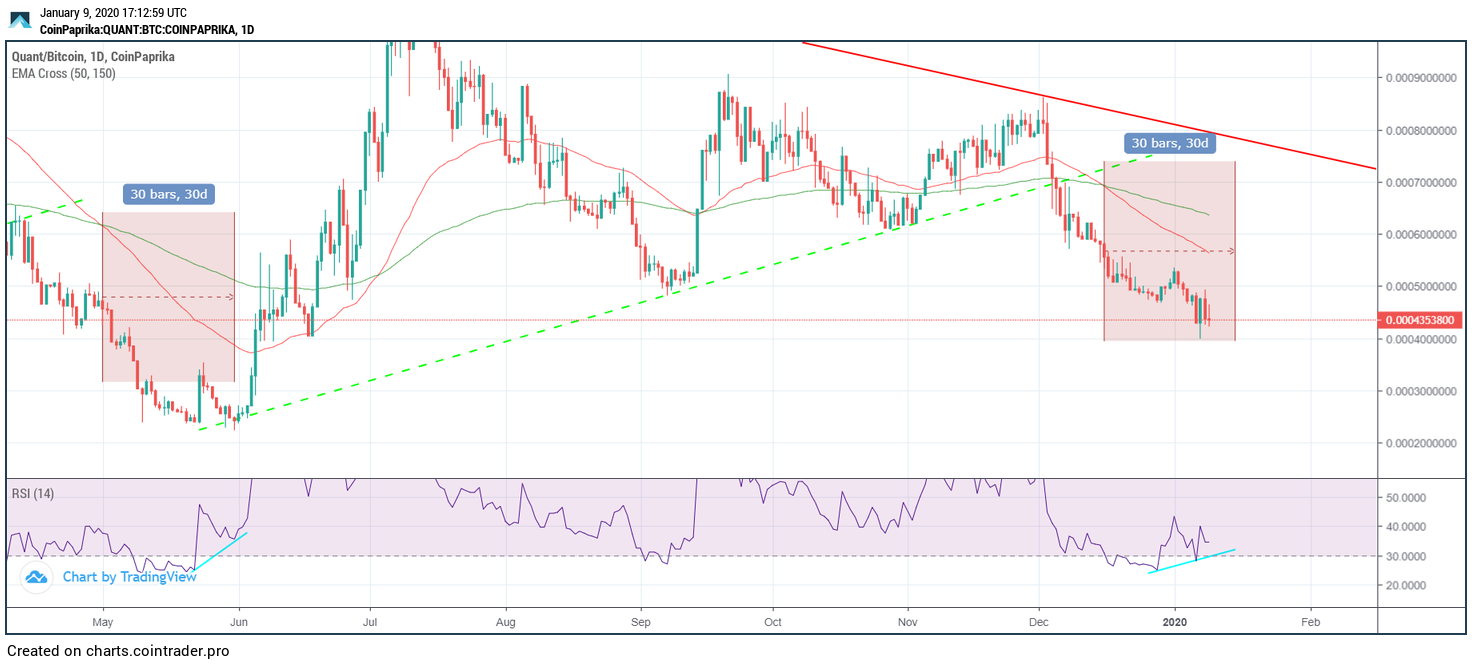
After the price broke down from the first ascending support line, a bearish cross between the 50- and 150-day moving averages (MA) followed afterward. After 30 days, the price made the aforementioned low on May 22.
Similarly, a bearish cross between the same MAs transpired on December 16. Twenty-four days have passed since the bearish cross. If the price follows the same pattern, it will initiate a reversal on January 15, 30 days after the bearish cross.
In addition, the RSI movement supports the similarities between these two movements. The RSI was below 25 in May 2019, when the price began the upward move. Shortly after, the RSI generated bullish divergence, and the upward movement began.
The RSI dropped below 25 in December 2019. Currently, it has generated a slight bullish divergence, suggesting that the bottom might be near.
QNT Possible Bottom
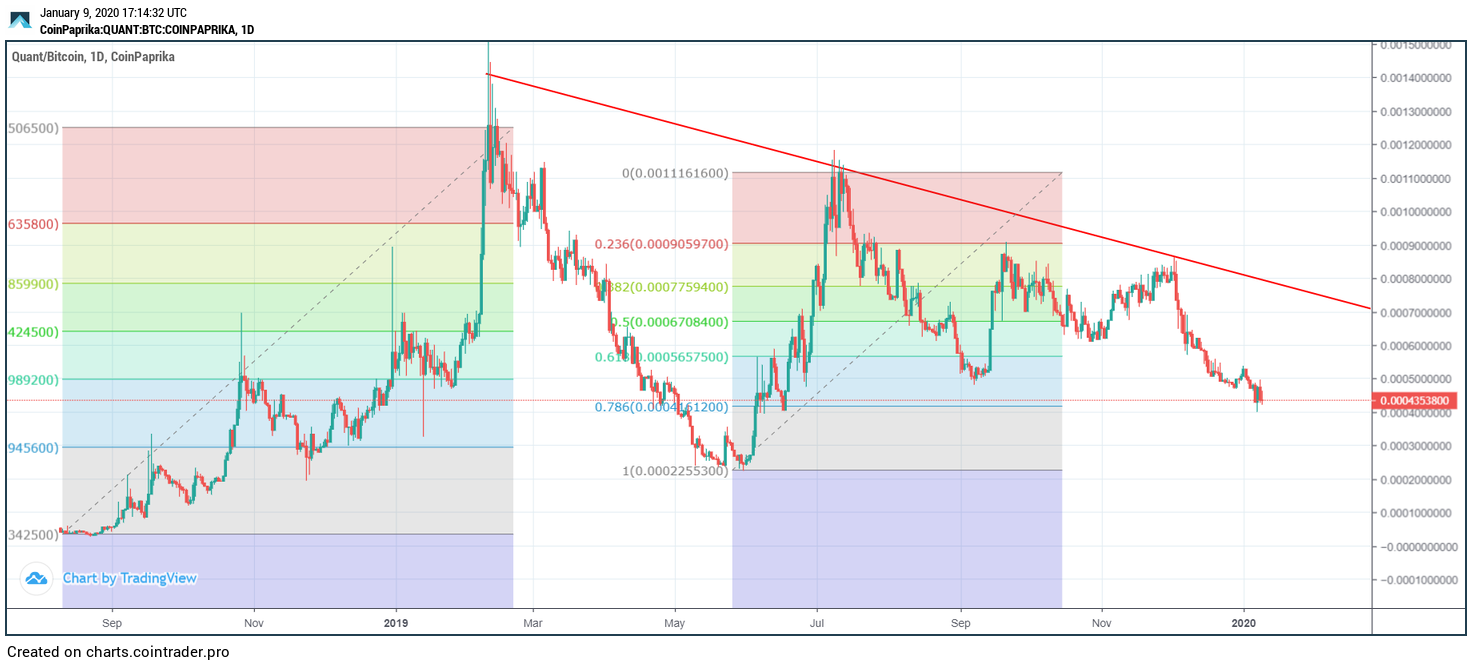
Furthermore, measuring from the beginning of the upward move, the bottom was reached slightly below the 0.786 fib level. Currently, the price is slightly below this level, further increasing the chance that the price will soon initiate a reversal.
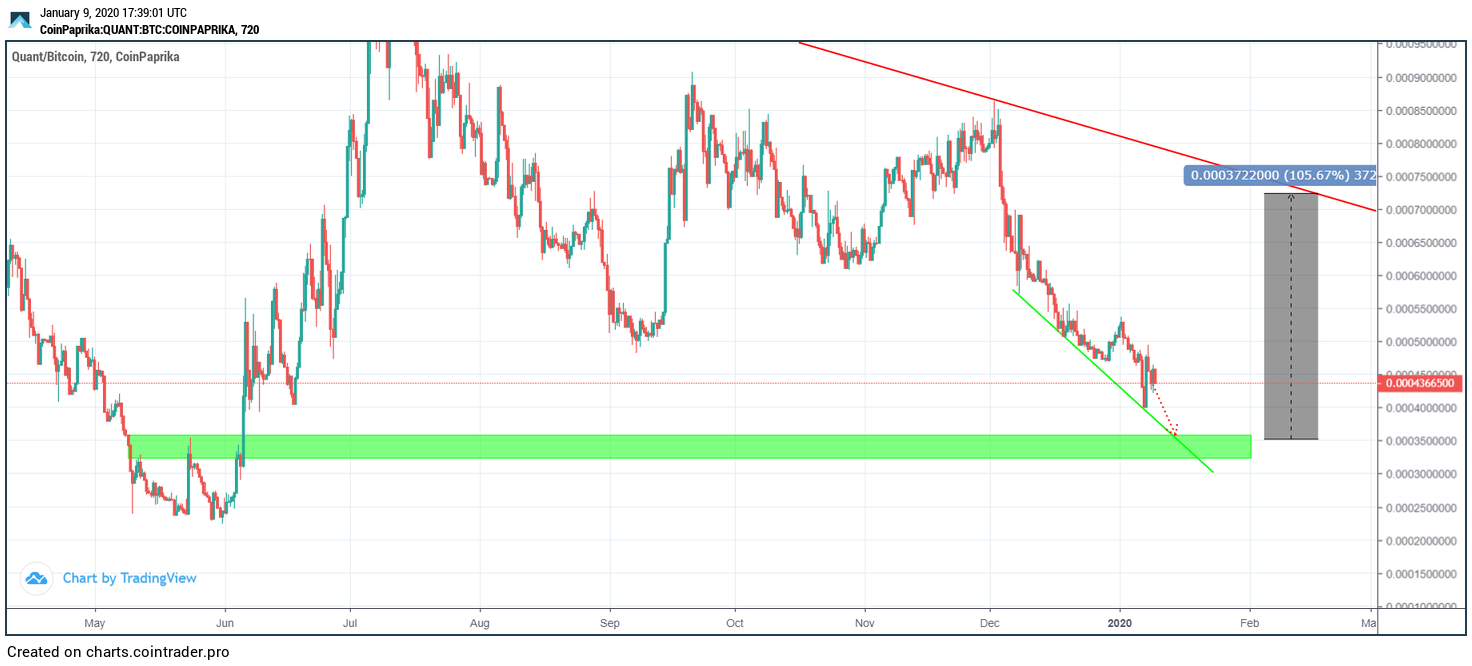
The QNT price has been following a descending support line since December 7. If the price continues following it, it could make a low near 35,000 satoshis on January 15, the date in which the bottom is predicted from the previous pattern.
From this level, an upward movement towards the resistance line would represent an increase of slightly more than 100%, depending on when the price reaches it. At the current time, we cannot predict whether the price will be successful in moving above this descending resistance line or not.
To conclude, the QNT price could be very close to reaching a bottom. If the price follows the pattern laid out by the movement in early 2019 and supported by technical indicators, it could make a bottom near 35,000 next week. Afterward, an upward move of more than 100% could follow.


