


Polkadot (DOT) faces bearish price trends with nearly a 50% decline from the local high of $12.
Analyzing Key Indicators Such as Total Open Interest and Social Dominance.
Technical Analysis of Polkadot
The price of DOT has once again rejected the Ichimoku Cloud and is currently testing the Ichimoku Baseline in red, which aligns with the lower boundary of the Ichimoku Cloud. The trading price stands at $6.45.
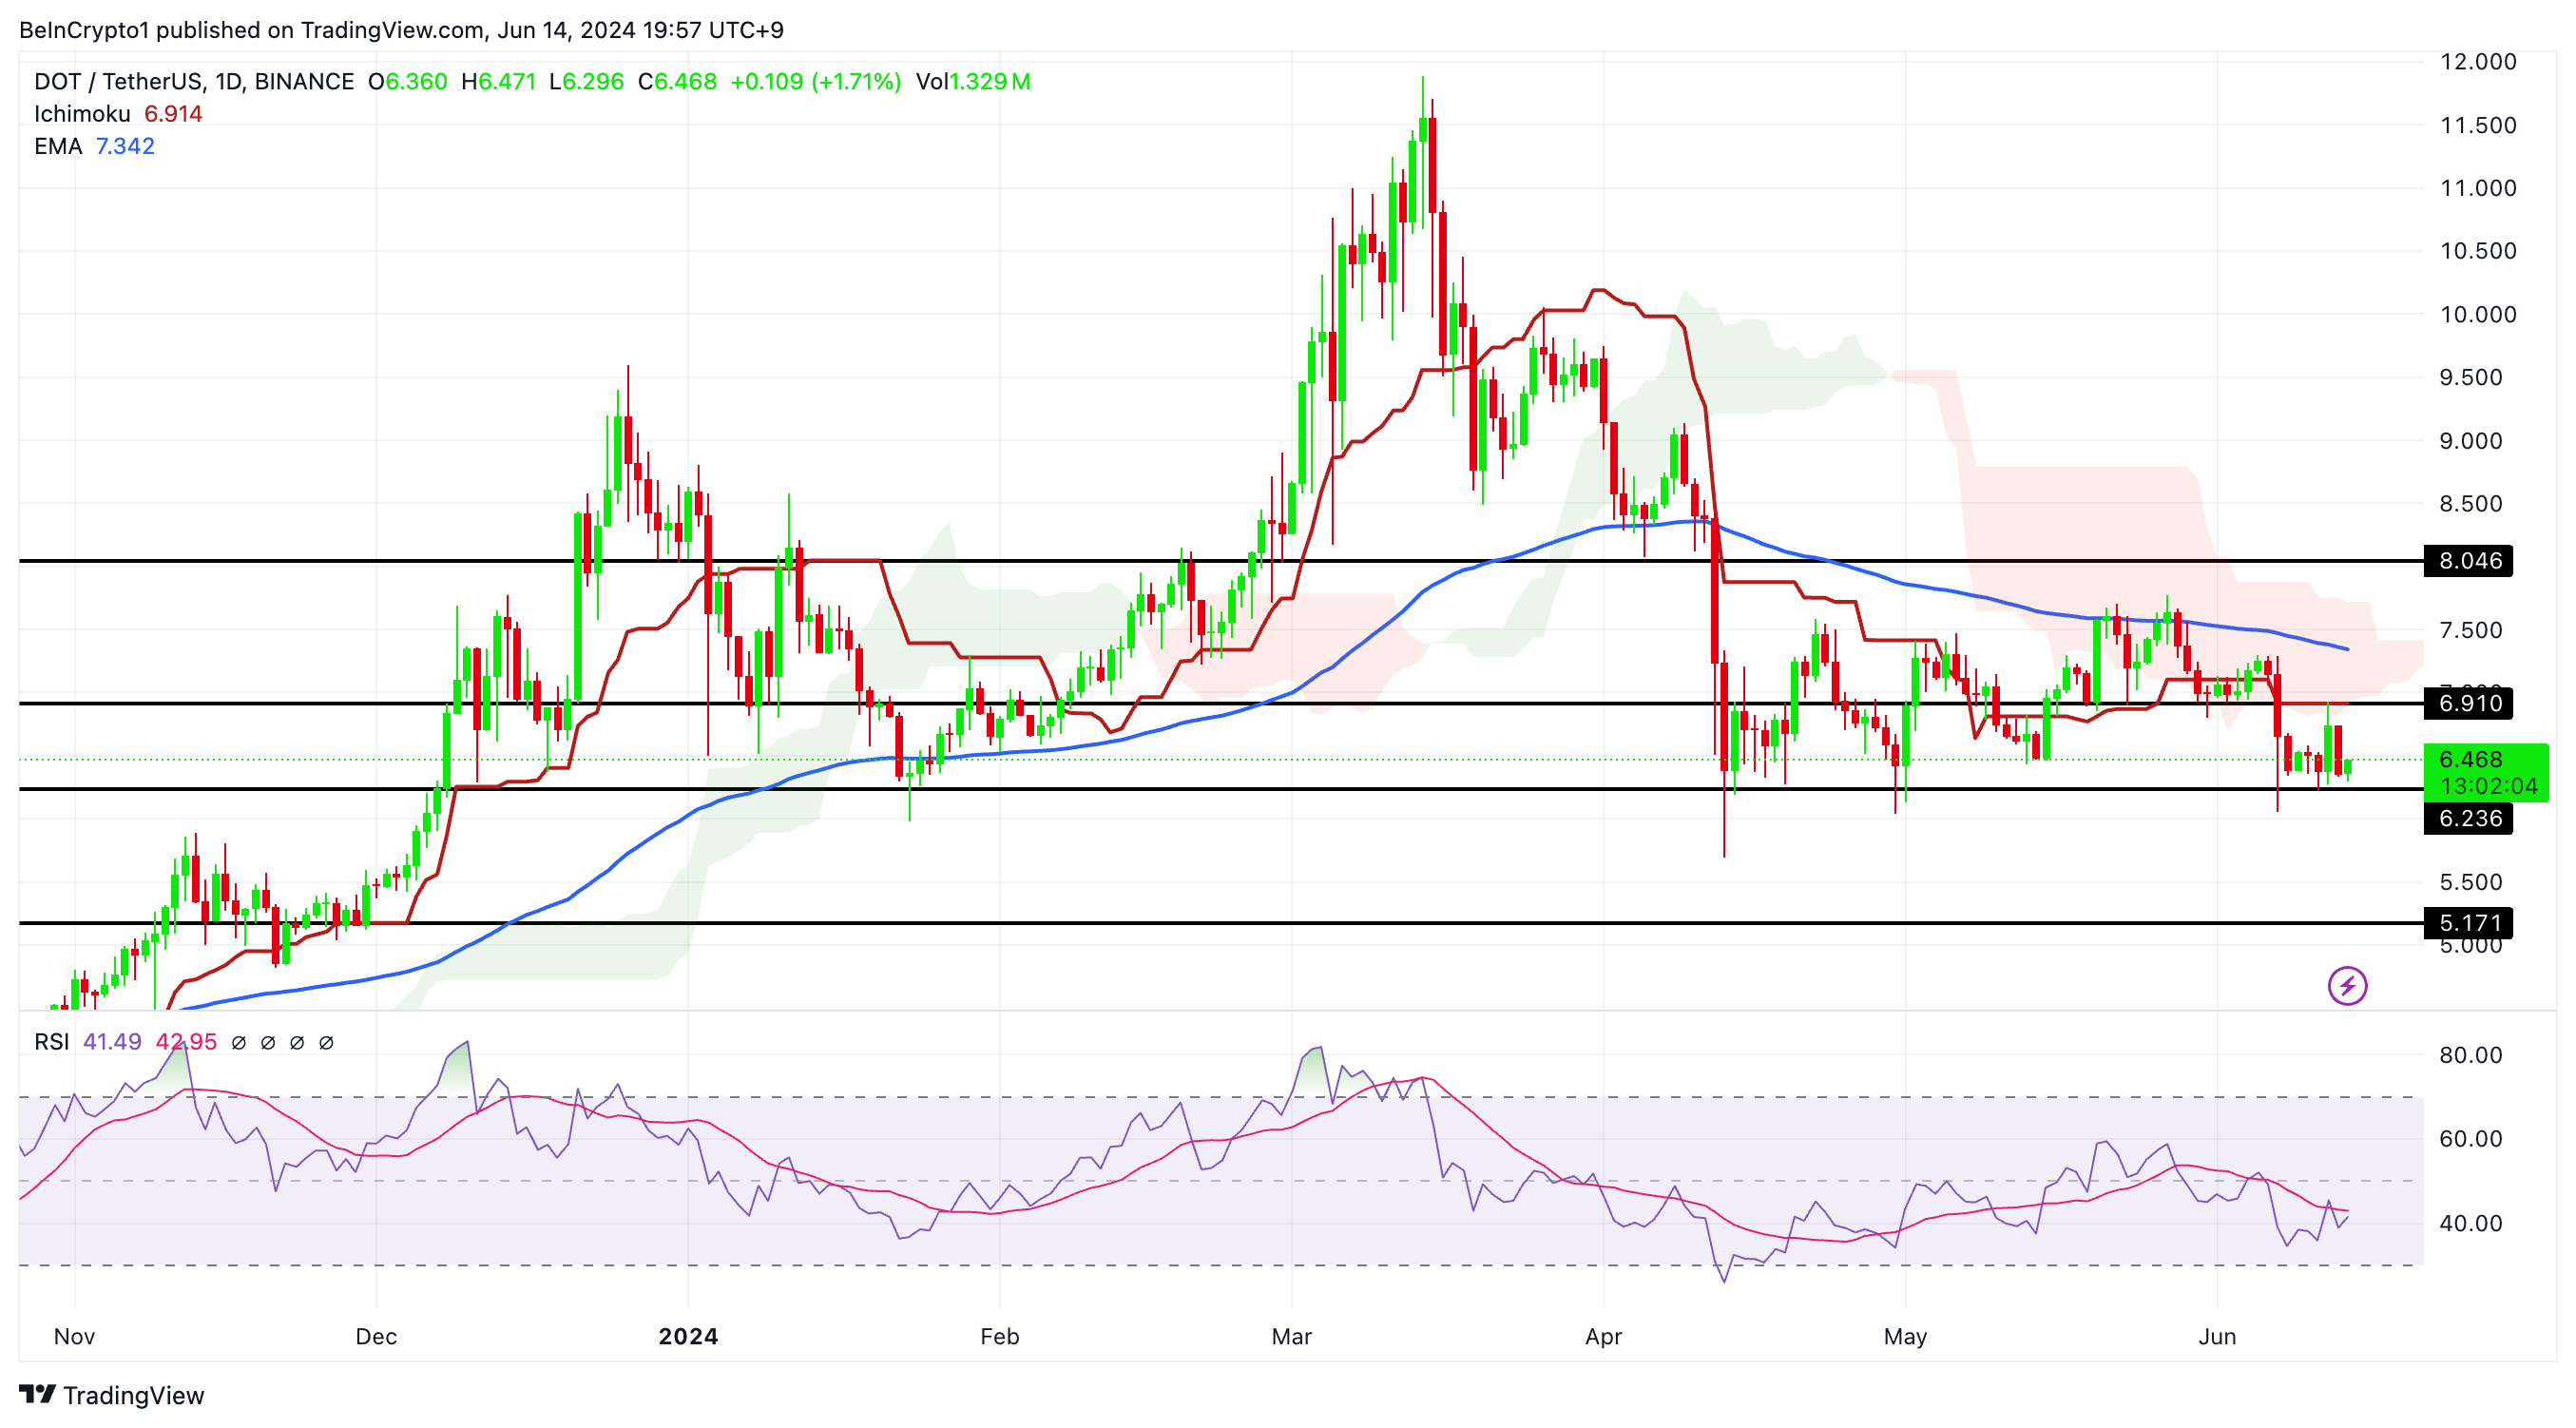
The RSI trend indicates a downward movement, with the 14-day simple moving average (SMA) of the RSI reflecting this bearish momentum. Recently, the RSI has been trending towards the oversold territory, nearing the critical level of 30. This downward trend points to increasing selling pressure and potential further declines in price if the RSI falls below 30.
The 4-hour chart highlights crucial resistance and support zones. The price recently fell below the 4-hour Ichimoku Cloud, indicating a bearish trend in this timeframe. The $6.23 price level has emerged as significant support.
Read More: What Is Polkadot (DOT)?
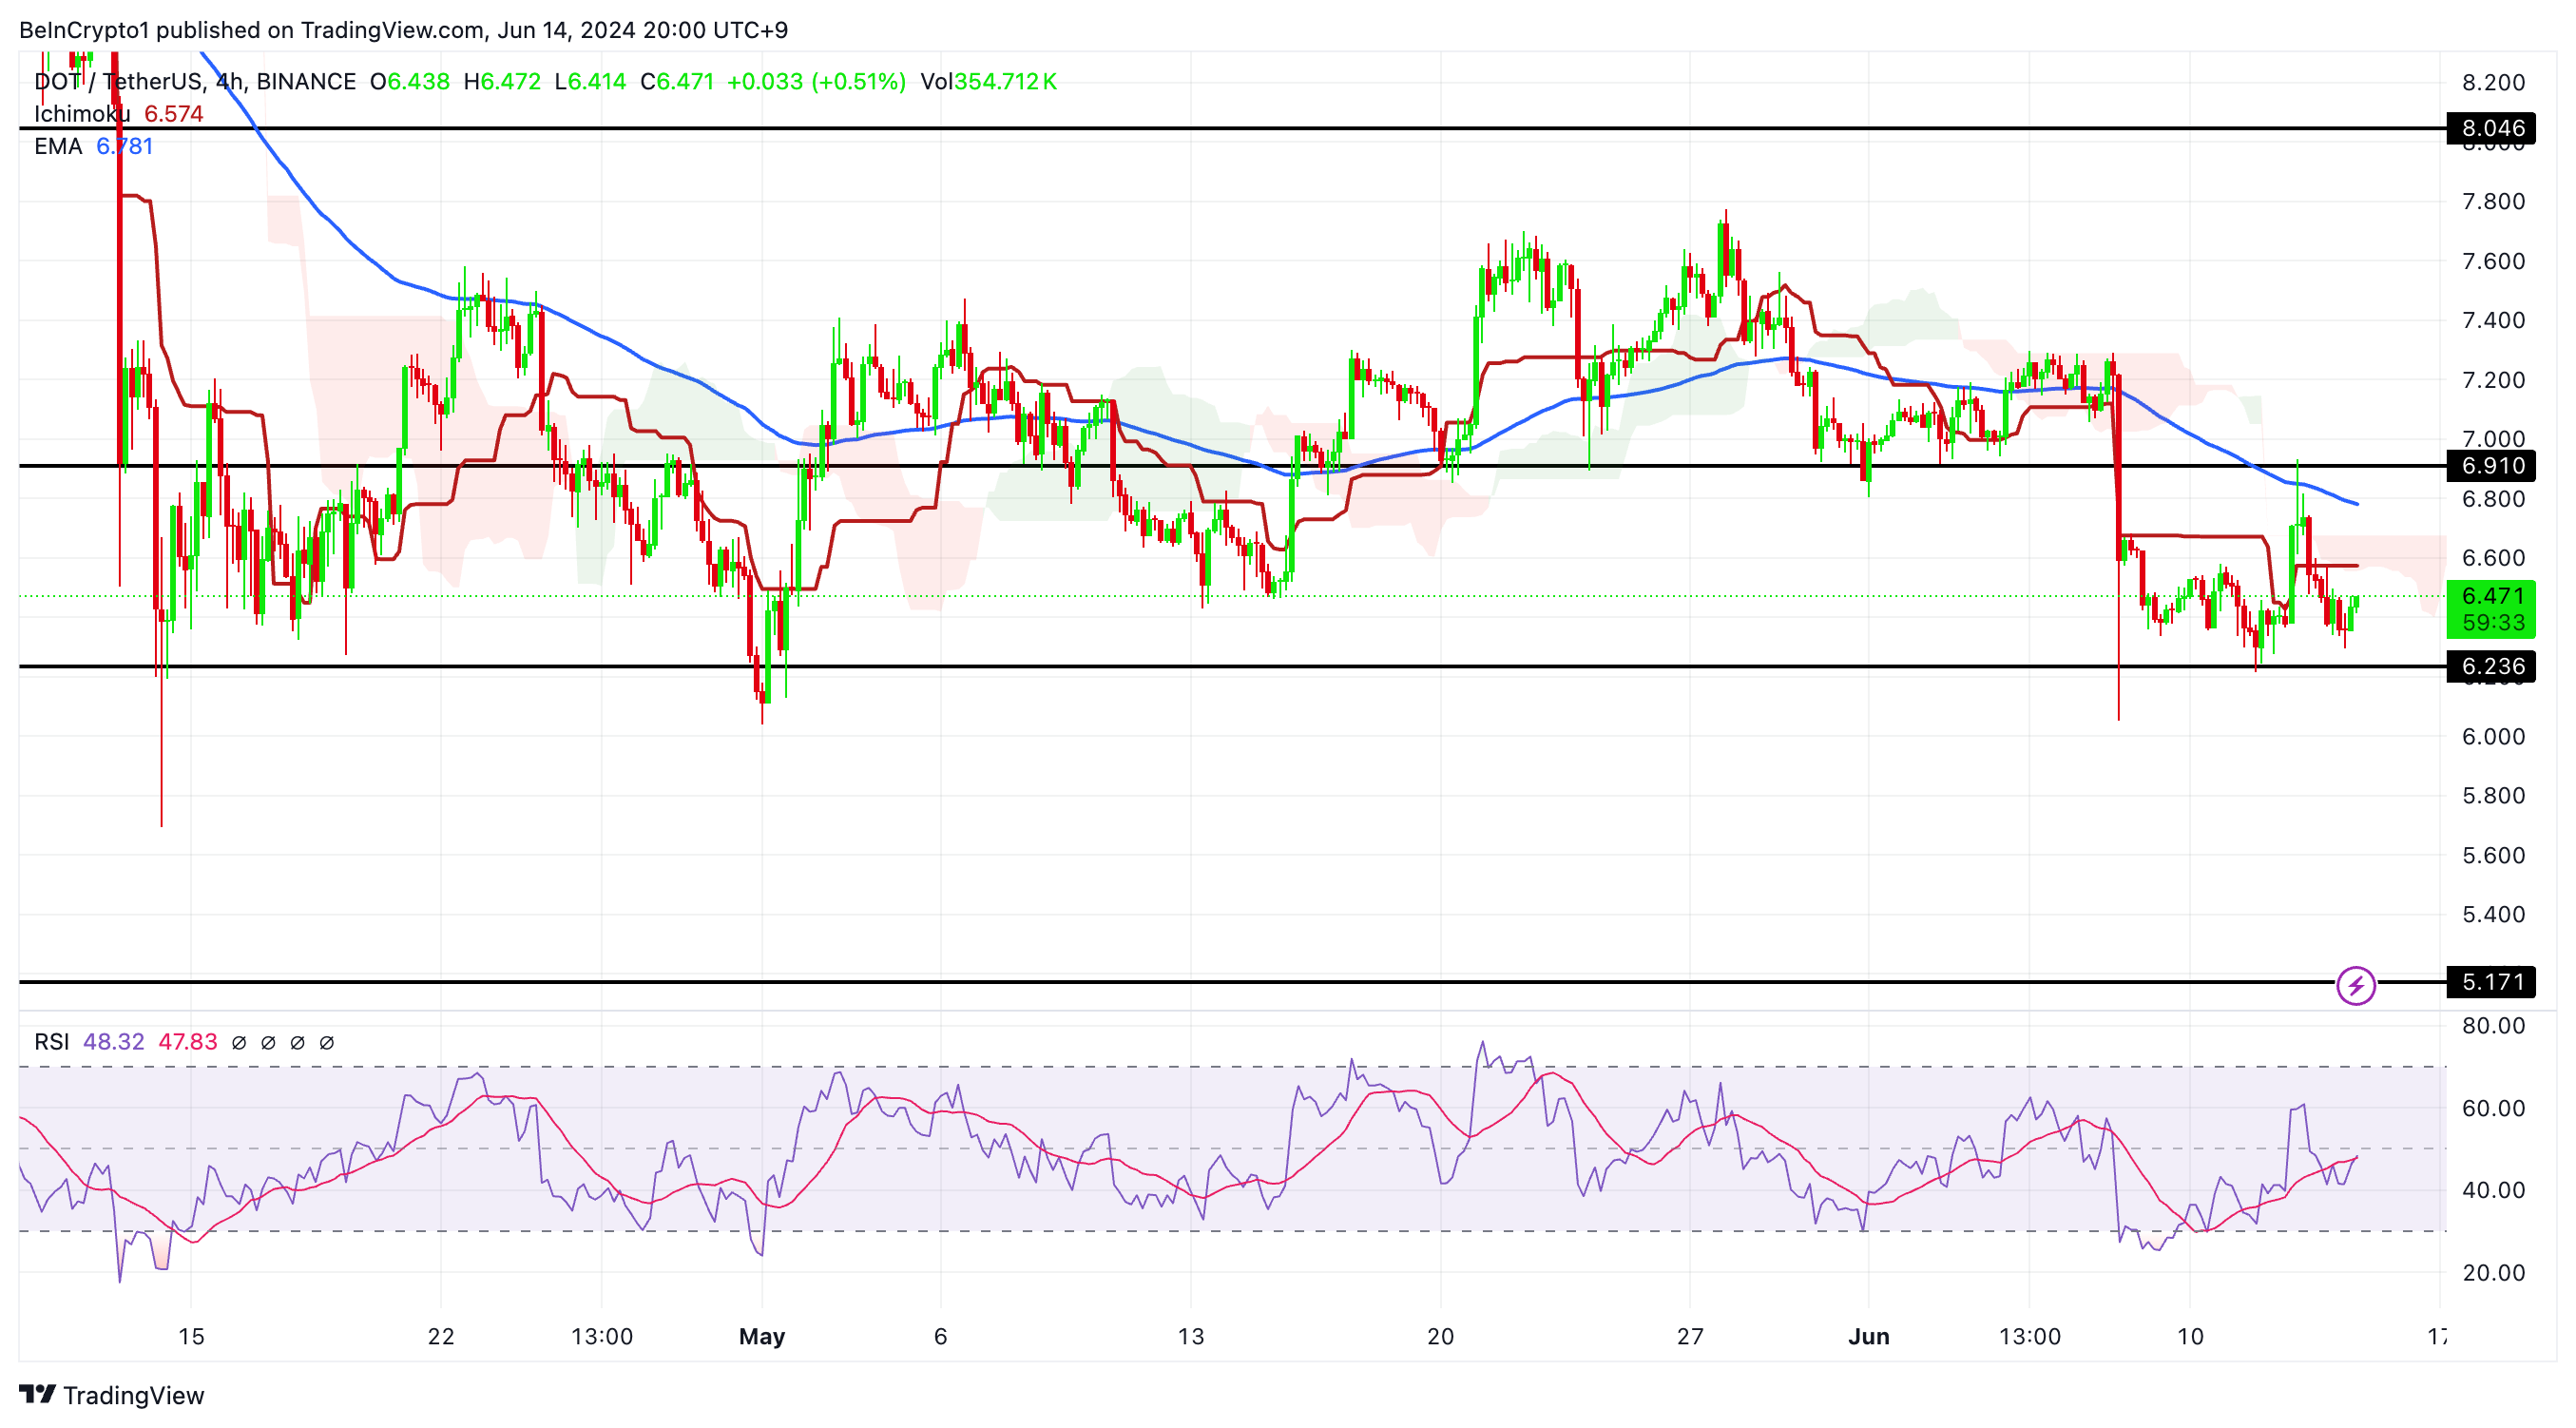
If DOT drops below this support level, it could signal a continuation of the bearish trend. Conversely, if the price climbs above the Ichimoku Cloud and the red baseline of the 4-hour Ichimoku Cloud, it could suggest a trend reversal and a potential shift to a bullish outlook.
DOT Total Open Interest: Understanding the Bearish Trends
From June 1 to June 13, the total open interest in USD for DOT across all exchanges showed a notable decline. Open interest was relatively higher on June 1 but began a downward trend, indicating reduced trading activity and interest.
By June 13, open interest had decreased significantly, suggesting potential market uncertainty or a reduction in speculative positions. This trend aligns with the broader price action observed during the same period, indicating a bearish sentiment among traders.
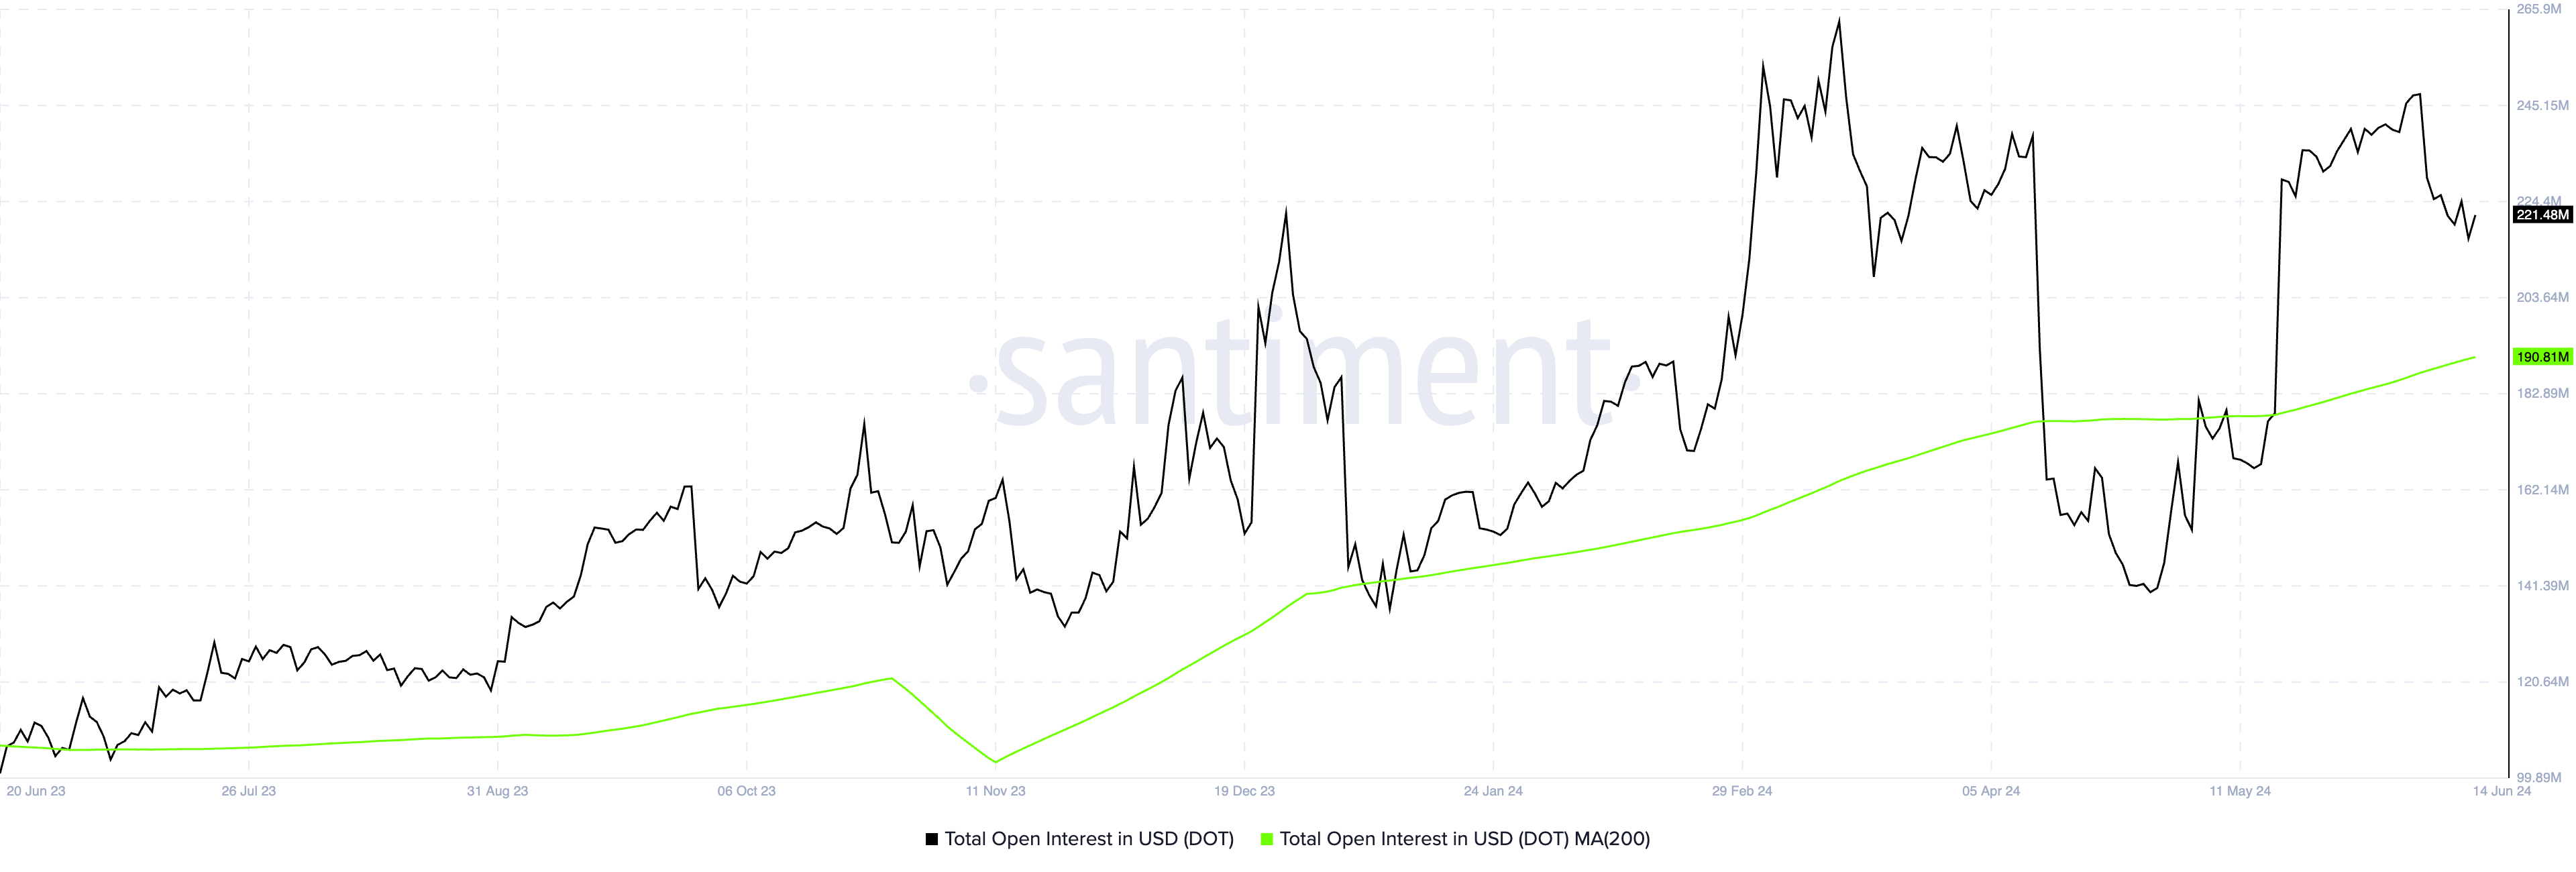
The correlation between Polkadot’s price and total open interest in USD from May 14 to June 14, 2024, is approximately 0.44. This positive correlation suggests a relationship between these two variables. Indicating that as open interest increases, Polkadot’s price tends to rise as well.
This relationship highlights that growing market participation and investment interest in Polkadot often accompanies an upward movement in its price. However, the correlation is not strong, implying that other factors significantly influence Polkadot’s price movements.
Social Media Dominance of DOT
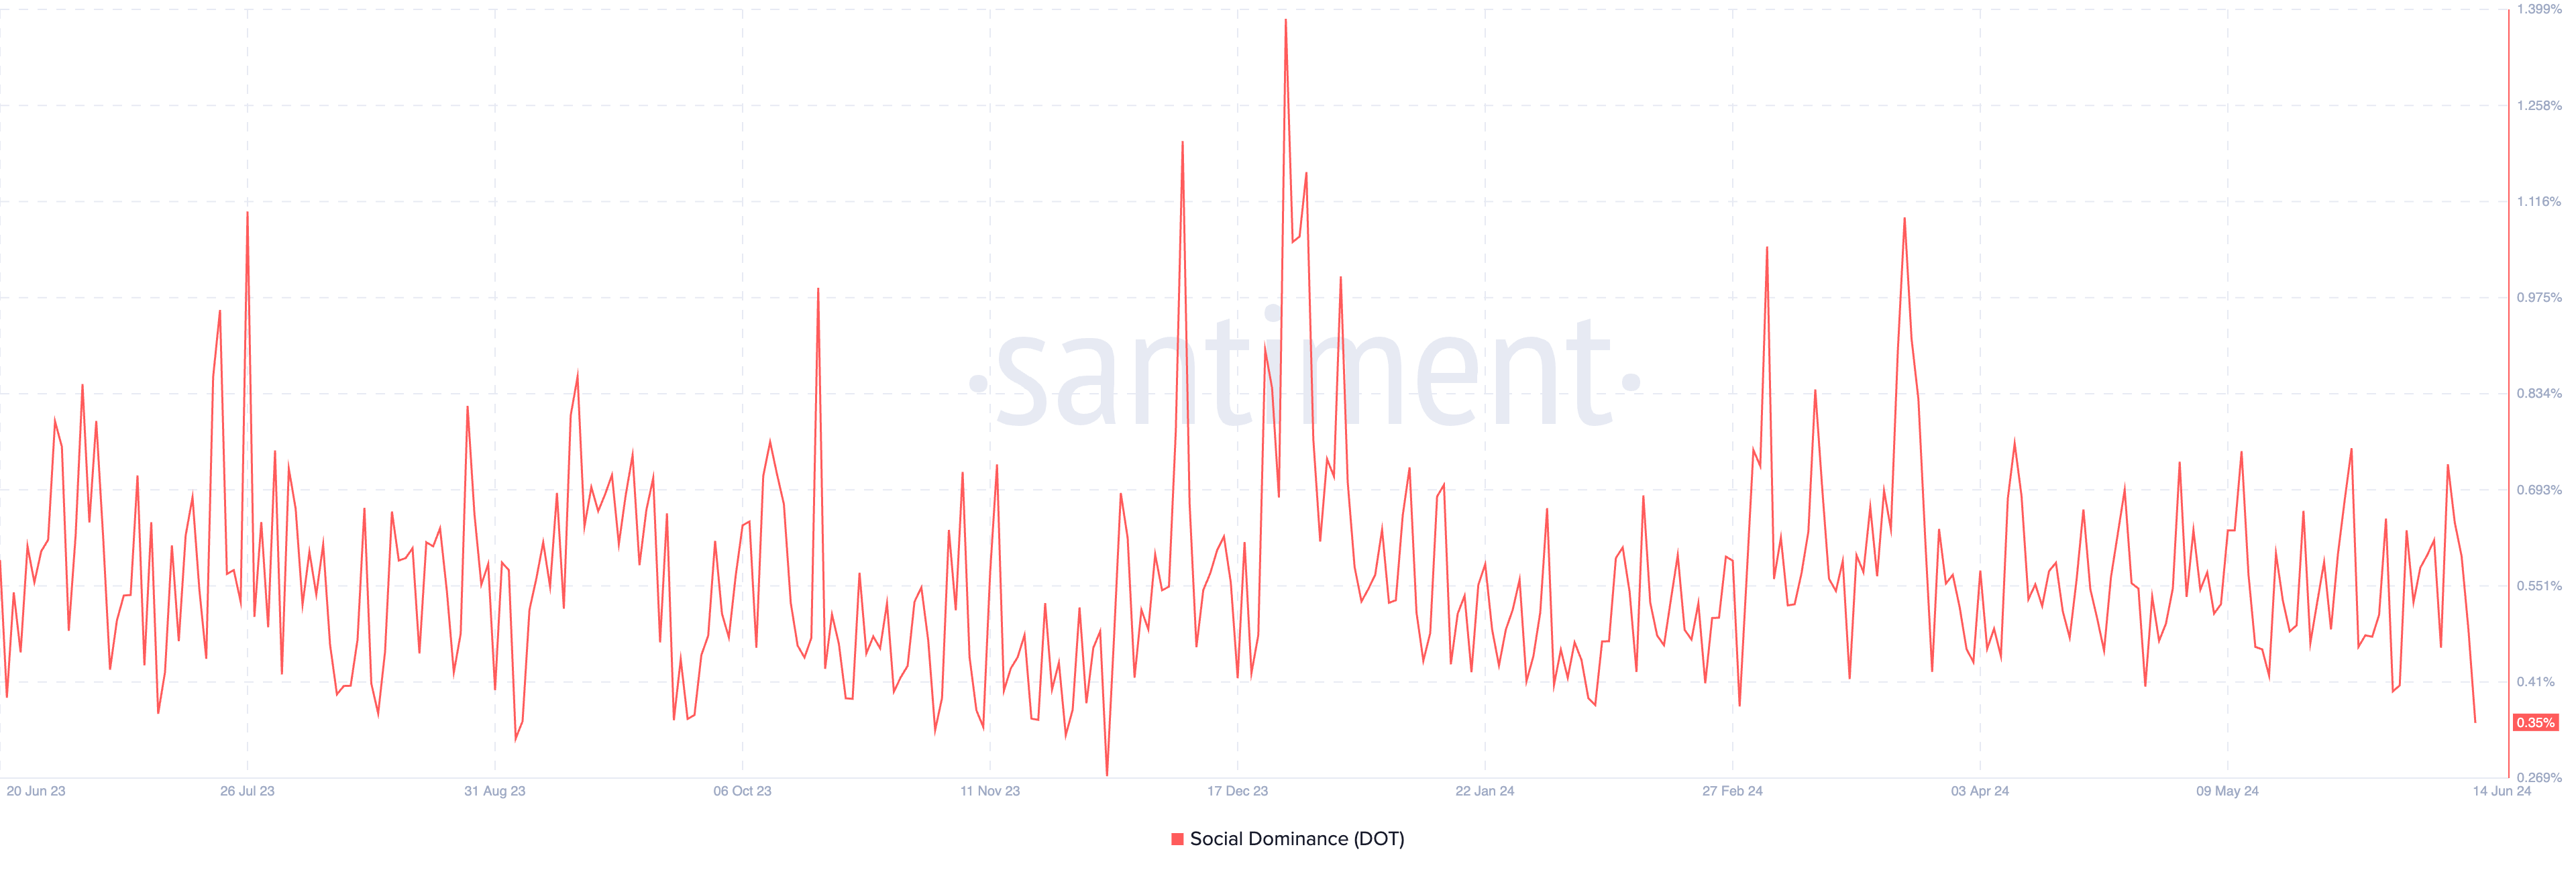
Social dominance peaked at 0.7537 on May 27, a 64.56% increase from 0.4579 on May 14. This rise indicates heightened community interest and engagement. Social interest sharply declined by 53.92% to 0.3474 by June 13.
This aligns with the price drop and suggests waning social media activity or interest in DOT.
Read More: 5 Best Polkadot (DOT) Wallets To Consider In 2024
Polkadot is approaching a critical support level at $6.23. If the price breaks below this level, it could signal a continuation of the bearish trend. Conversely, if the price reverts and moves above the 4-hour Ichimoku Cloud, it might indicate a potential shift in outlook.
The social dominance clearly highlights the current bearish trend that Polkadot is facing, reflecting a noticeable decline in interest from social media users regarding cryptocurrency.
Technical analysis highlights that a confirmed bullish trend will require the price to enter the daily Ichimoku Cloud and break above the daily Ichimoku Baseline.


