


The Polkadot (DOT) price has bounced at an important support level and is aiming to break above its previous highs.
Failure to break out above the current resistance area could once again trigger a rapid drop towards the $3 level.
Polkadot Trading Range
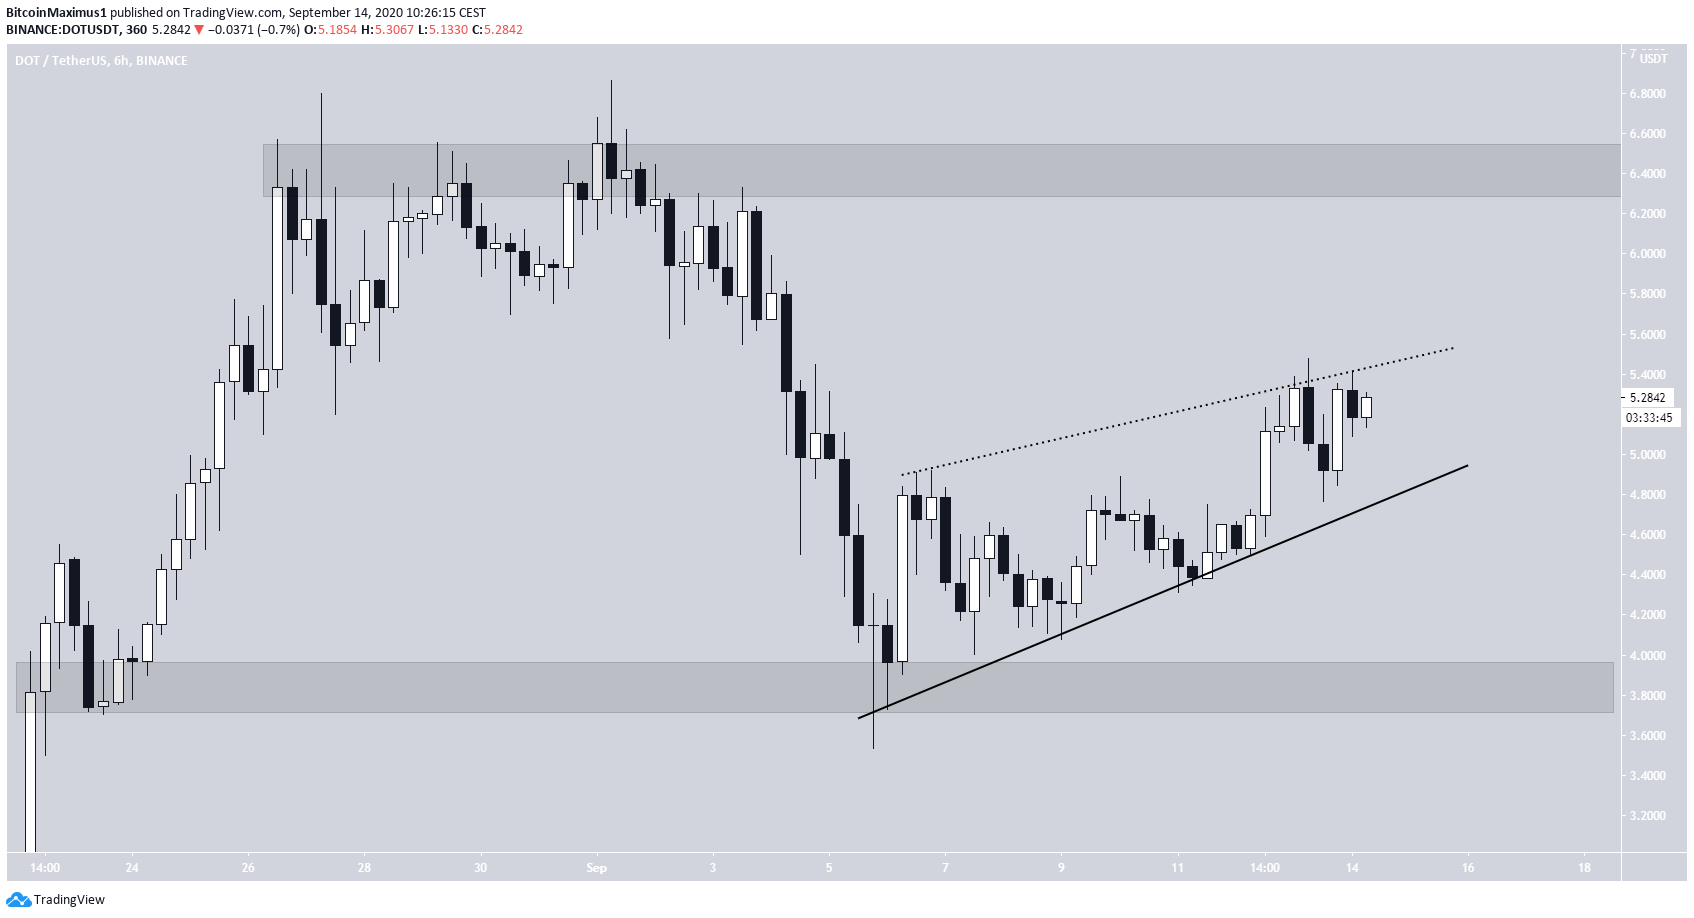
The DOT price has been decreasing since it reached a high of $6.86 on Sept 1. The decrease culminated with a low of $3.53 on Sept 5, and the price has been moving upwards since.
The bounce-back has taken the shape of an ascending wedge, which is normally considered a bearish reversal pattern. However, the resistance line of the wedge has not been validated enough times in order to be confirmed.
The closest support and resistance levels are found at $3.80 and $6.40, respectively.
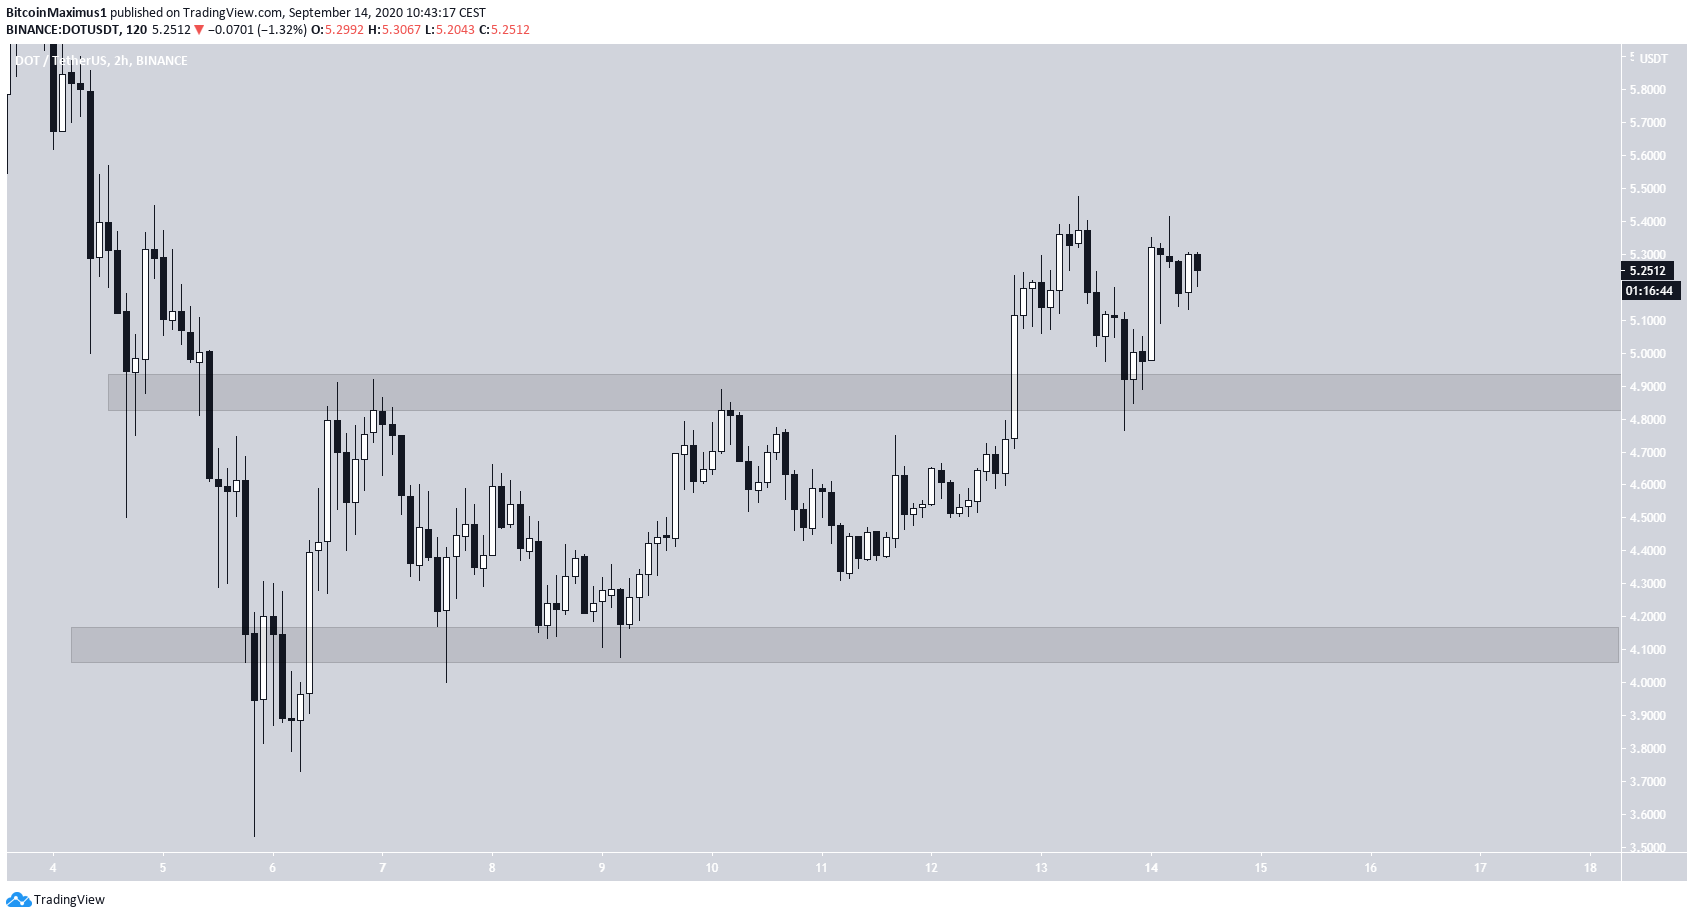
The shorter-term chart reveals another shorter-term range between $4.10 and $4.90. At the time of press, the price had broken out above the $4.90 area and validated it as support.
As long as DOT does not fall back inside this range, the most likely possibility would be an upward continuation.
Possible Increase
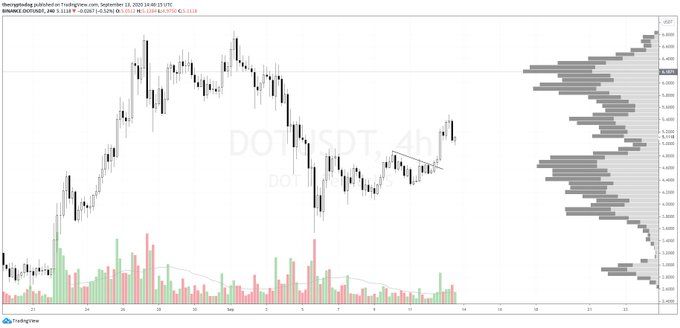
Cryptocurrency trader @TheCryptoDog outlined a DOT chart stating that the price will increase towards its previous $6.80 highs.
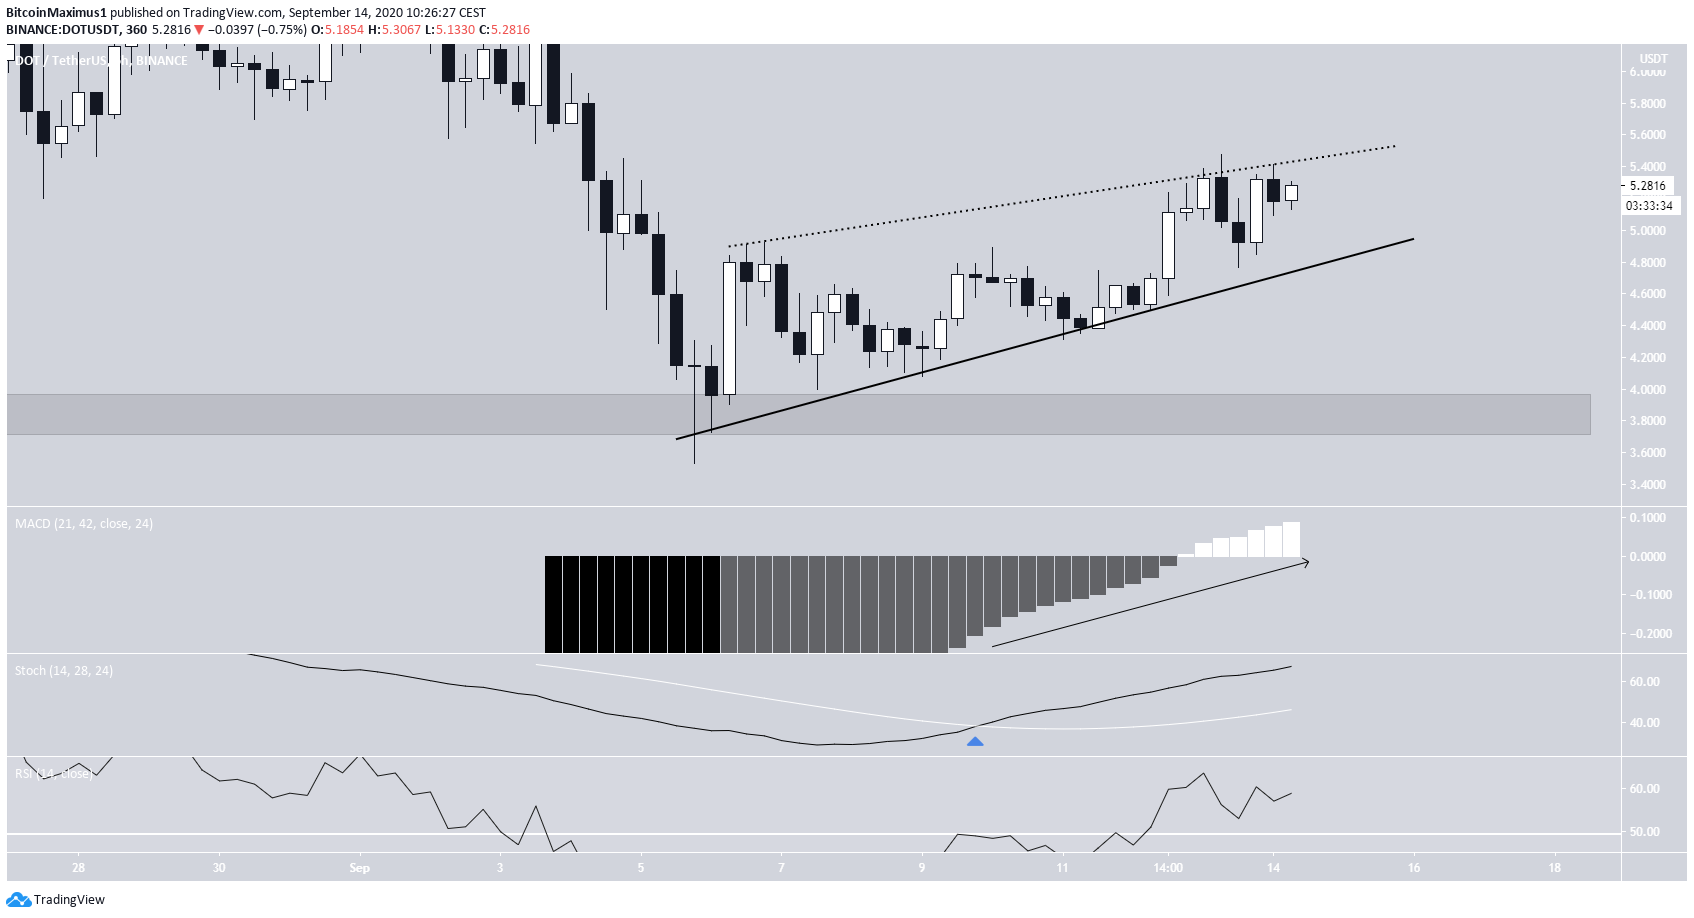
Technical indicators are bullish. The MACD has been increasing and has crossed into positive territory. The Stochastic RSI has made a bullish cross and is increasing alongside the RSI.
Therefore, as long as the price does not break down from this wedge or falls below the $4.90 minor support level, DOT is expected to increase towards the $6.40-$6.80 range.
Wave Count
Beginning on Aug 18, the price has likely completed a bullish five-wave impulsive formation (in black below), which ended with a high of $6.86 on Sept 1.
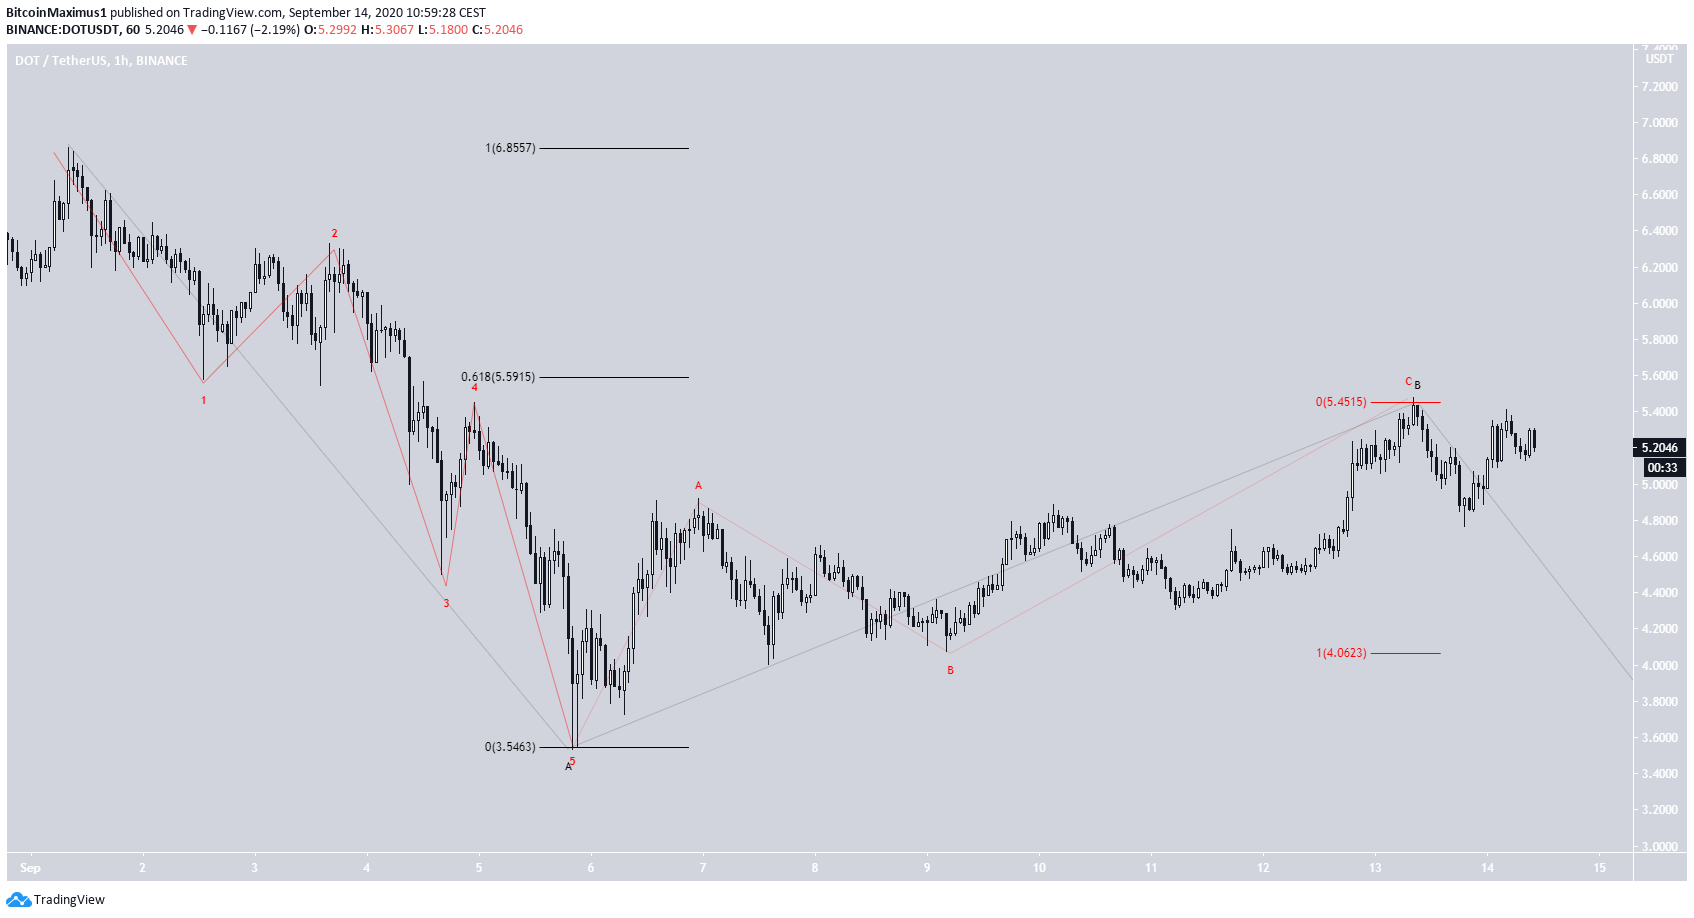
Since then, the price has either completed an A-B-C correction (red) at the 0.618 Fib level of the entire downward move or is still in the B wave of an A-B-C correction (black).
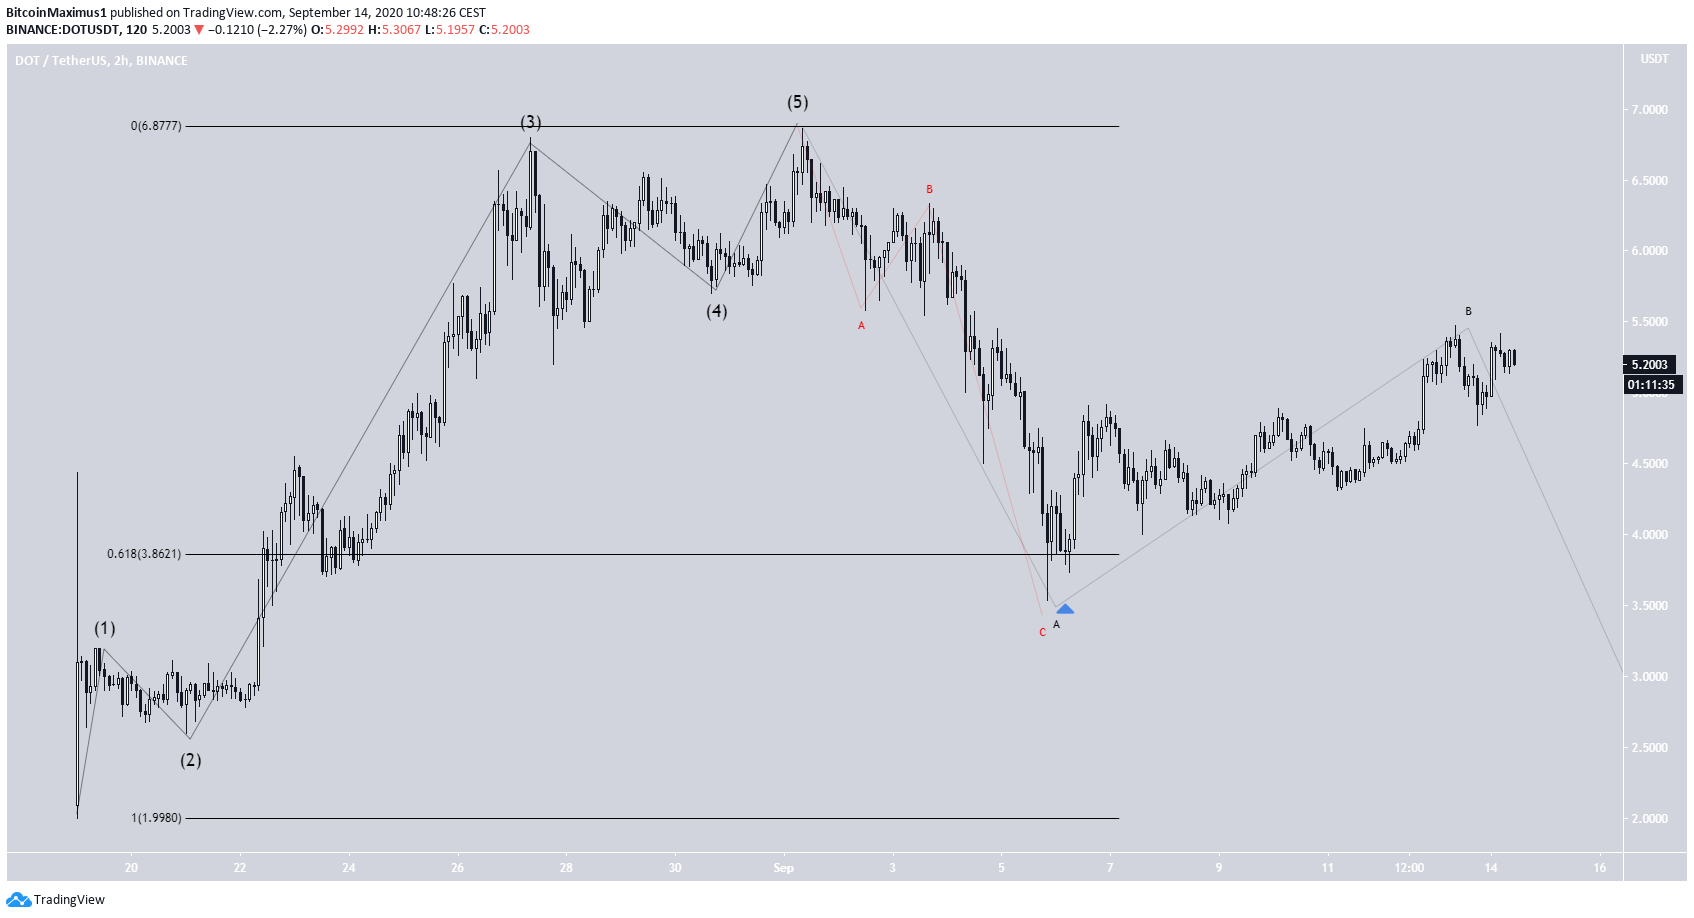
A closer look supports the second possibility, in which the price has just completed the B wave of an A-B-C correction. If so, the C wave could take the price towards the $3.40-$2.15 range.
The main reason to support this theory is that the increase since the Sept 5 low looks corrective rather than impulsive. The fact that the A and C sub-waves (red) have a 1:1 ratio suggests that it is possible that the price has reached its high.
A breakout above the 0.618 Fib of the entire decrease at $5.59 would likely invalidate this scenario.
To conclude, the future direction for the DOT movement is not clear due to conflicting signals from technical indicators and wave counts. A breakout above and validation as support of the $5.60 area would suggest that the bullish possibility is more likely, while a decrease below $4.90 would support a bearish scenario.
For BeInCrypto’s latest Bitcoin (BTC) analysis, click here!


