


Pi Network has flipped the $0.47 level from support to resistance, signaling growing selling pressure and a weakening bullish effort.
The token remains under heavy bearish pressure, with seasoned investors losing confidence in any near-term price recovery.
Bearish Clouds Thicken Over PI
Readings from the PI/USD one-day chart reveal that since the altcoin closed at $0.46 on July 4, it has failed to initiate a break above this price level. This former support floor has now flipped into a resistance zone that PI appears to be struggling to breach as demand falters.
PI’s extended decline has pushed its price significantly below the Leading Spans A and B of its Ichimoku Cloud, reflecting the bearish sentiment among its holders. These lines now form dynamic resistance levels above PI’s price at $0.51 and $0.63, respectively.
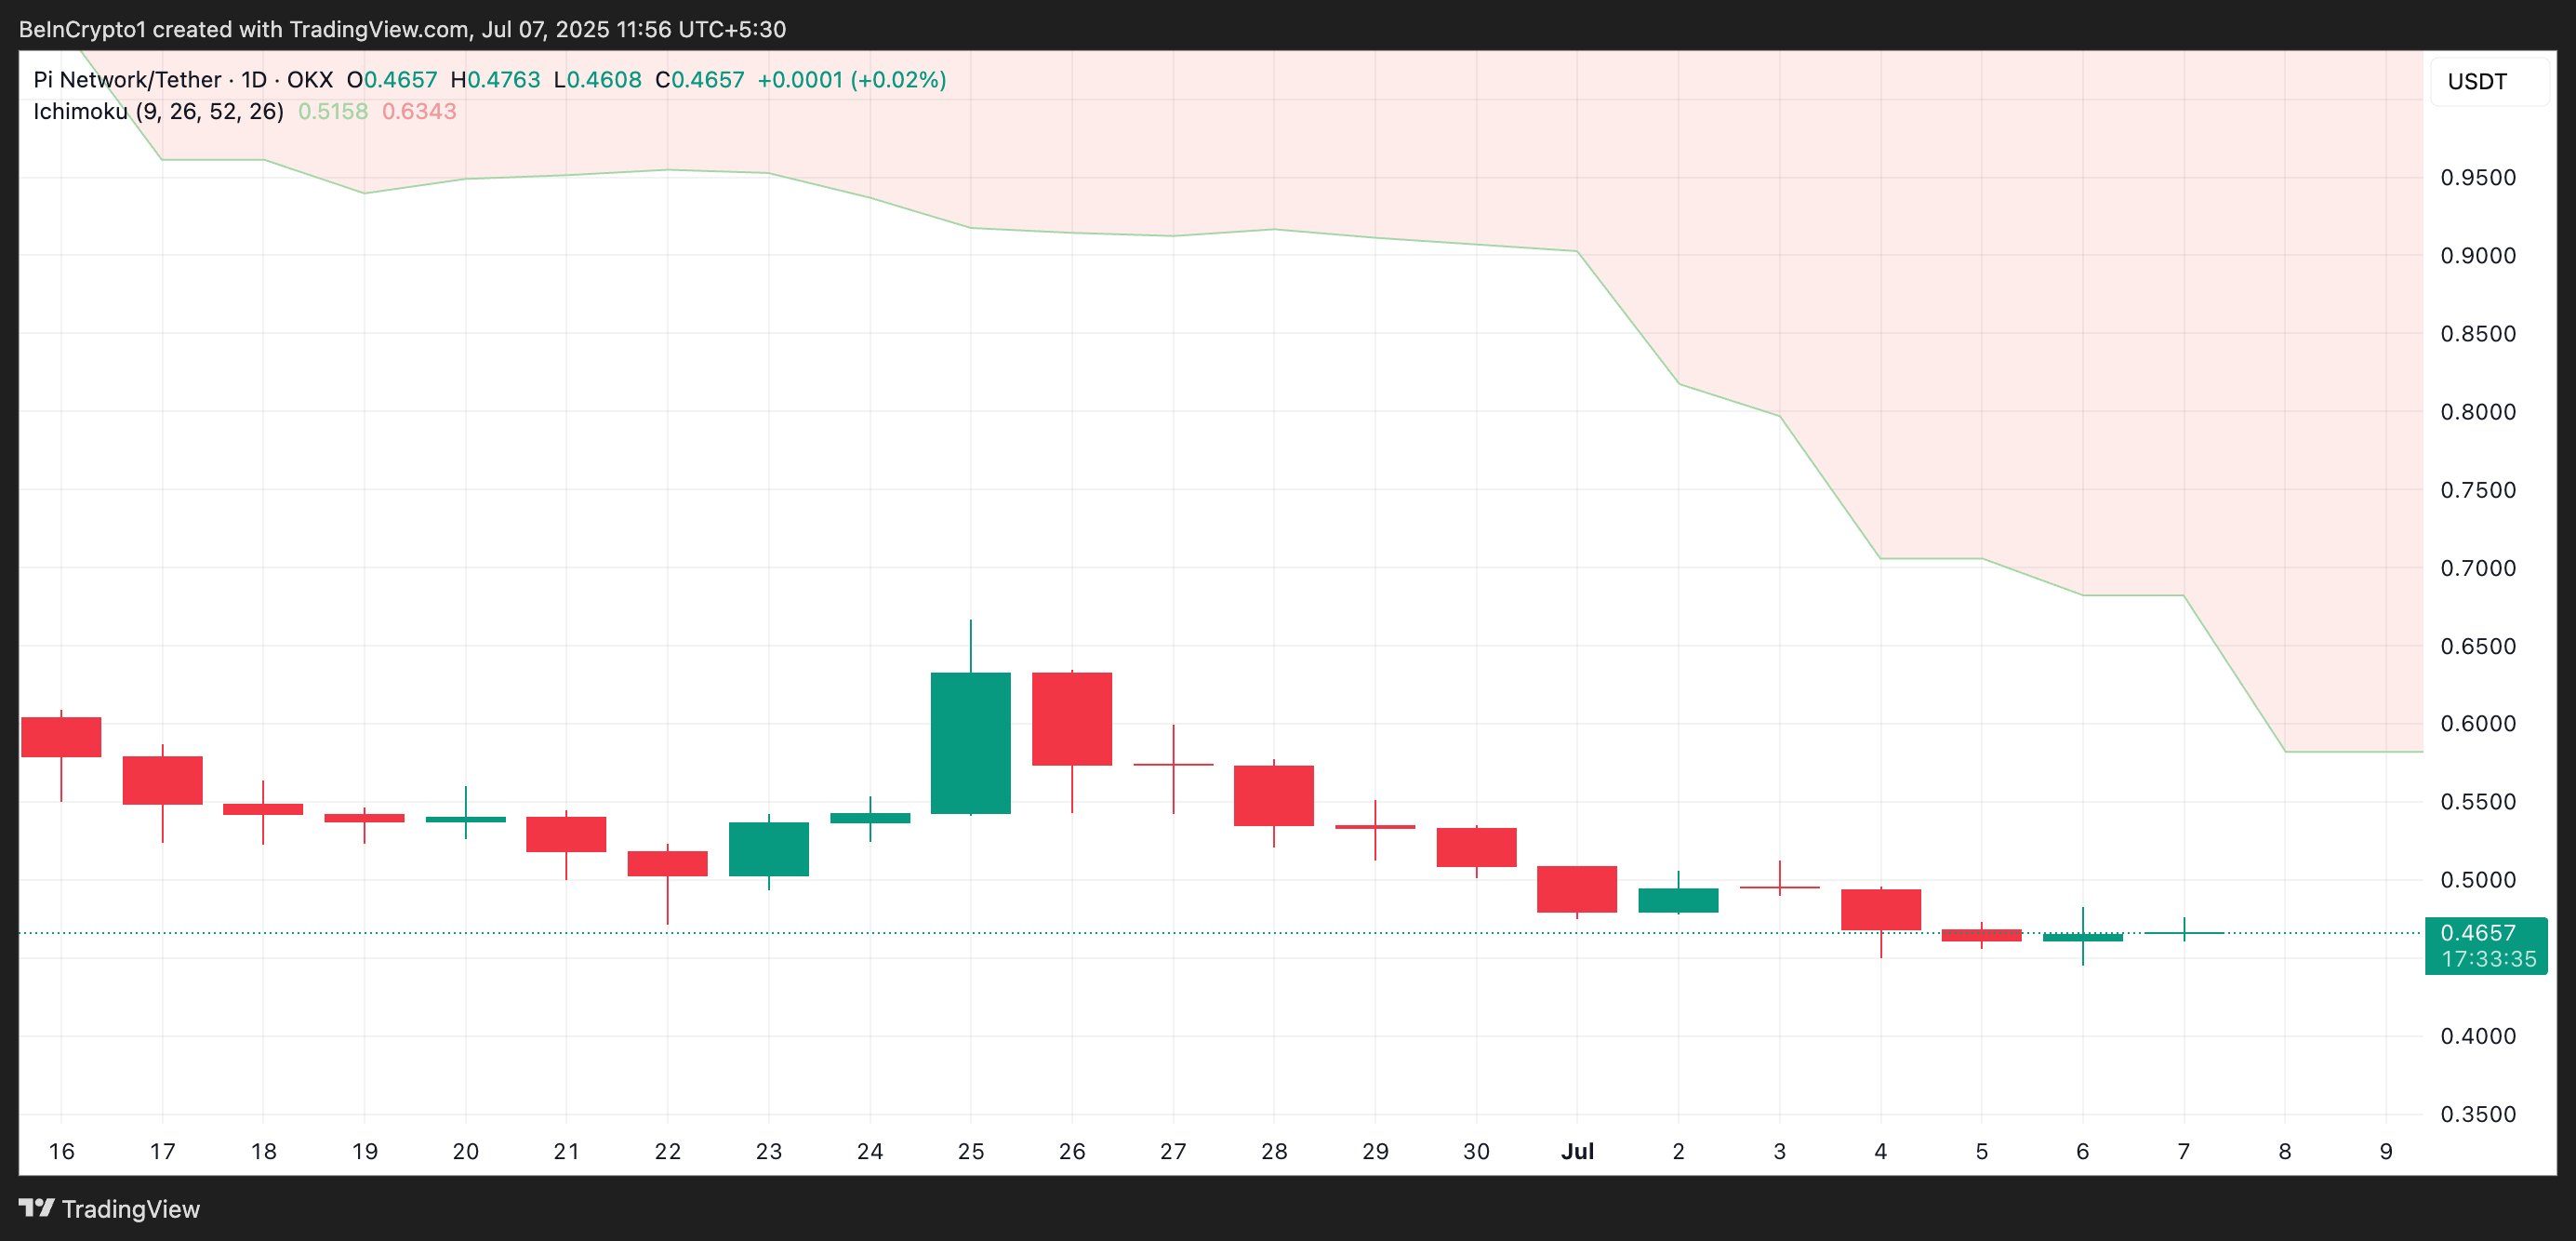
The Ichimoku Cloud tracks the momentum of an asset’s market trends and identifies potential support/resistance levels. When an asset trades above it, the price is in a strong bullish trend. The area above the Cloud is a bullish zone, indicating that market sentiment toward the asset is positive.
However, as with PI, when an asset’s price falls below the Cloud, it signals a strong bearish trend. It means sellers are in control, and upward momentum is limited.
In addition, PI’s Smart Money Index (SMI) has persistently declined since June 25. As of this writing, the indicator is at 1.22, dipping 9% since then.
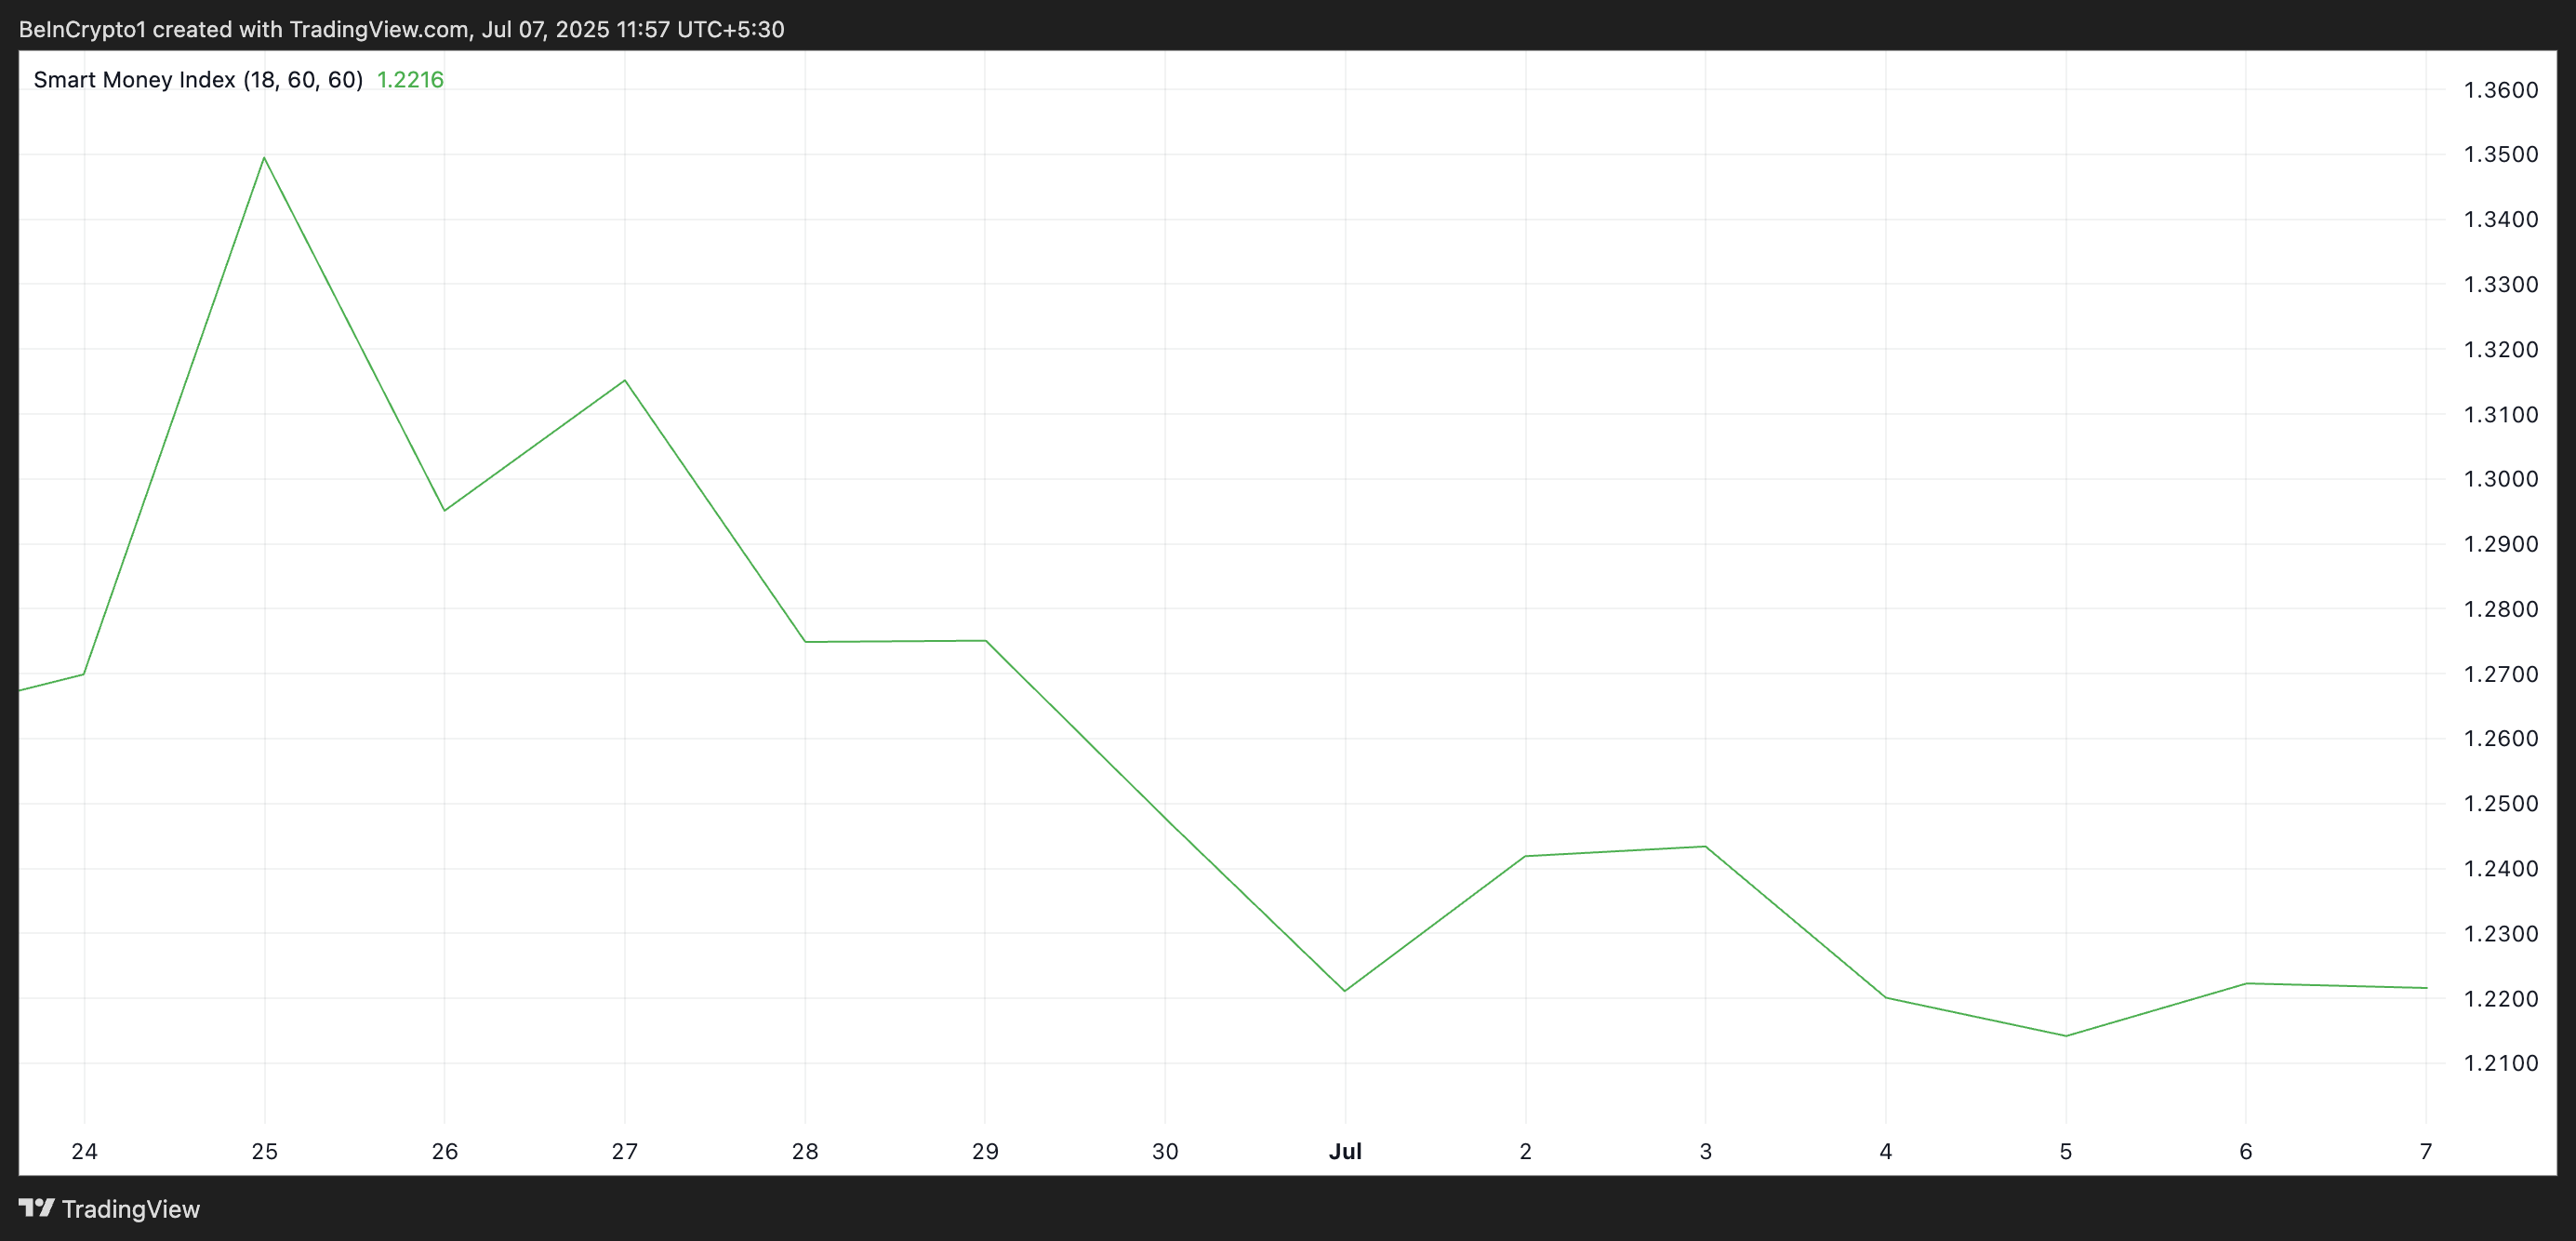
An asset’s SMI tracks the activity of experienced or institutional investors by analyzing market behavior during the first and last hours of trading.
When the indicator rises, it suggests increased buying activity by these investors, signaling growing confidence in the asset.
On the other hand, when it falls like this, there is high selling activity and reduced confidence from experienced investors. This highlights the lack of belief among key token holders in a near-term PI price recovery.
PI on the Brink: Will Bears Drag It to All-Time Lows?
The ongoing weakness across technical indicators paints a cautious picture for investors hoping for a swift rebound. If the bears strengthen their hold on the market and PI selloffs increase, the price could break below the newly formed support floor at $0.44 and plunge toward its all-time low of $0.40.
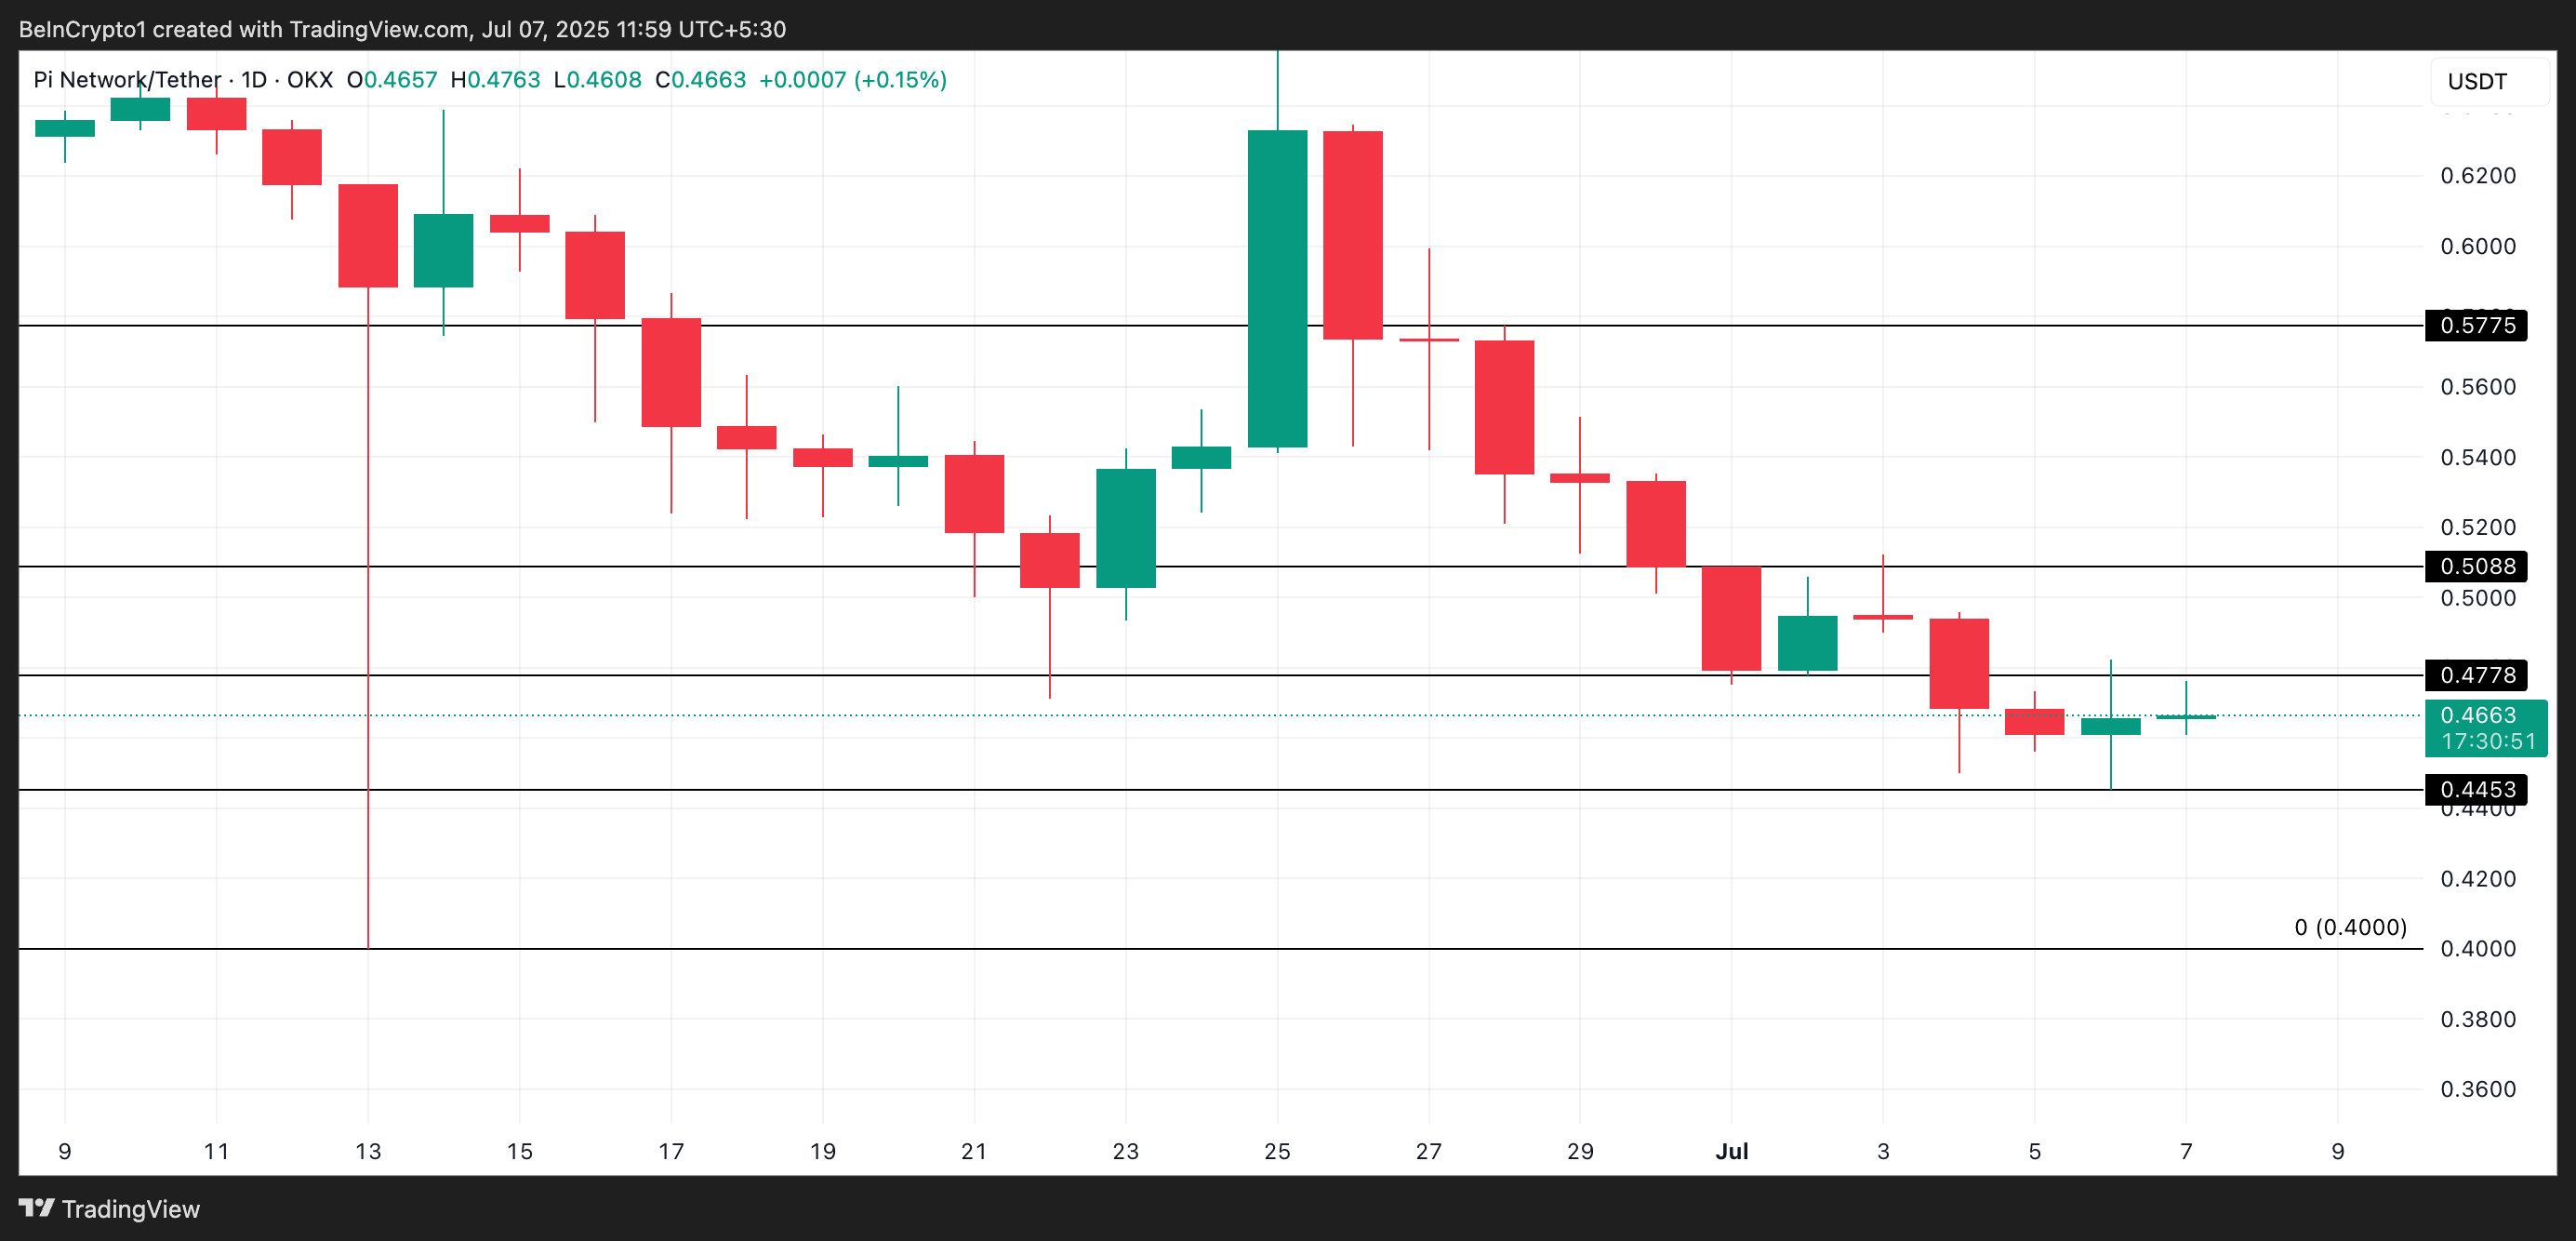
However, an uptick in demand could prevent this. If new buyers enter the market, PI could break above $0.47 and soar to $0.50.



