Trusted

PI Network (PI) Eyes Revisit of $0.40 All-Time Low as Bearish Pressure Mounts

2 mins
Updated by Harsh Notariya
Join our Trading Community on Telegram

In Brief

  • PI Network has dropped 72% since February 26, with technical indicators showing increasing bearish momentum.
  • Negative Balance of Power (BoP) and CMF suggest strengthening sell-offs, indicating further decline in the short term.
  • PI could revisit its $0.40 all-time low if the downtrend continues, but a price surge to $1.01 is possible if demand picks up.
  • promo

PI has been on a steady downtrend since February 26, shedding 72% of its value as bearish sentiment continues to weigh on the token.

Bearish pressure continues to mount on the PI token, suggesting that it may be poised to enter a new phase of decline. 

PI Network Risks Fresh Decline

An assessment of the PI/USD one-day chart reveals that token holders remain steadfast in their distribution. At press time, PI’s Balance of Power (BoP) is negative, reflecting the selling pressure in the market. 

PI BoP.
PI BoP. Source: TradingView

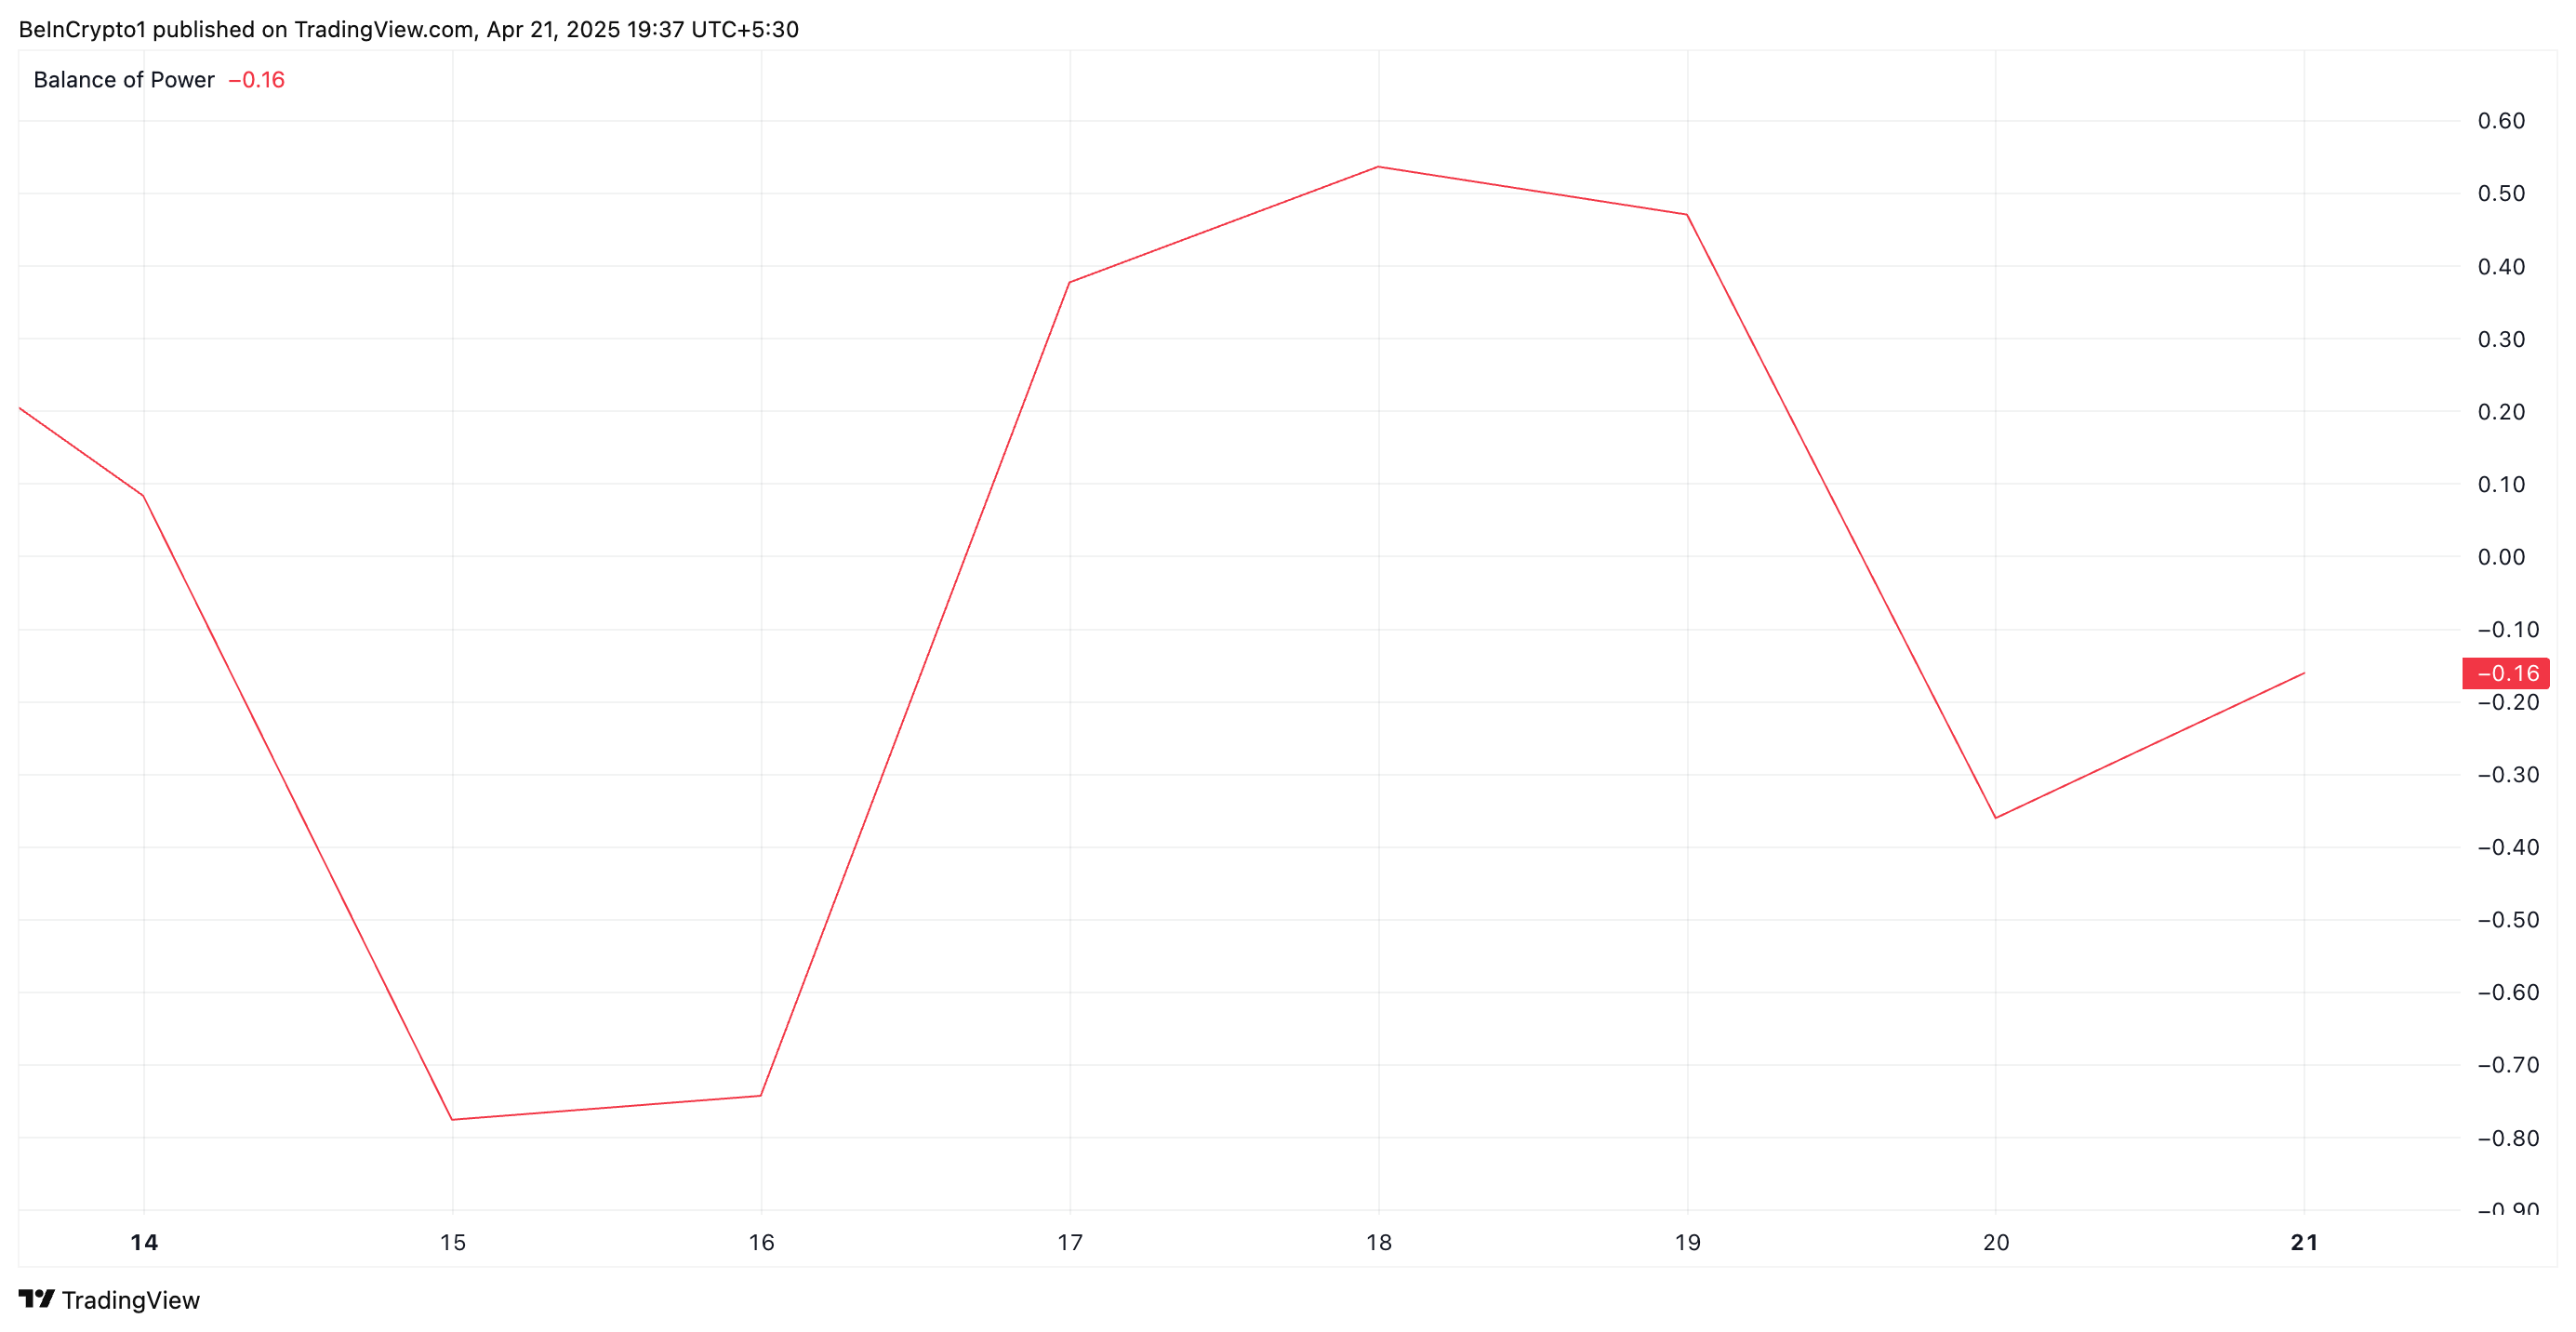
The BoP indicator measures the strength of buying versus selling pressure by comparing the close price to the trading range within a given period. When BOP is negative like this, it indicates that sellers are dominating the market, suggesting downward pressure on the asset’s price.

Further, the setup of PI’s Chaikin Money Flow (CMF) supports this bearish outlook. At press time, this is below the central line at -0.12.

PI CMF
PI CMF. Source: TradingView

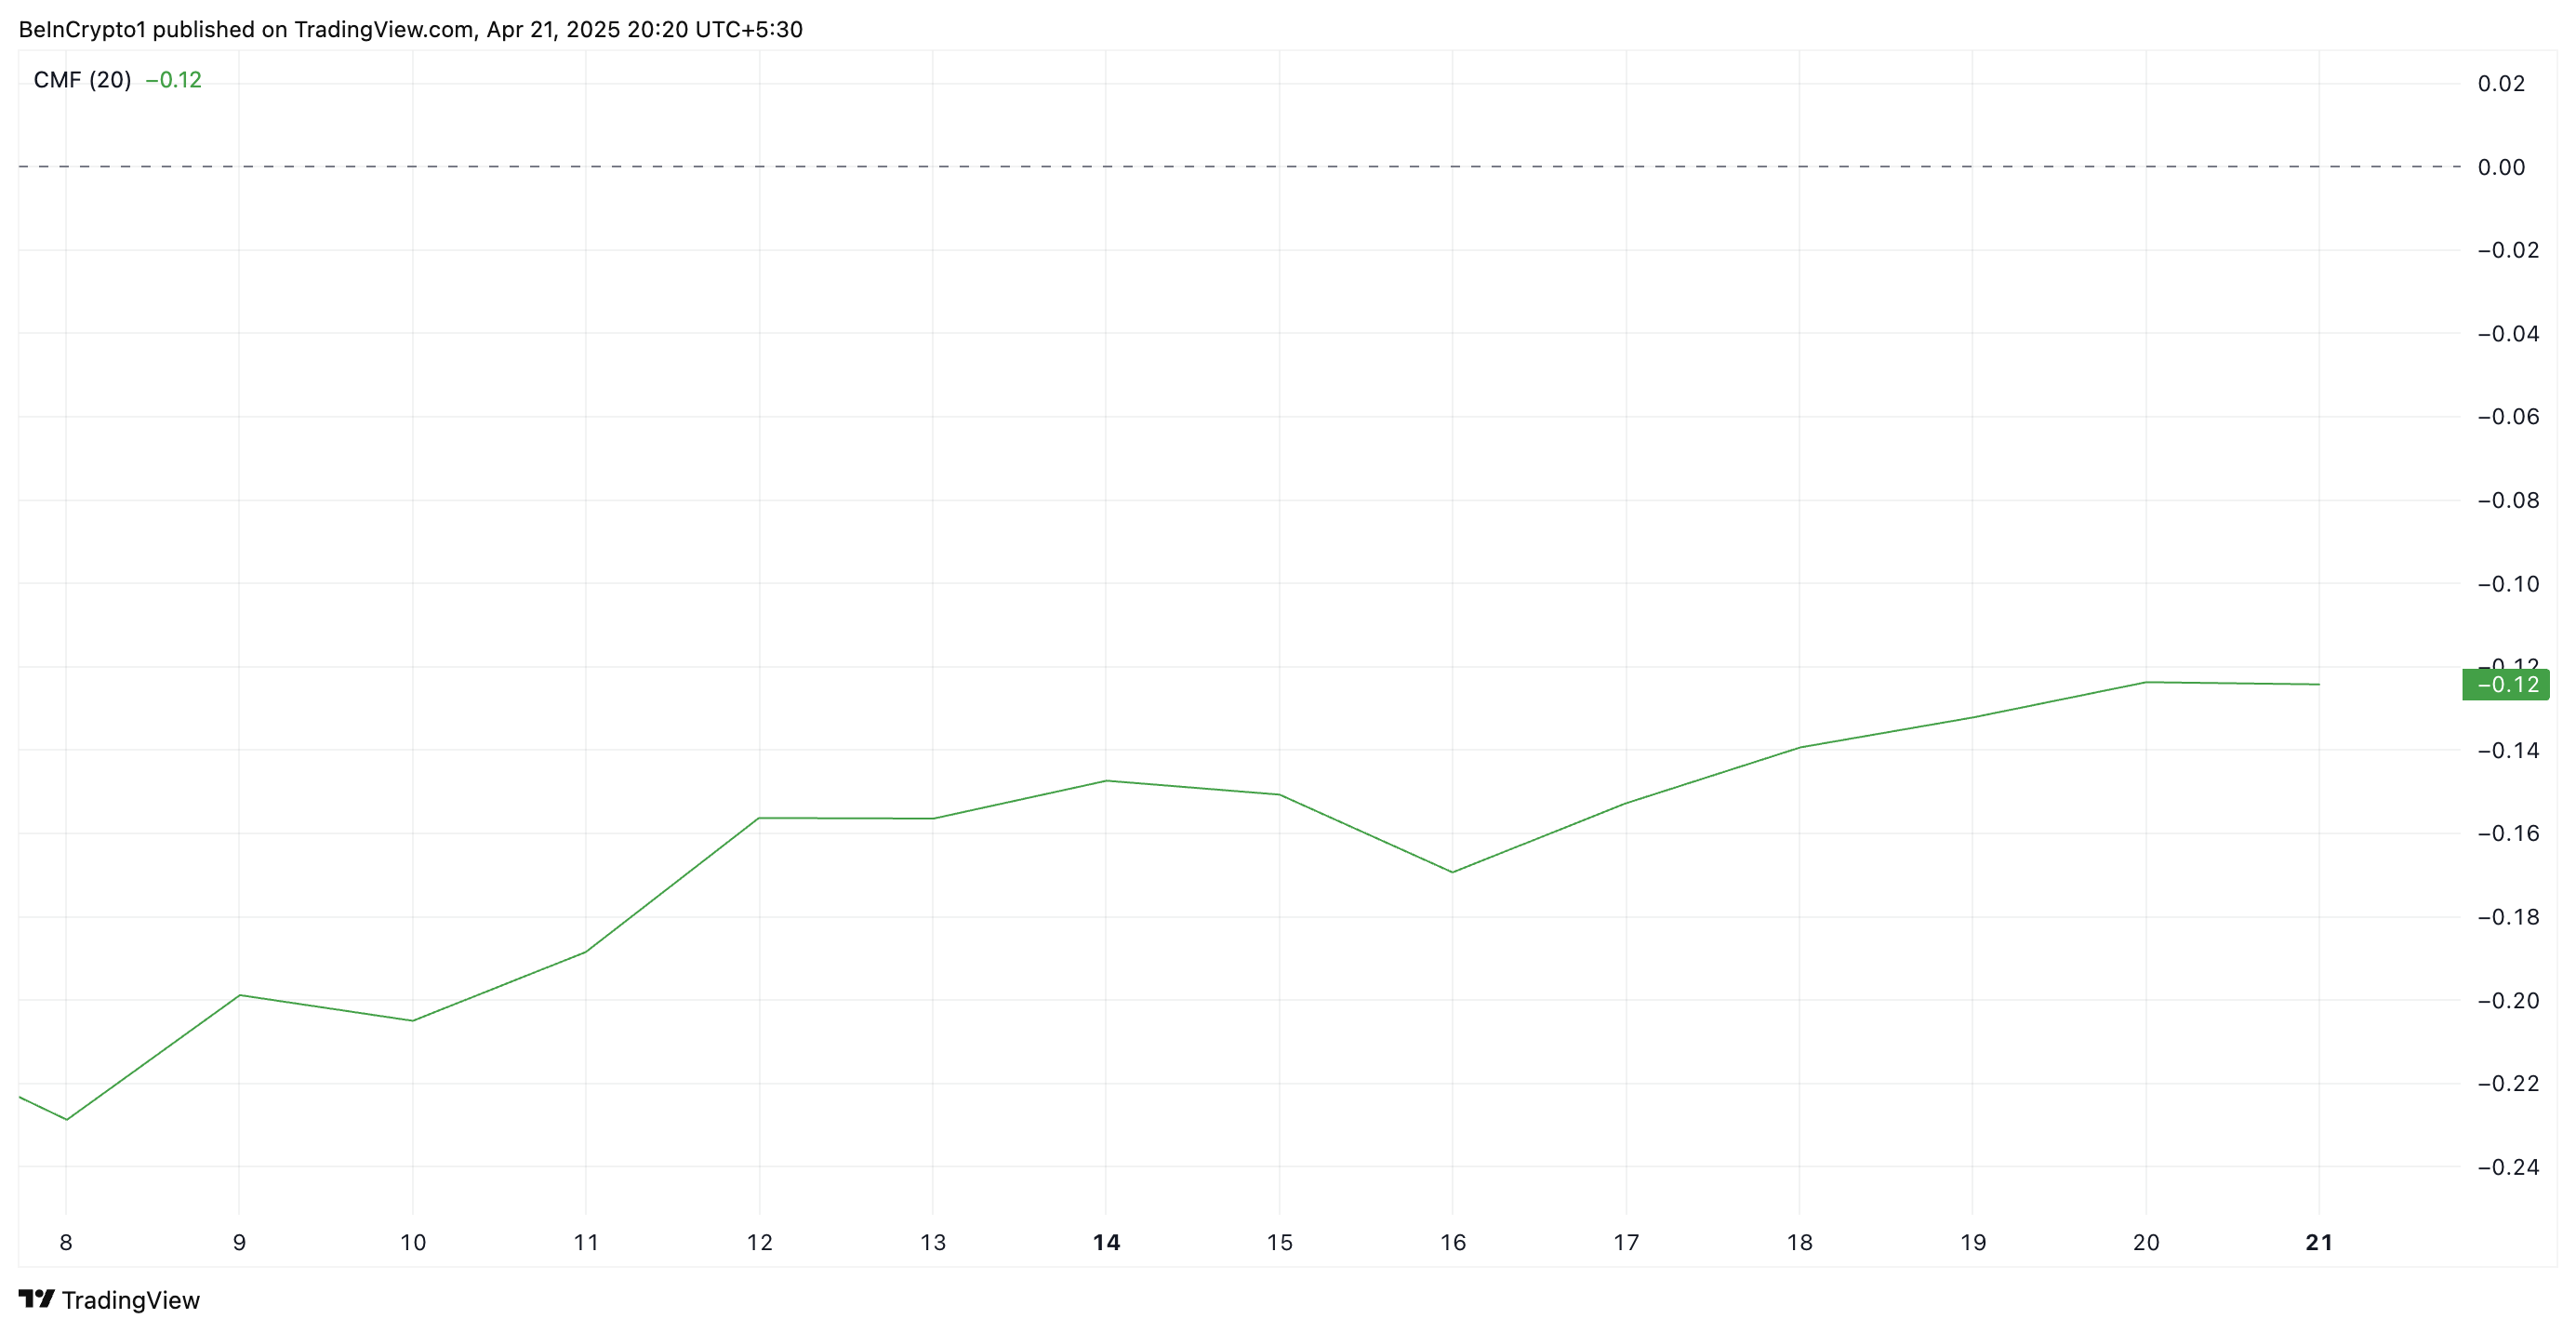
The CMF indicator measures an asset’s buying and selling pressure. A negative CMF reading suggests that the asset is experiencing more selling pressure than buying pressure. This means PI traders are distributing rather than accumulating. This signals bearish sentiment and confirms the downward momentum in the token’s price.

Sellers Tighten Grip on PI, But Recovery to $1.01 Still on the Table

At press time, PI trades at $0.63, below the dynamic support formed above it at $0.93 by its Super Trend indicator. 

The Super Trend indicator helps traders identify the market’s direction by placing a line above or below the price chart based on the asset’s volatility

When an asset’s price trades below the Super Trend line like this, it signals a bearish trend and hints at potential decline. If PI’s decline strengthens, it could revisit its all-time low of $0.40. 

PI Super Trend Indicator
PI Super Trend Indicator. Source: TradingView

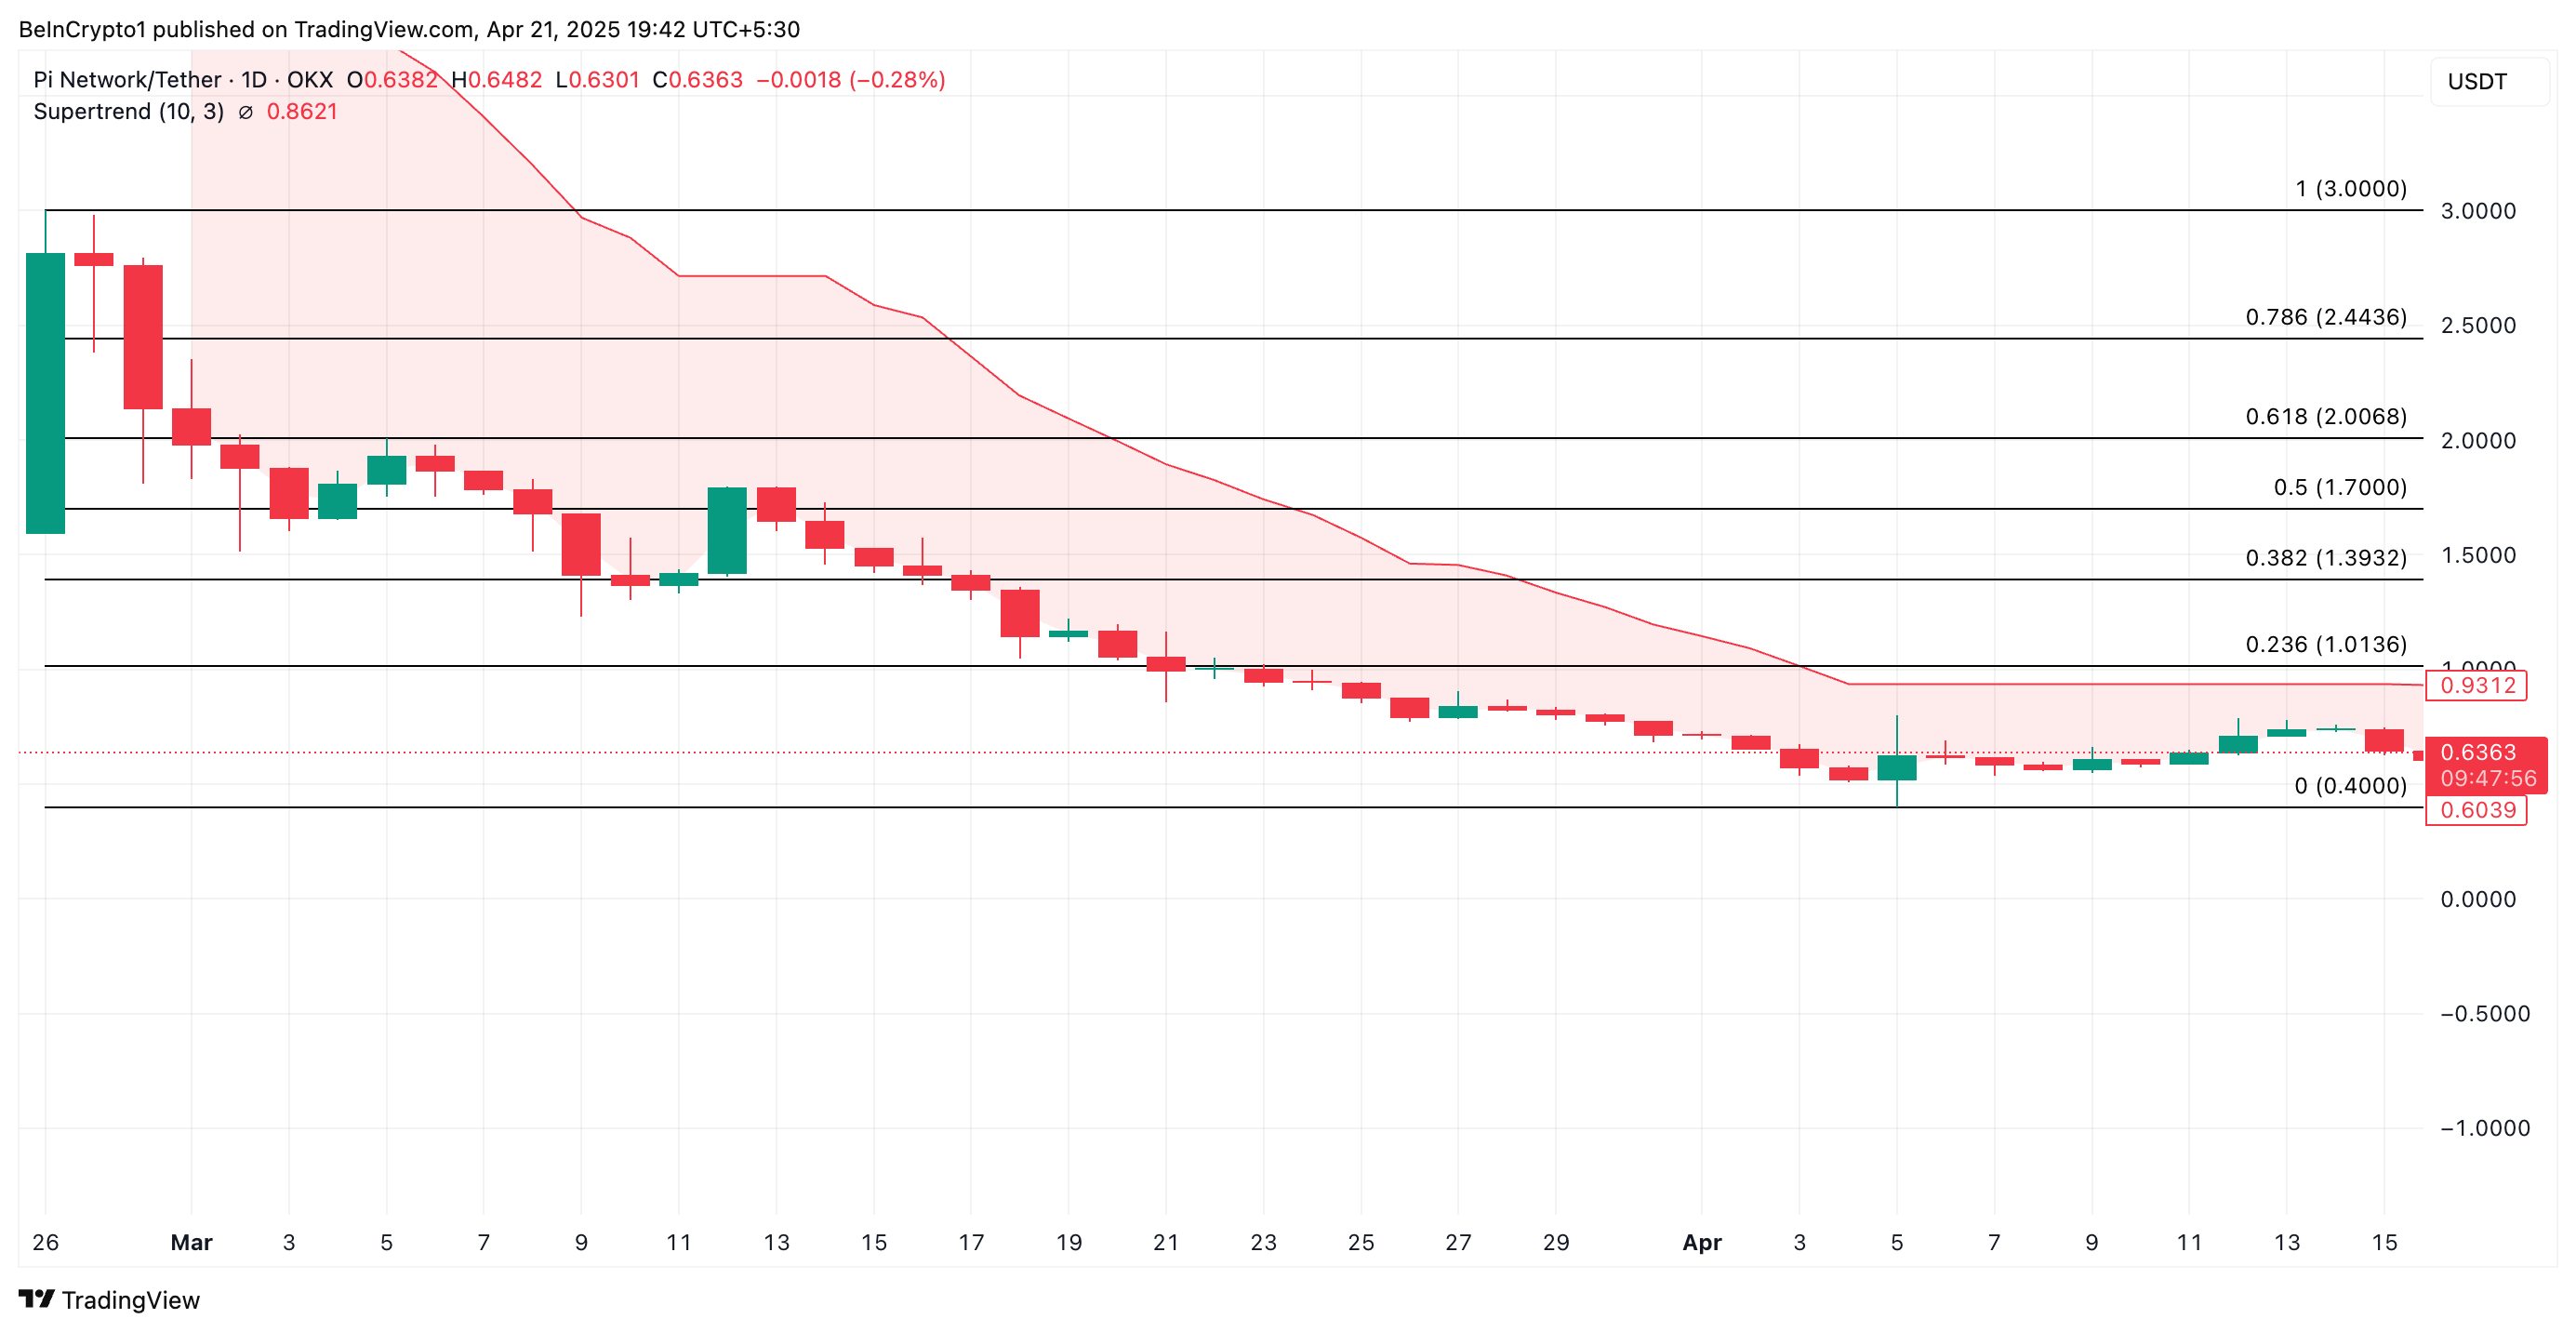
However, if demand returns to the PI market, its price could break above the resistance at $0.86 and surge to $1.01. 

Top crypto platforms in the US
eToro eToro Explore
Arkham Arkham Explore
Plus500 Plus500 Explore
Moonacy Moonacy Explore
Uphold Uphold Explore
Top crypto platforms in the US
eToro eToro Explore
Arkham Arkham Explore
Plus500 Plus500 Explore
Moonacy Moonacy Explore
Uphold Uphold Explore
Top crypto platforms in the US
eToro eToro
Arkham Arkham
Plus500 Plus500
Moonacy Moonacy
Uphold Uphold

Disclaimer

In line with the Trust Project guidelines, this price analysis article is for informational purposes only and should not be considered financial or investment advice. BeInCrypto is committed to accurate, unbiased reporting, but market conditions are subject to change without notice. Always conduct your own research and consult with a professional before making any financial decisions. Please note that our Terms and ConditionsPrivacy Policy, and Disclaimers have been updated.

Untitled-1.png
Abiodun Oladokun
Abiodun Oladokun is a Technical and On-Chain Analyst at BeInCrypto, where he specializes in market reports on cryptocurrencies from diverse sectors, including decentralized finance (DeFi), real-world assets (RWA), artificial intelligence (AI), decentralized physical infrastructure networks (DePIN), Layer 2s, and meme coins. Previously, he conducted market analysis and technical assessments of various altcoins at AMBCrypto, utilizing on-chain analytics platforms like Messari, Santiment...
READ FULL BIO
Sponsored
Sponsored