Trusted

PI Coin Plummets 24%: Is Seller Fatigue Signaling a Rebound?

2 mins
Updated by Ann Maria Shibu
Join our Trading Community on Telegram

In Brief

  • PI tumbles 24% in the $160 billion crypto market crash, but technical indicators suggest a potential rebound.
  • PI’s RSI is at 31.36, nearing oversold territory, signaling weakening selling pressure and a possible price recovery.
  • PI’s price must surpass $2.56 to trigger a rebound toward $3, but failure to do so may result in a decline to $1.62.
  • promo

The crypto market has suffered a massive downturn, wiping out $160 billion in total market capitalization over the past 24 hours. This sharp decline has caused PI to shed 24% of its value.

However, technical indicators suggest that a rebound could be on the horizon for the popular altcoin. 

PI’s Market Decline Shows Signs of Seller Fatigue 

PI’s hourly chart reveals that its Relative Strength Index (RSI) is near the oversold territory, signaling that selling pressure may be reaching exhaustion. As of this writing, this momentum indicator is downward at 31.36.

PI RSI.
PI RSI. Source: Tradingview

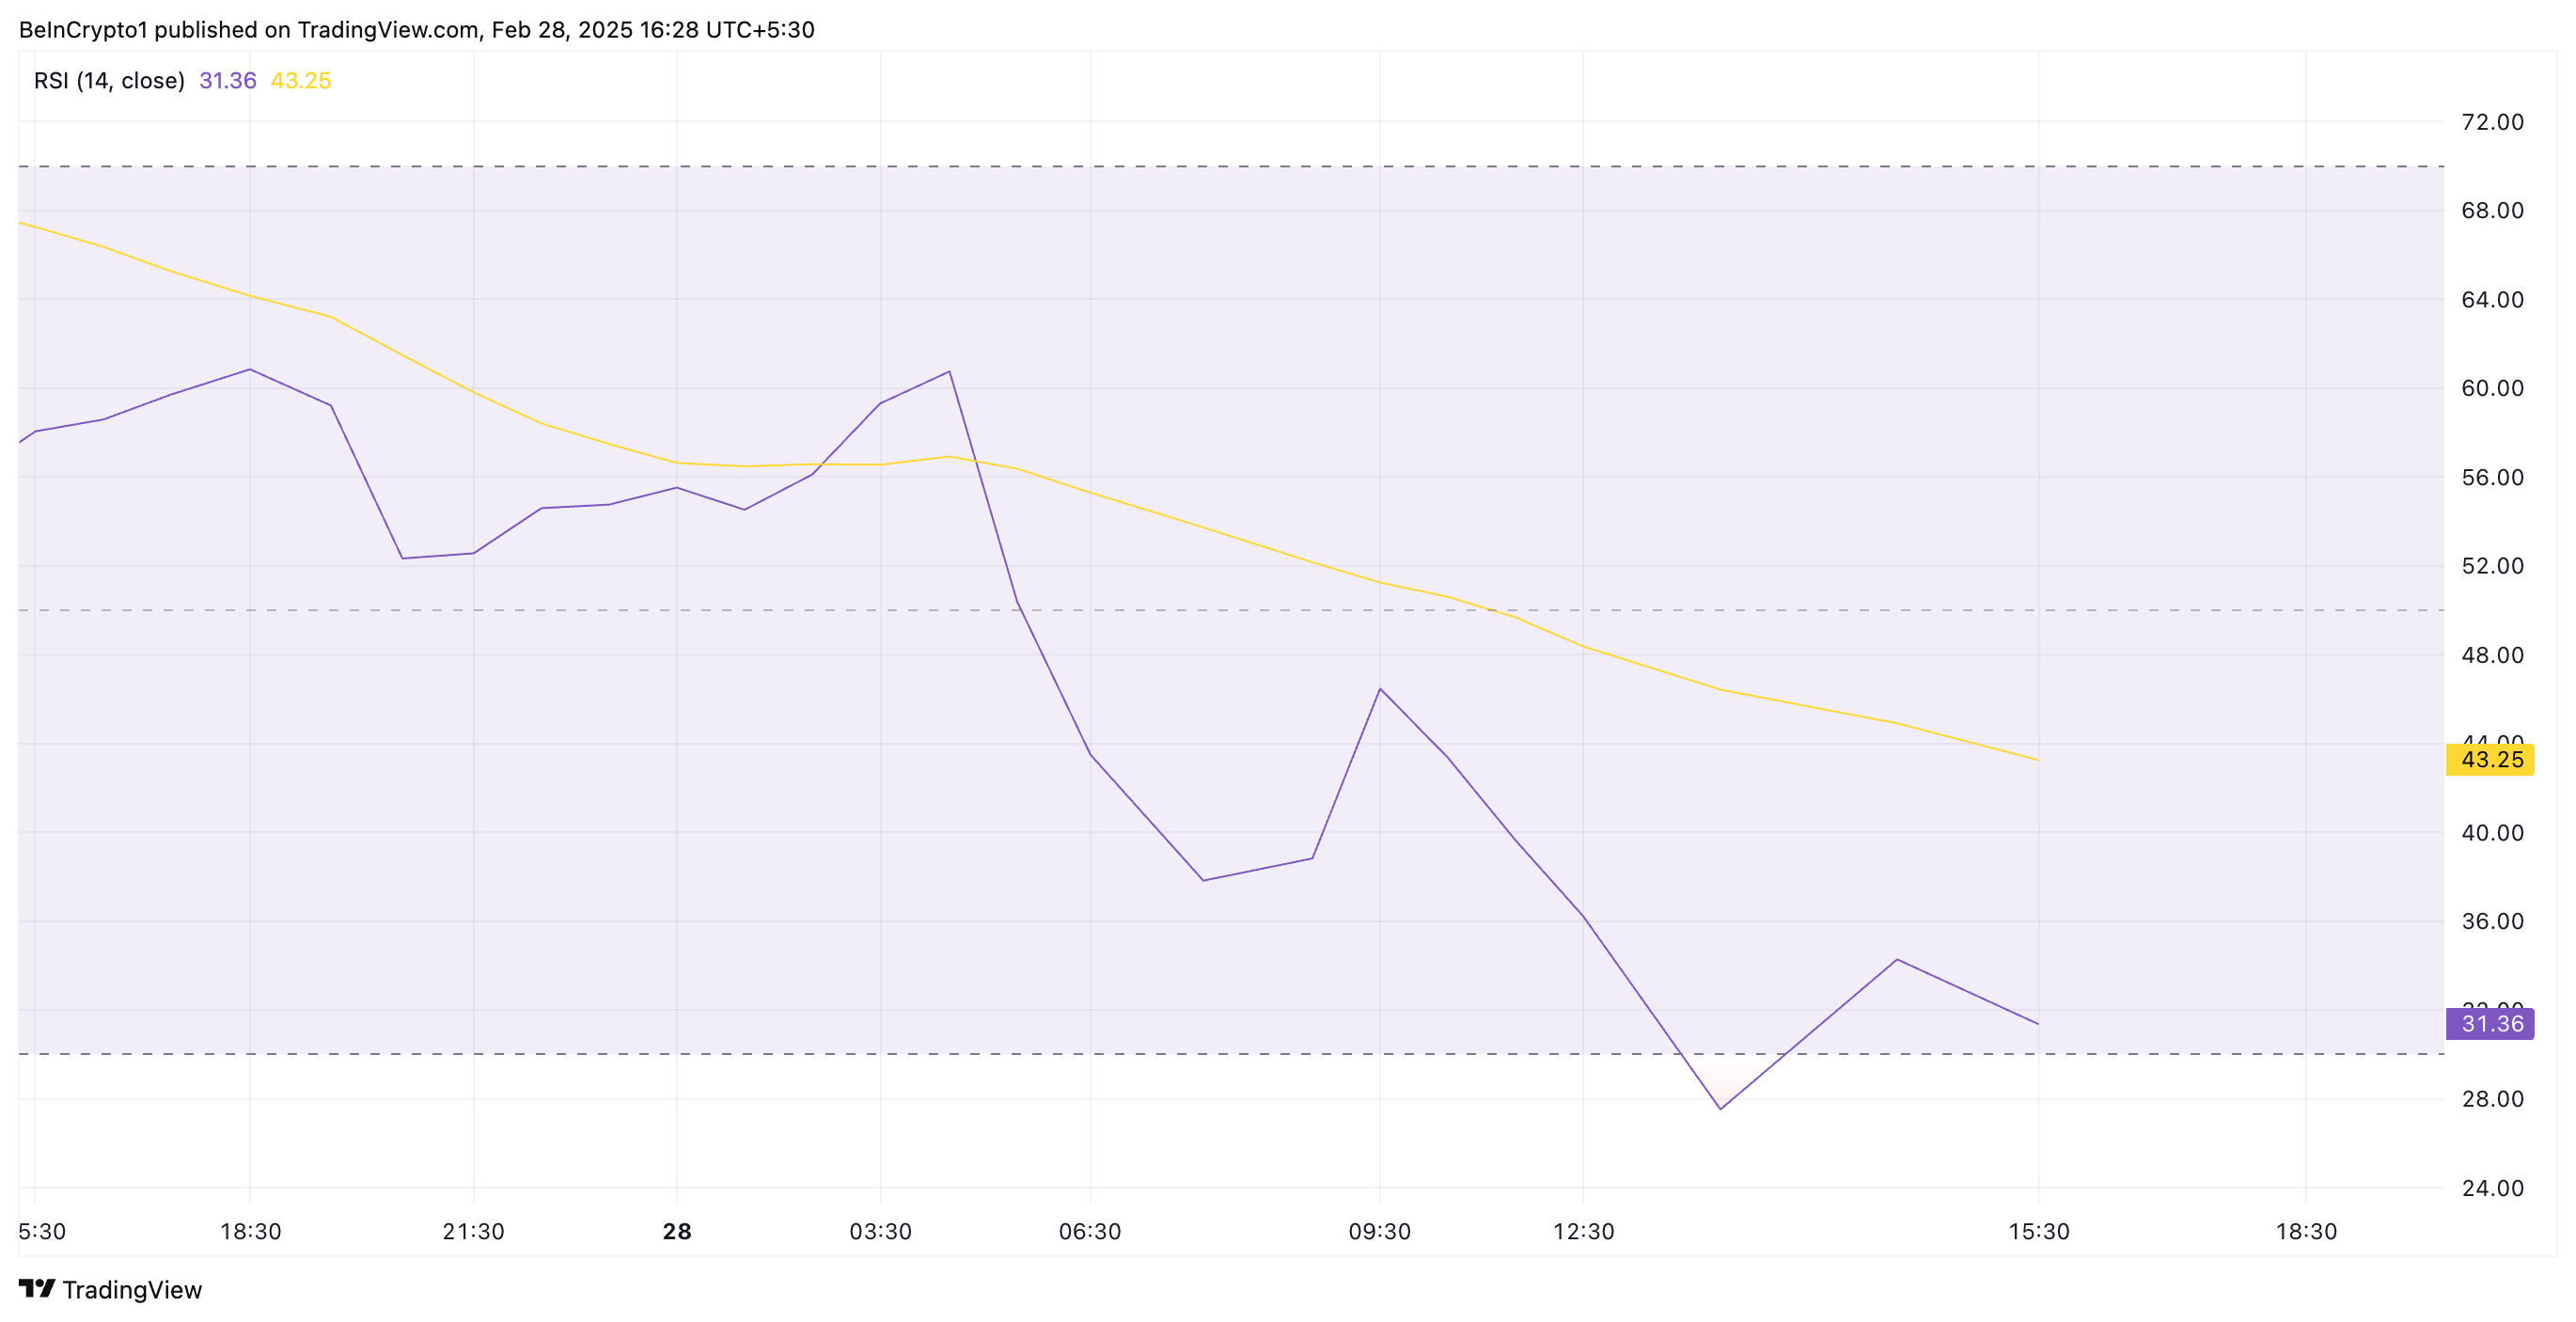
An asset’s RSI measures its overbought and oversold market conditions. It ranges between 0 and 100, with values above 70 indicating that the asset is overbought and due for a retracement. On the other hand, values under 30 suggest that the asset is oversold and may witness a rebound.

At 31.36, PI’s RSI signals that the token is nearing oversold territory. This suggests weakening selling pressure and the potential for a price rebound if buyers step in.

In addition, PI’s price just broke below the lower line of its Bollinger Bands indicator, confirming sellers’ exhaustion. This indicator is a volatility marker consisting of a middle-moving average line and two outer bands that expand and contract based on price fluctuations. 

PI Bollinger Bands
PI Bollinger Bands. Source: Tradingview

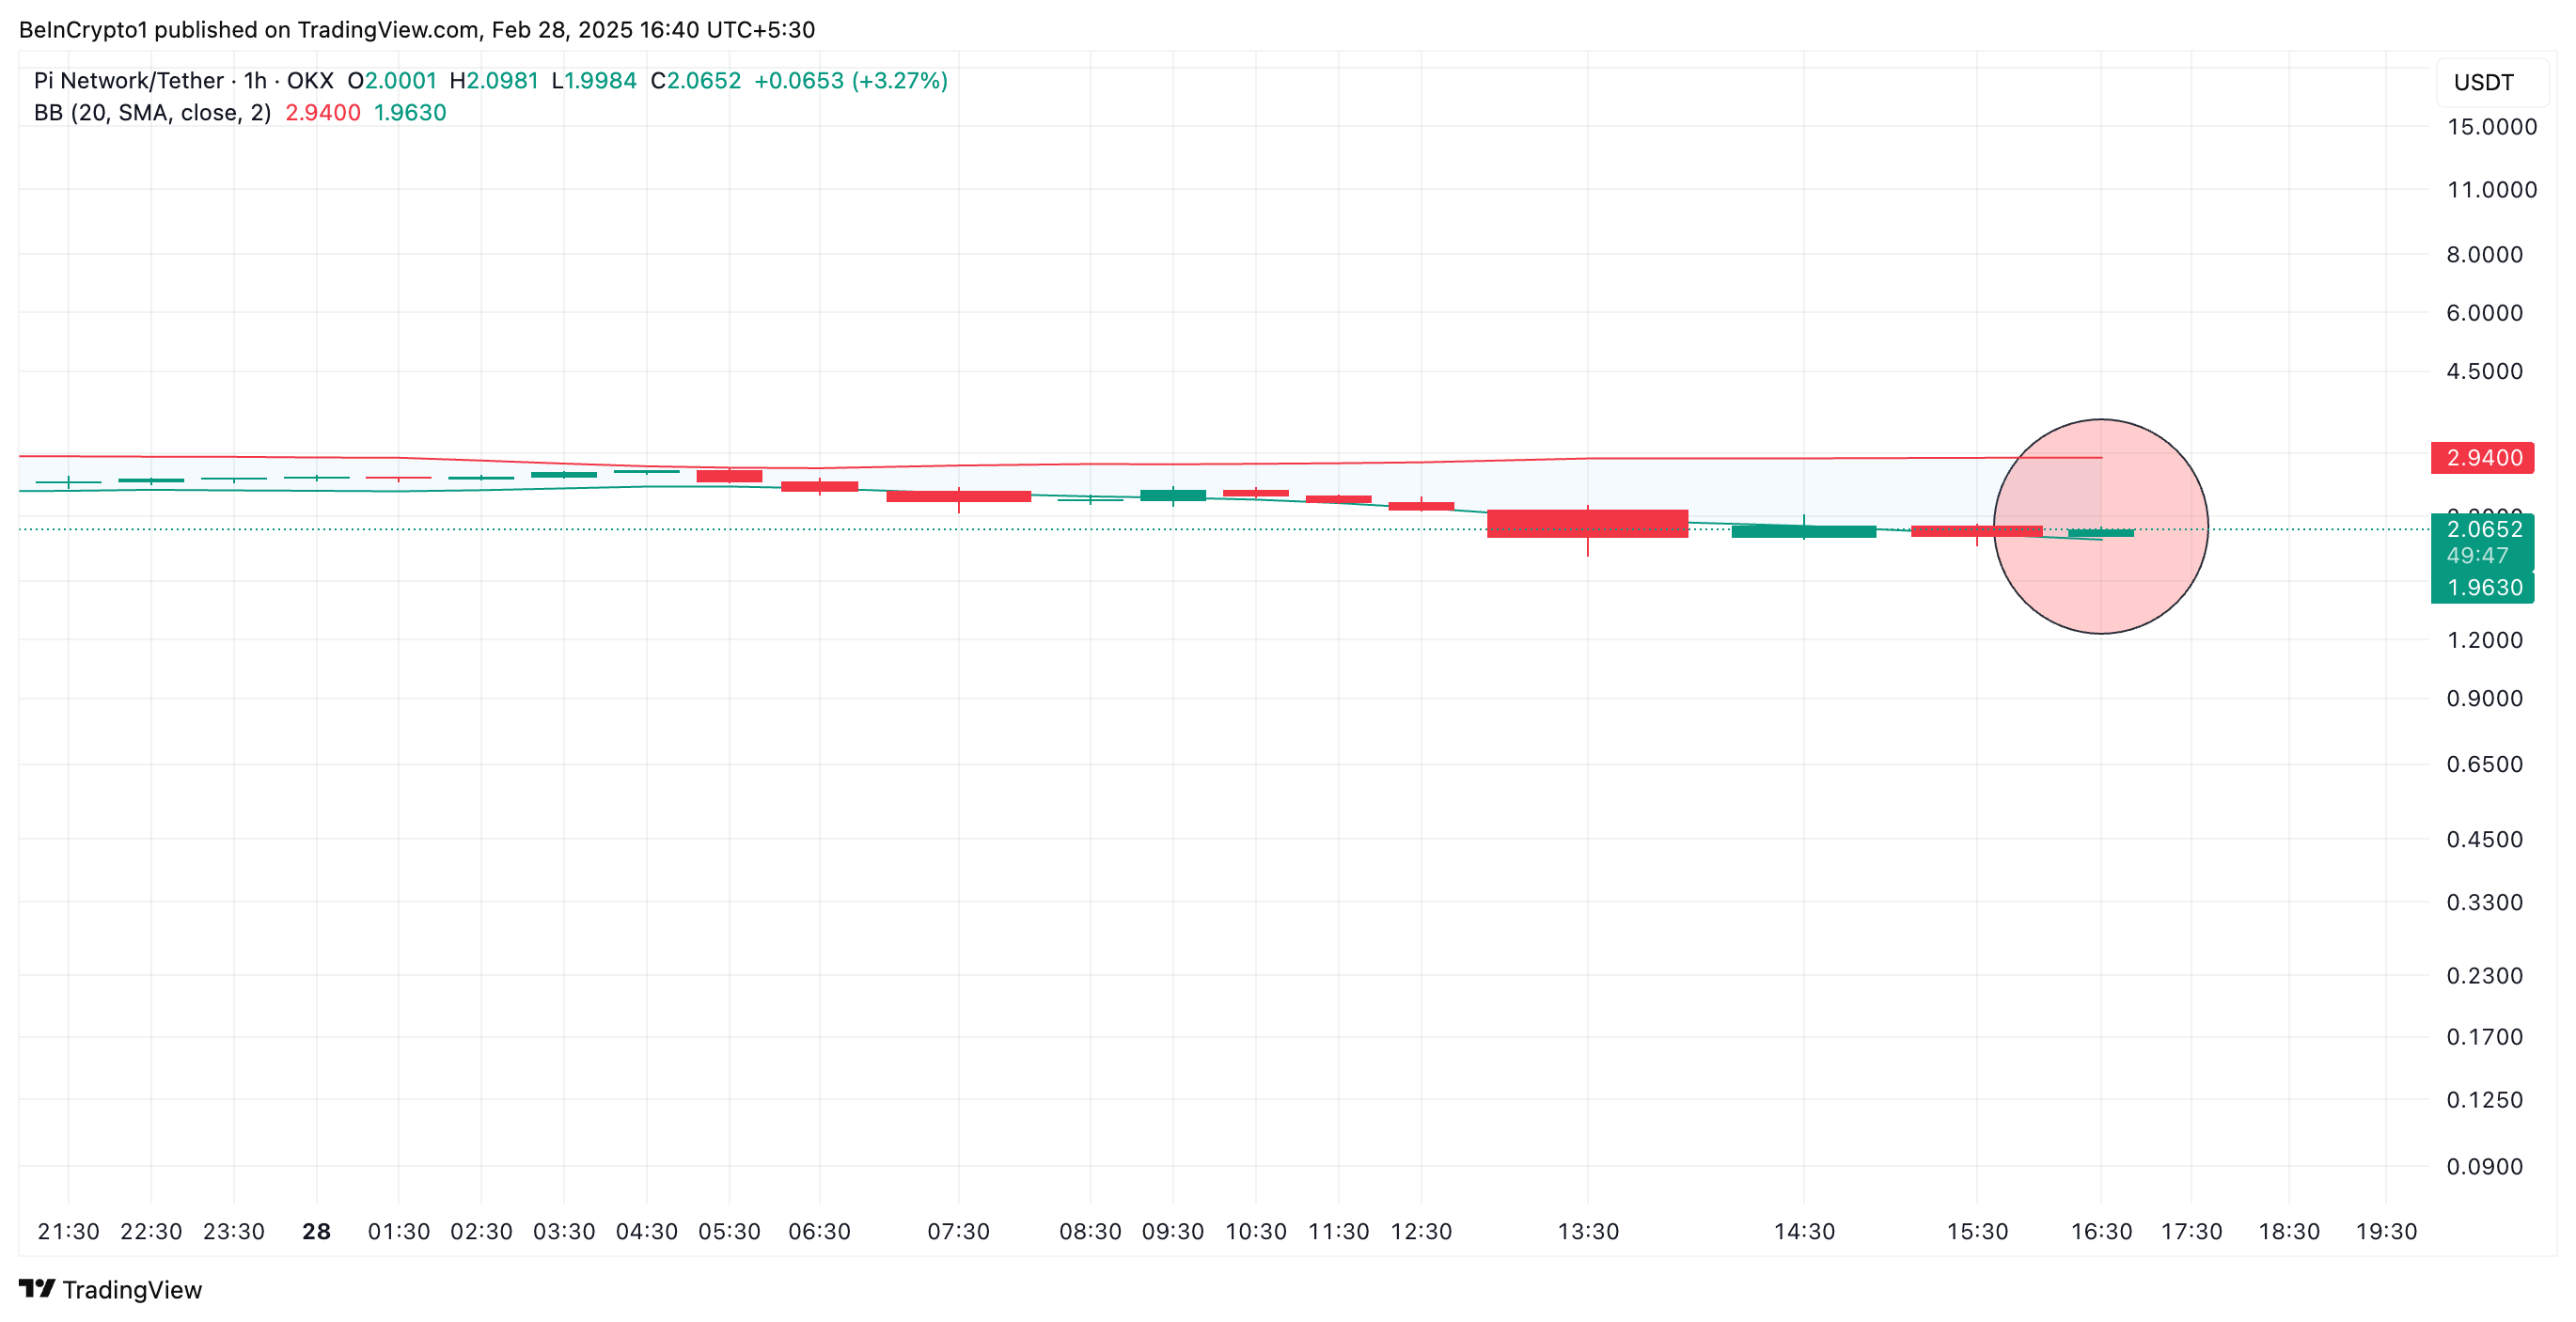
When an asset’s price breaks below the lower band, it signals that it is oversold and trading at an extreme deviation from its average price. If buying pressure increases, this can indicate a possible rebound or trend reversal.

PI Teeters at Crucial Level—Breakout or Breakdown Ahead?

A resurgence in PI demand could trigger a rebound toward its all-time high of $3, which was reached on Thursday. This represents a 44% uptick from its current value of $2.08. However, for this to happen, PI must first break above the resistance formed at $2.56.

PI Price Analysis
PI Price Analysis. Source: TradingView

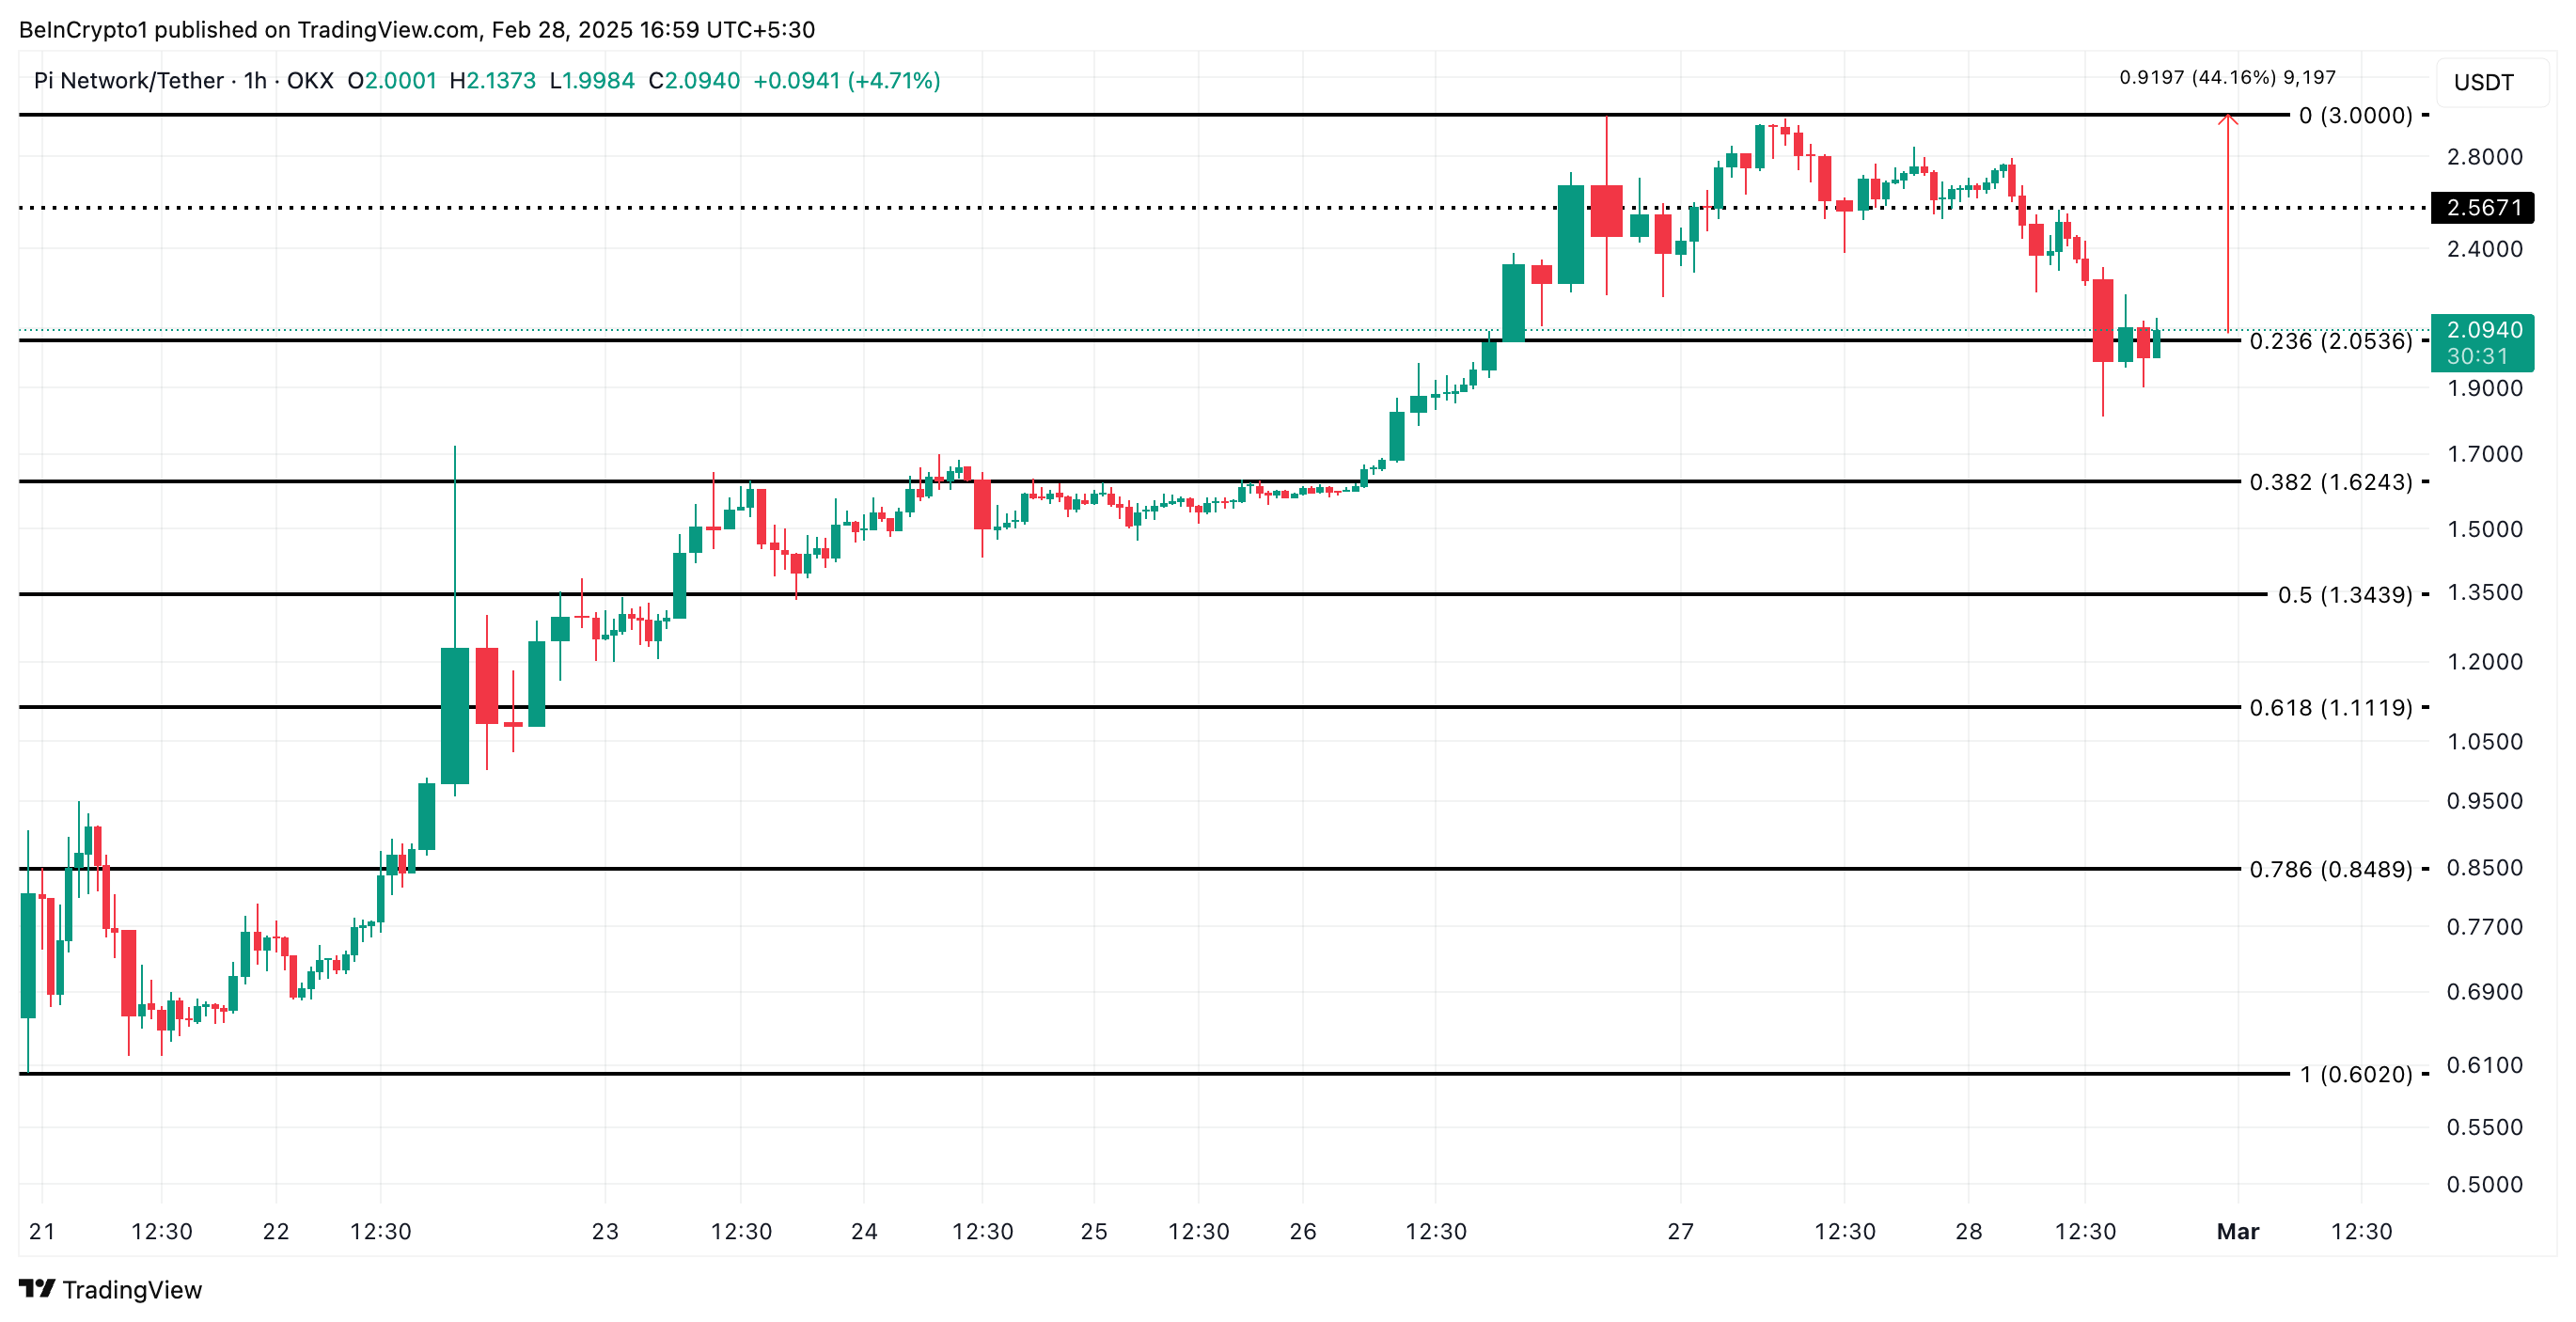
Conversely, if the downtrend continues due to a lack of new demand for PI, its price could plummet toward $1.62. 

Best crypto platforms in Europe
YouHodler YouHodler Explore
Wirex Wirex Explore
eToro eToro Explore
BingX BingX Explore
Best crypto platforms in Europe
YouHodler YouHodler Explore
Wirex Wirex Explore
eToro eToro Explore
BingX BingX Explore
Best crypto platforms in Europe
OKX OKX
YouHodler YouHodler
Wirex Wirex
eToro eToro
BingX BingX

Disclaimer

In line with the Trust Project guidelines, this price analysis article is for informational purposes only and should not be considered financial or investment advice. BeInCrypto is committed to accurate, unbiased reporting, but market conditions are subject to change without notice. Always conduct your own research and consult with a professional before making any financial decisions. Please note that our Terms and ConditionsPrivacy Policy, and Disclaimers have been updated.

Untitled-1.png
Abiodun Oladokun
Abiodun Oladokun is a Technical and On-Chain Analyst at BeInCrypto, where he specializes in market reports on cryptocurrencies from diverse sectors, including decentralized finance (DeFi), real-world assets (RWA), artificial intelligence (AI), decentralized physical infrastructure networks (DePIN), Layer 2s, and meme coins. Previously, he conducted market analysis and technical assessments of various altcoins at AMBCrypto, utilizing on-chain analytics platforms like Messari, Santiment...
READ FULL BIO
Sponsored
Sponsored