
PI Network’s native token, PI, staged a breakout on the daily chart on Friday, pushing above a resistance line that has capped its gains since mid-August.
The move comes amid renewed momentum across the broader crypto market. With technical indicators signaling a surge in demand, PI could be poised for a fresh leg higher.
Market Sentiment Turns as PI Clears Barrier
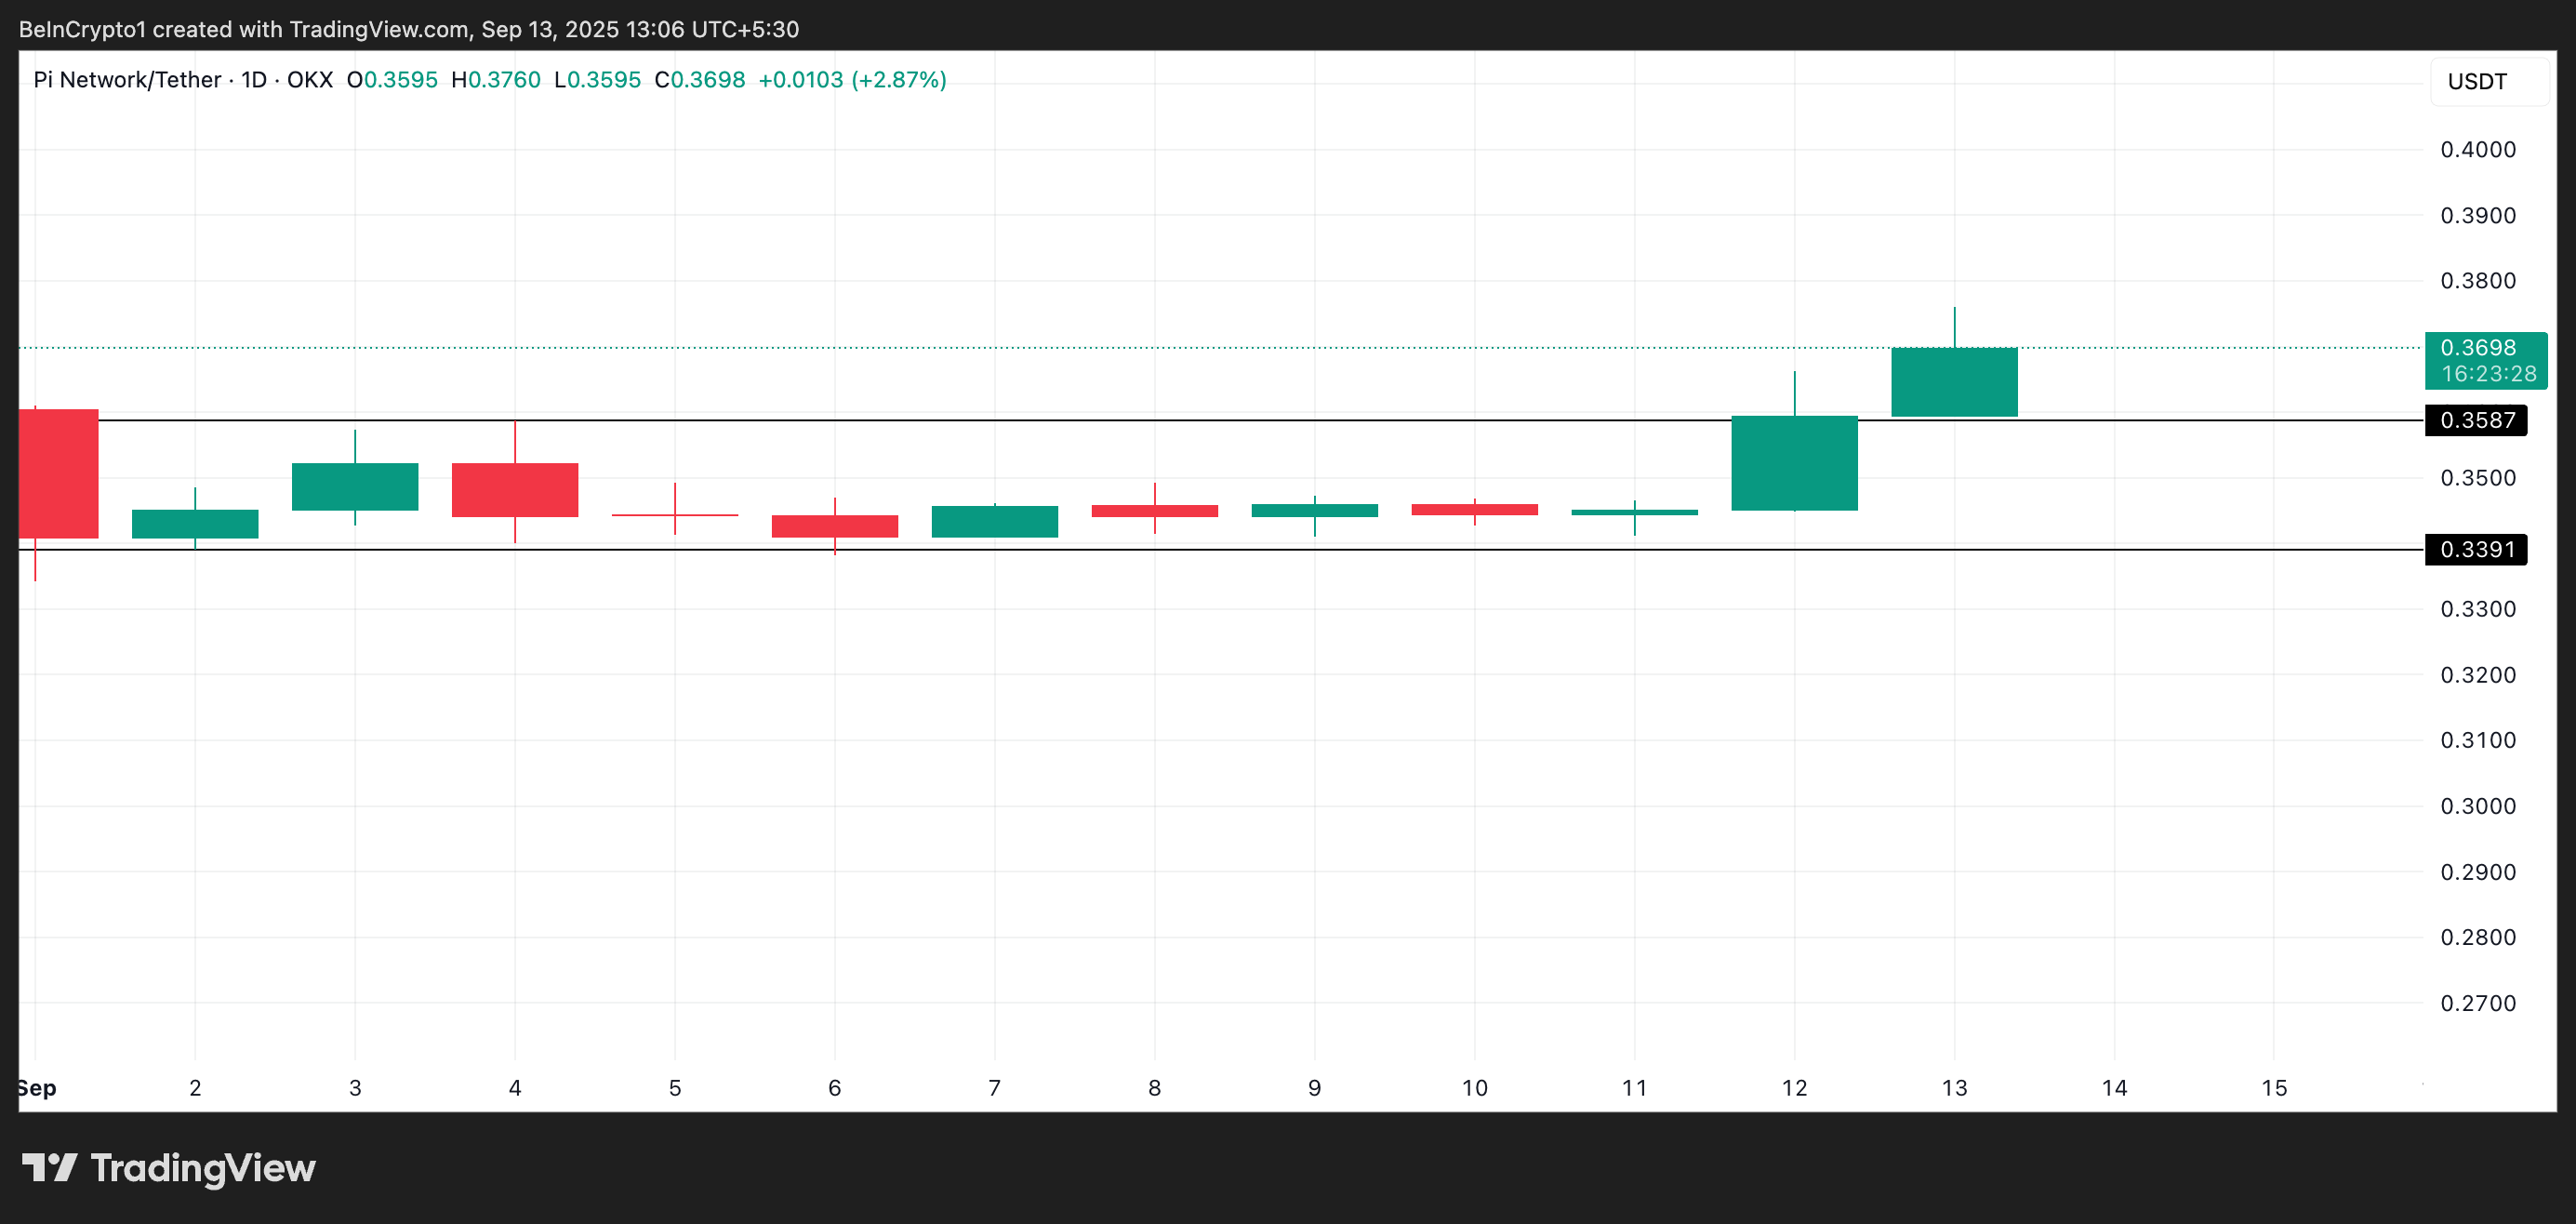
During Friday’s trading session, PI saw a sharp uptick in demand, closing the day above the upper line of a horizontal channel that had kept its price trending sideways since August 19.
That ceiling, formed at the $0.3587 level, has now been flipped into a support floor, marking a significant shift in market sentiment.
For token TA and market updates: Want more token insights like this? Sign up for Editor Harsh Notariya’s Daily Crypto Newsletter here.
PI Pushes Past Resistance With New Demand
Readings from PI’s technical indicators confirm this surge in new demand for the token. For example, the token’s Chaikin Money Flow (CMF) currently rests above the zero line and is in an upward trend, signalling buy-side pressure. At press time, the metric sits at 0.04.
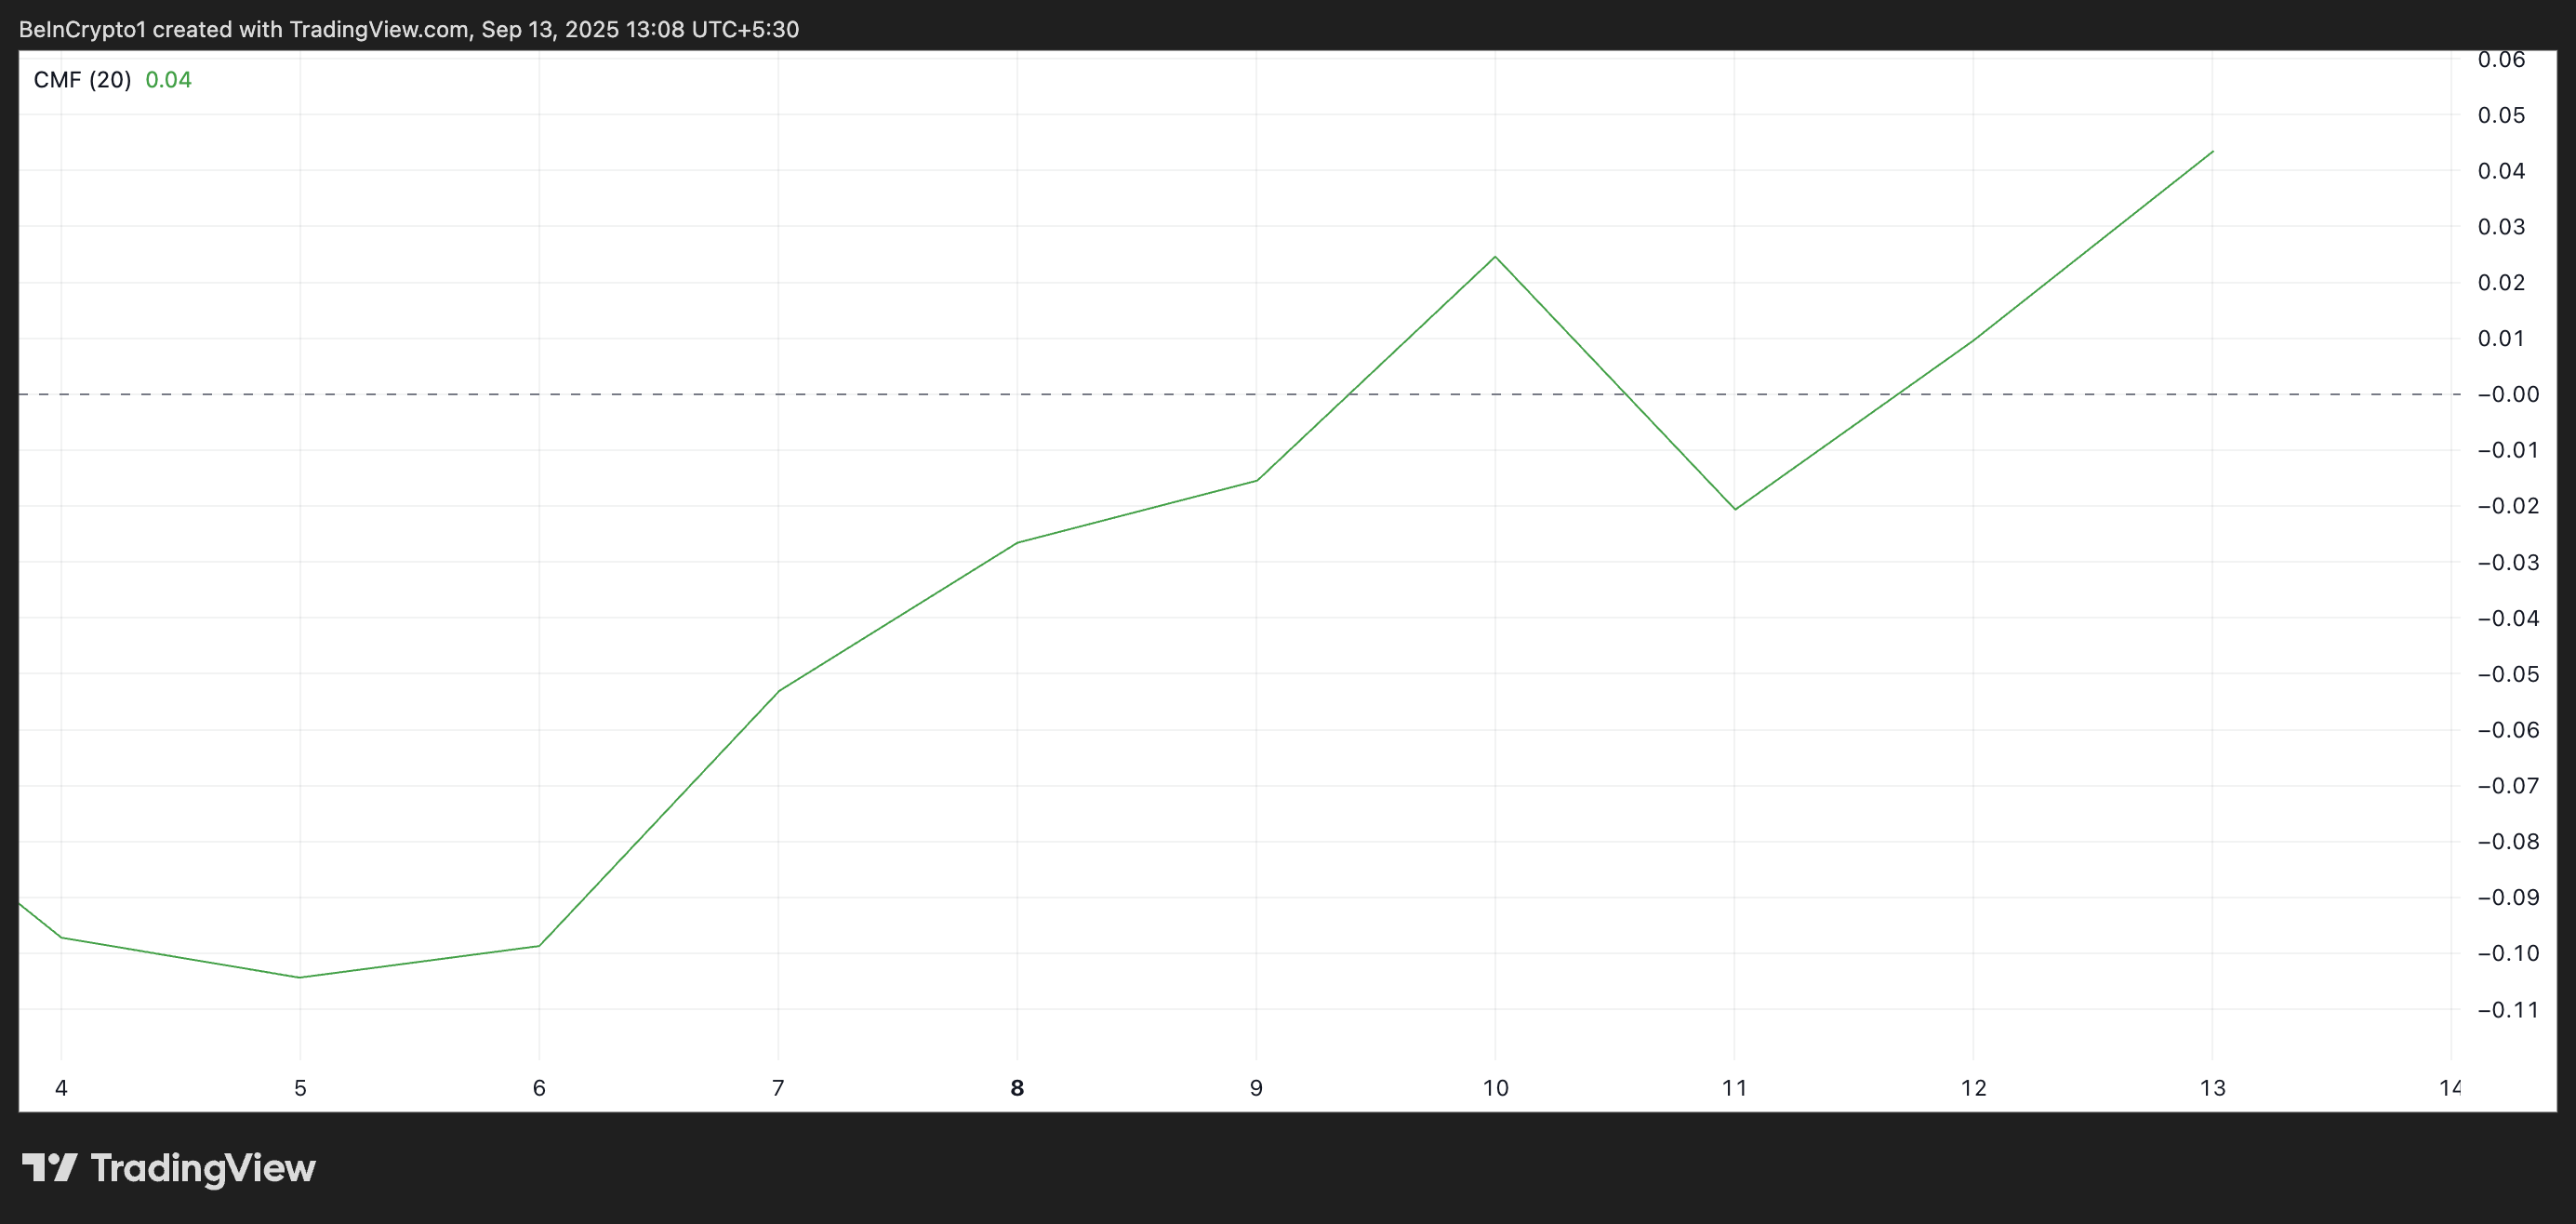
The CMF measures the strength of buying and selling pressure by tracking how capital flows in and out of an asset over a set period.
A CMF value above zero indicates that money is flowing into the token, while values below zero suggest outflows.
In PI’s case, the CMF at 0.04 during a price rally signals that investors are actively accumulating the token rather than selling into strength. This trend suggests the breakout is supported by genuine demand, reducing the likelihood of a false move and strengthening the case for further upside.
In addition, PI’s rally over the past day has pushed its price above its 20-day Exponential Moving Average, which now forms dynamic support below it at $0.3545.
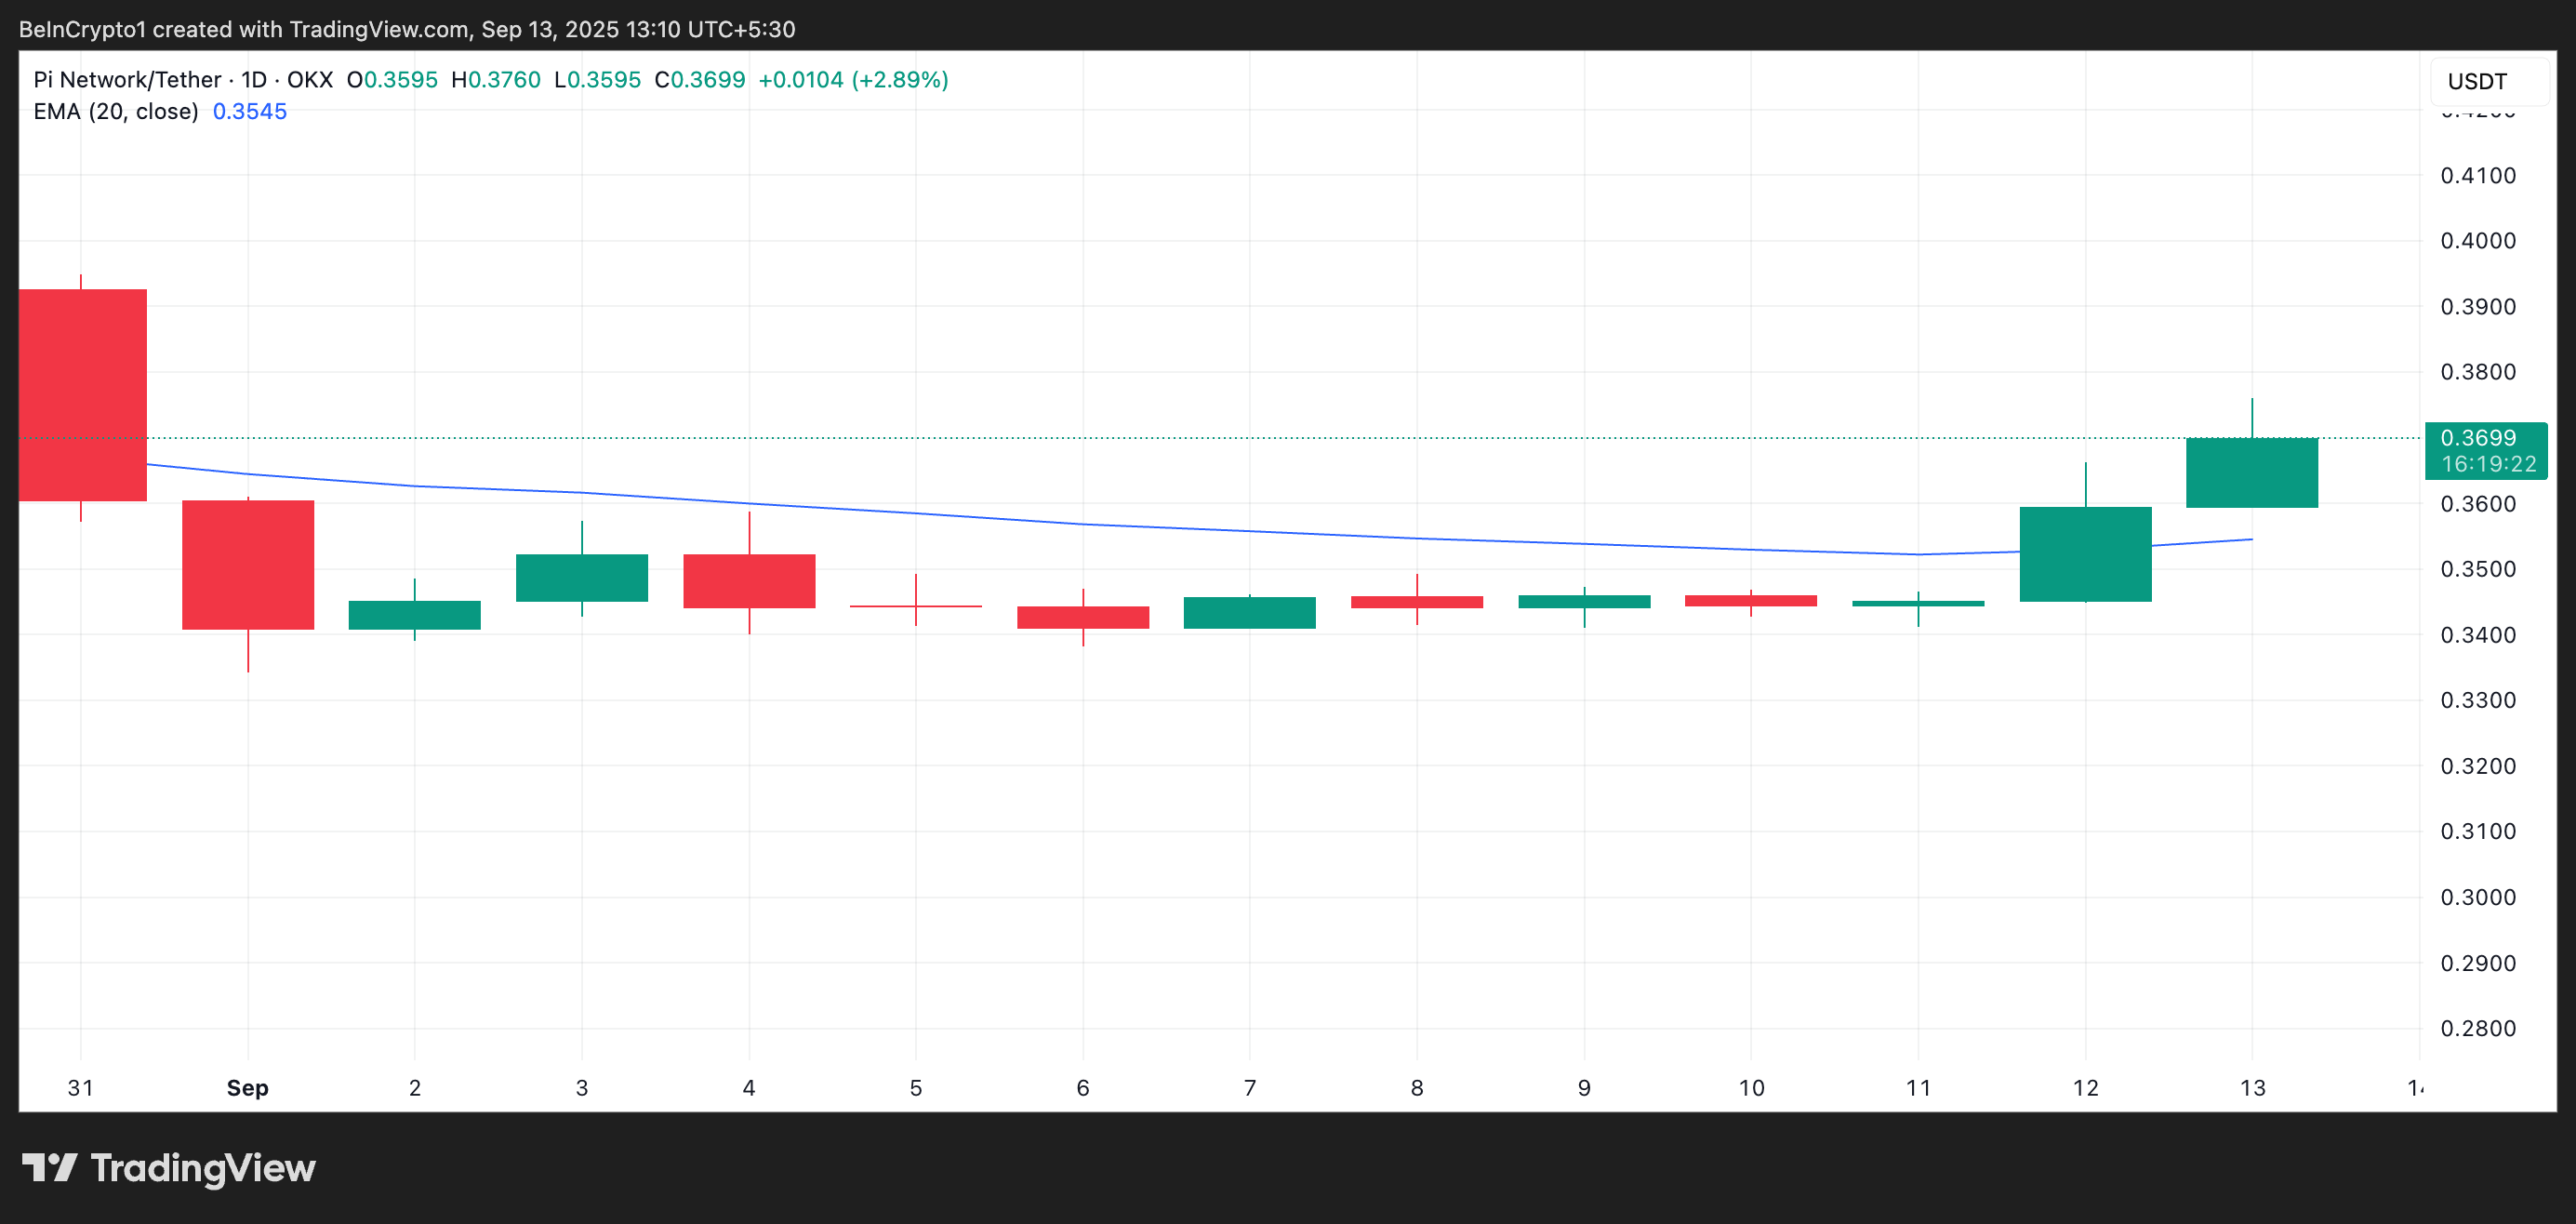
PI 20-Day EMA. Source: TradingView
The 20-day EMA measures an asset’s average price over the past 20 trading days, giving more weight to recent prices.
When an asset trades above its 20-day EMA, it reflects short-term bullish momentum and suggests that recent buying activity is strong enough to keep prices above their average trend.
Holding above this level for PI indicates that bulls are in control and that the EMA could act as a dynamic support floor on potential pullbacks. It could also provide a base for the token to sustain its upward trajectory.
PI Eyes $0.39 Breakout as Bulls Test Market Strength
If demand climbs, PI could attempt a breach of its next major resistance at $0.3903. A break above this barrier could set the stage for a rally toward $0.4661.
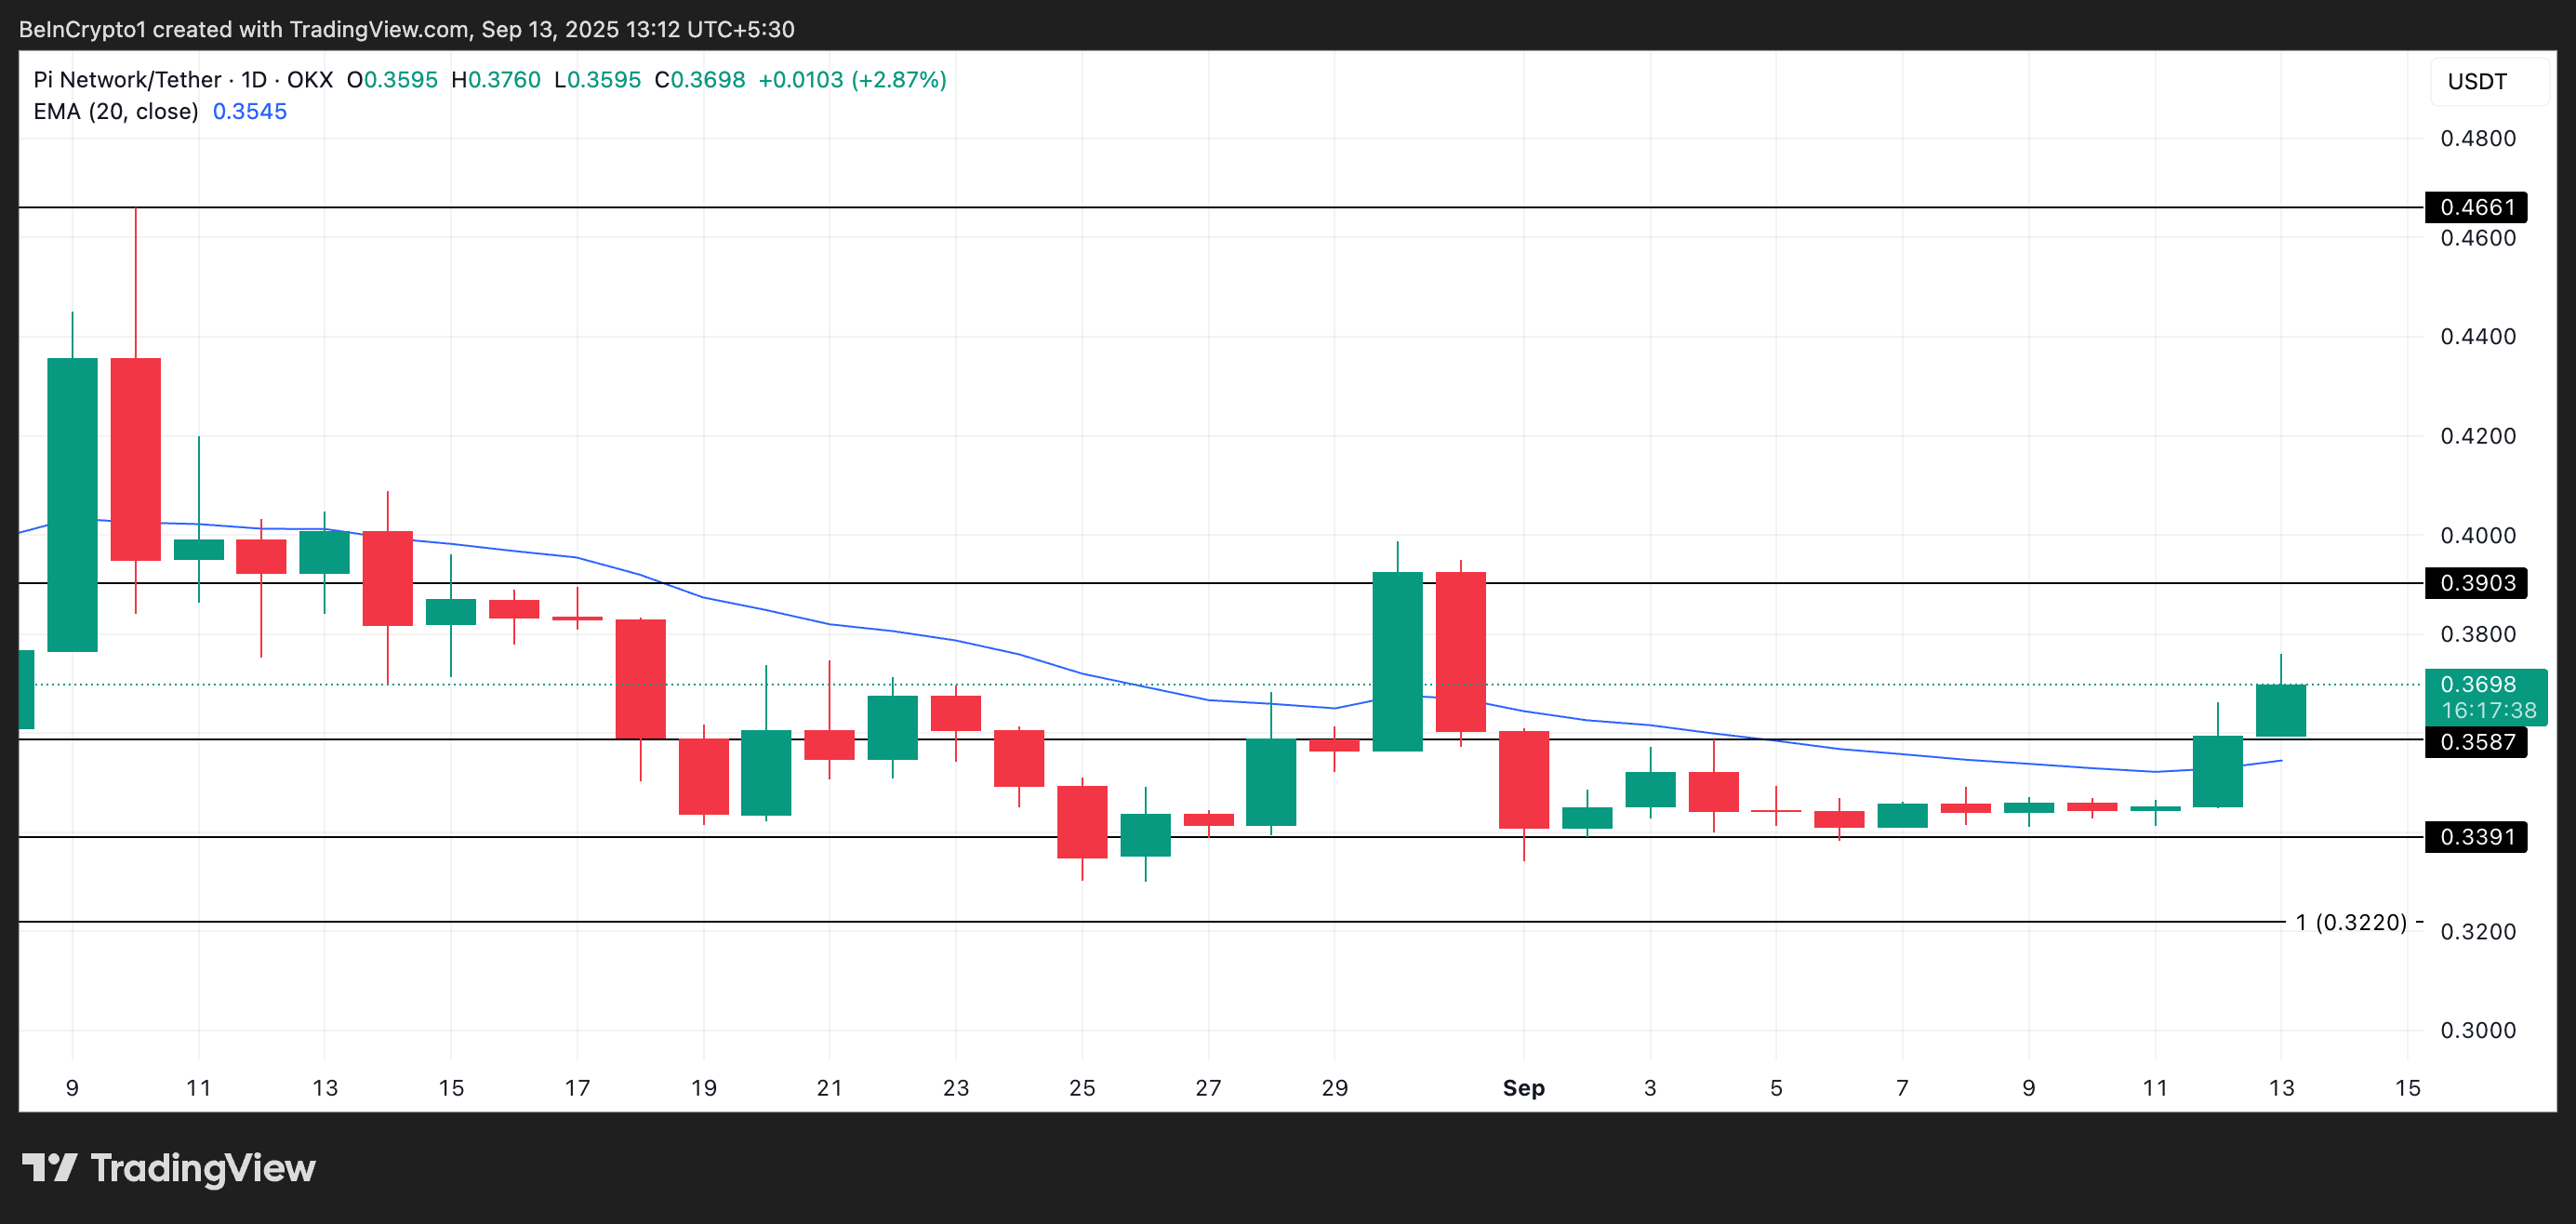
However, a failed retest of the breakout line could cause PI to return to its sideways pattern. If selloffs worsen, it could even break below the support formed by its 20-day EMA and plummet toward $0.3391.
