Trusted

Pi Network (PI) Sinks 10% in a Week, Bears Eye All-Time Low

1 min
Updated by Mohammad Shahid
Join our Trading Community on Telegram

In Brief

  • Pi Network's PI token has dropped 10% over the past week, despite a broader market recovery, showing continued bearish pressure.
  • Technical indicators, including the RSI, OBV, and CMF, signal weakening demand and growing sell-side pressure.
  • With current trends, PI could revisit its all-time low of $0.40 unless a bullish reversal pushes it towards $1.01.
  • promo

Pi Network plunged by double digits over the past week, even as the broader crypto market shows signs of recovery. The altcoin’s market cap dropped to $4.1 billion, as PI continues to see intense selling pressure.

With bearish pressure intensifying, the token could soon revisit its all-time low near $0.40.

PI Risks Deeper Drop

Despite some strength across the broader market, investor sentiment toward PI remains weak, with technical indicators suggesting that its price decline could continue.

The Relative Strength Index (RSI), a key momentum indicator that tracks an asset’s overbought and oversold market conditions, continues to drop, indicating falling demand and growing selling pressure.

PI RSI.
PI RSI. Source: TradingView

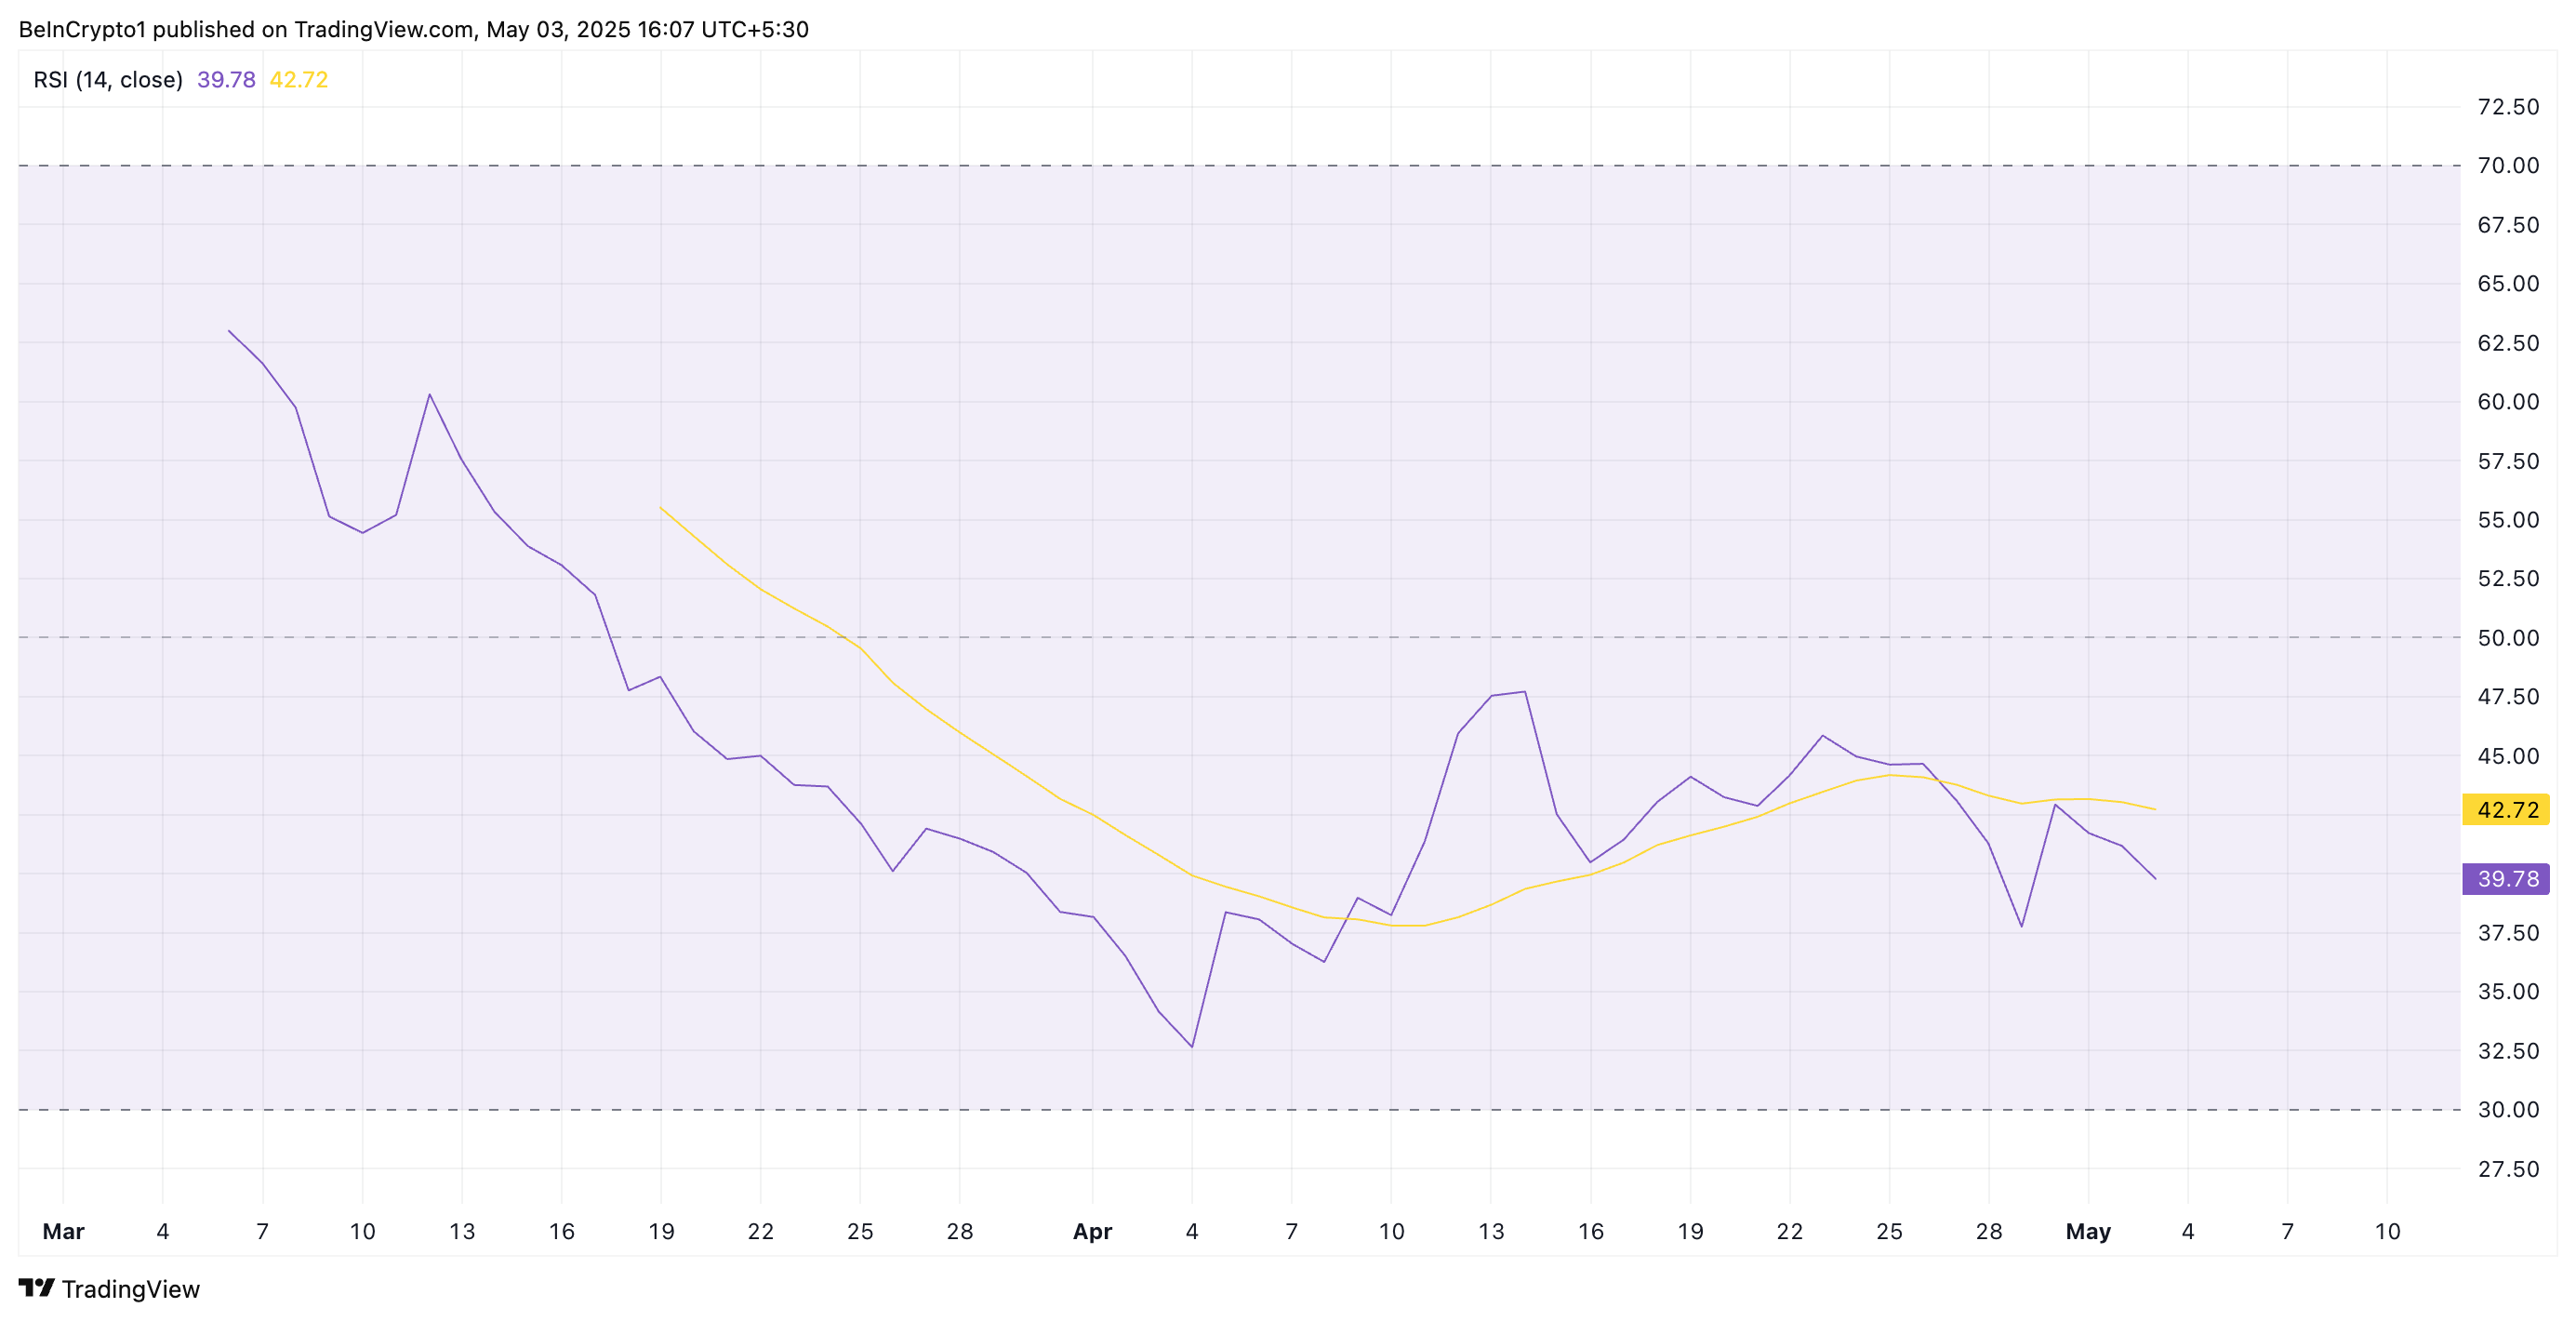
At press time, PI’s RSI is in a downtrend at 39.78. This RSI reading indicates weakening momentum and positions the token just above oversold territory, suggesting continued selling pressure could trigger further losses.

Furthermore, Pi Network’s on-balance volume (OBV) has also decreased, pointing to declining accumulation and reduced buyer interest. This indicator is at -1.26 billion at press time, falling by 15% in the past week.

PI OBV.
PI OBV. Source: TradingView

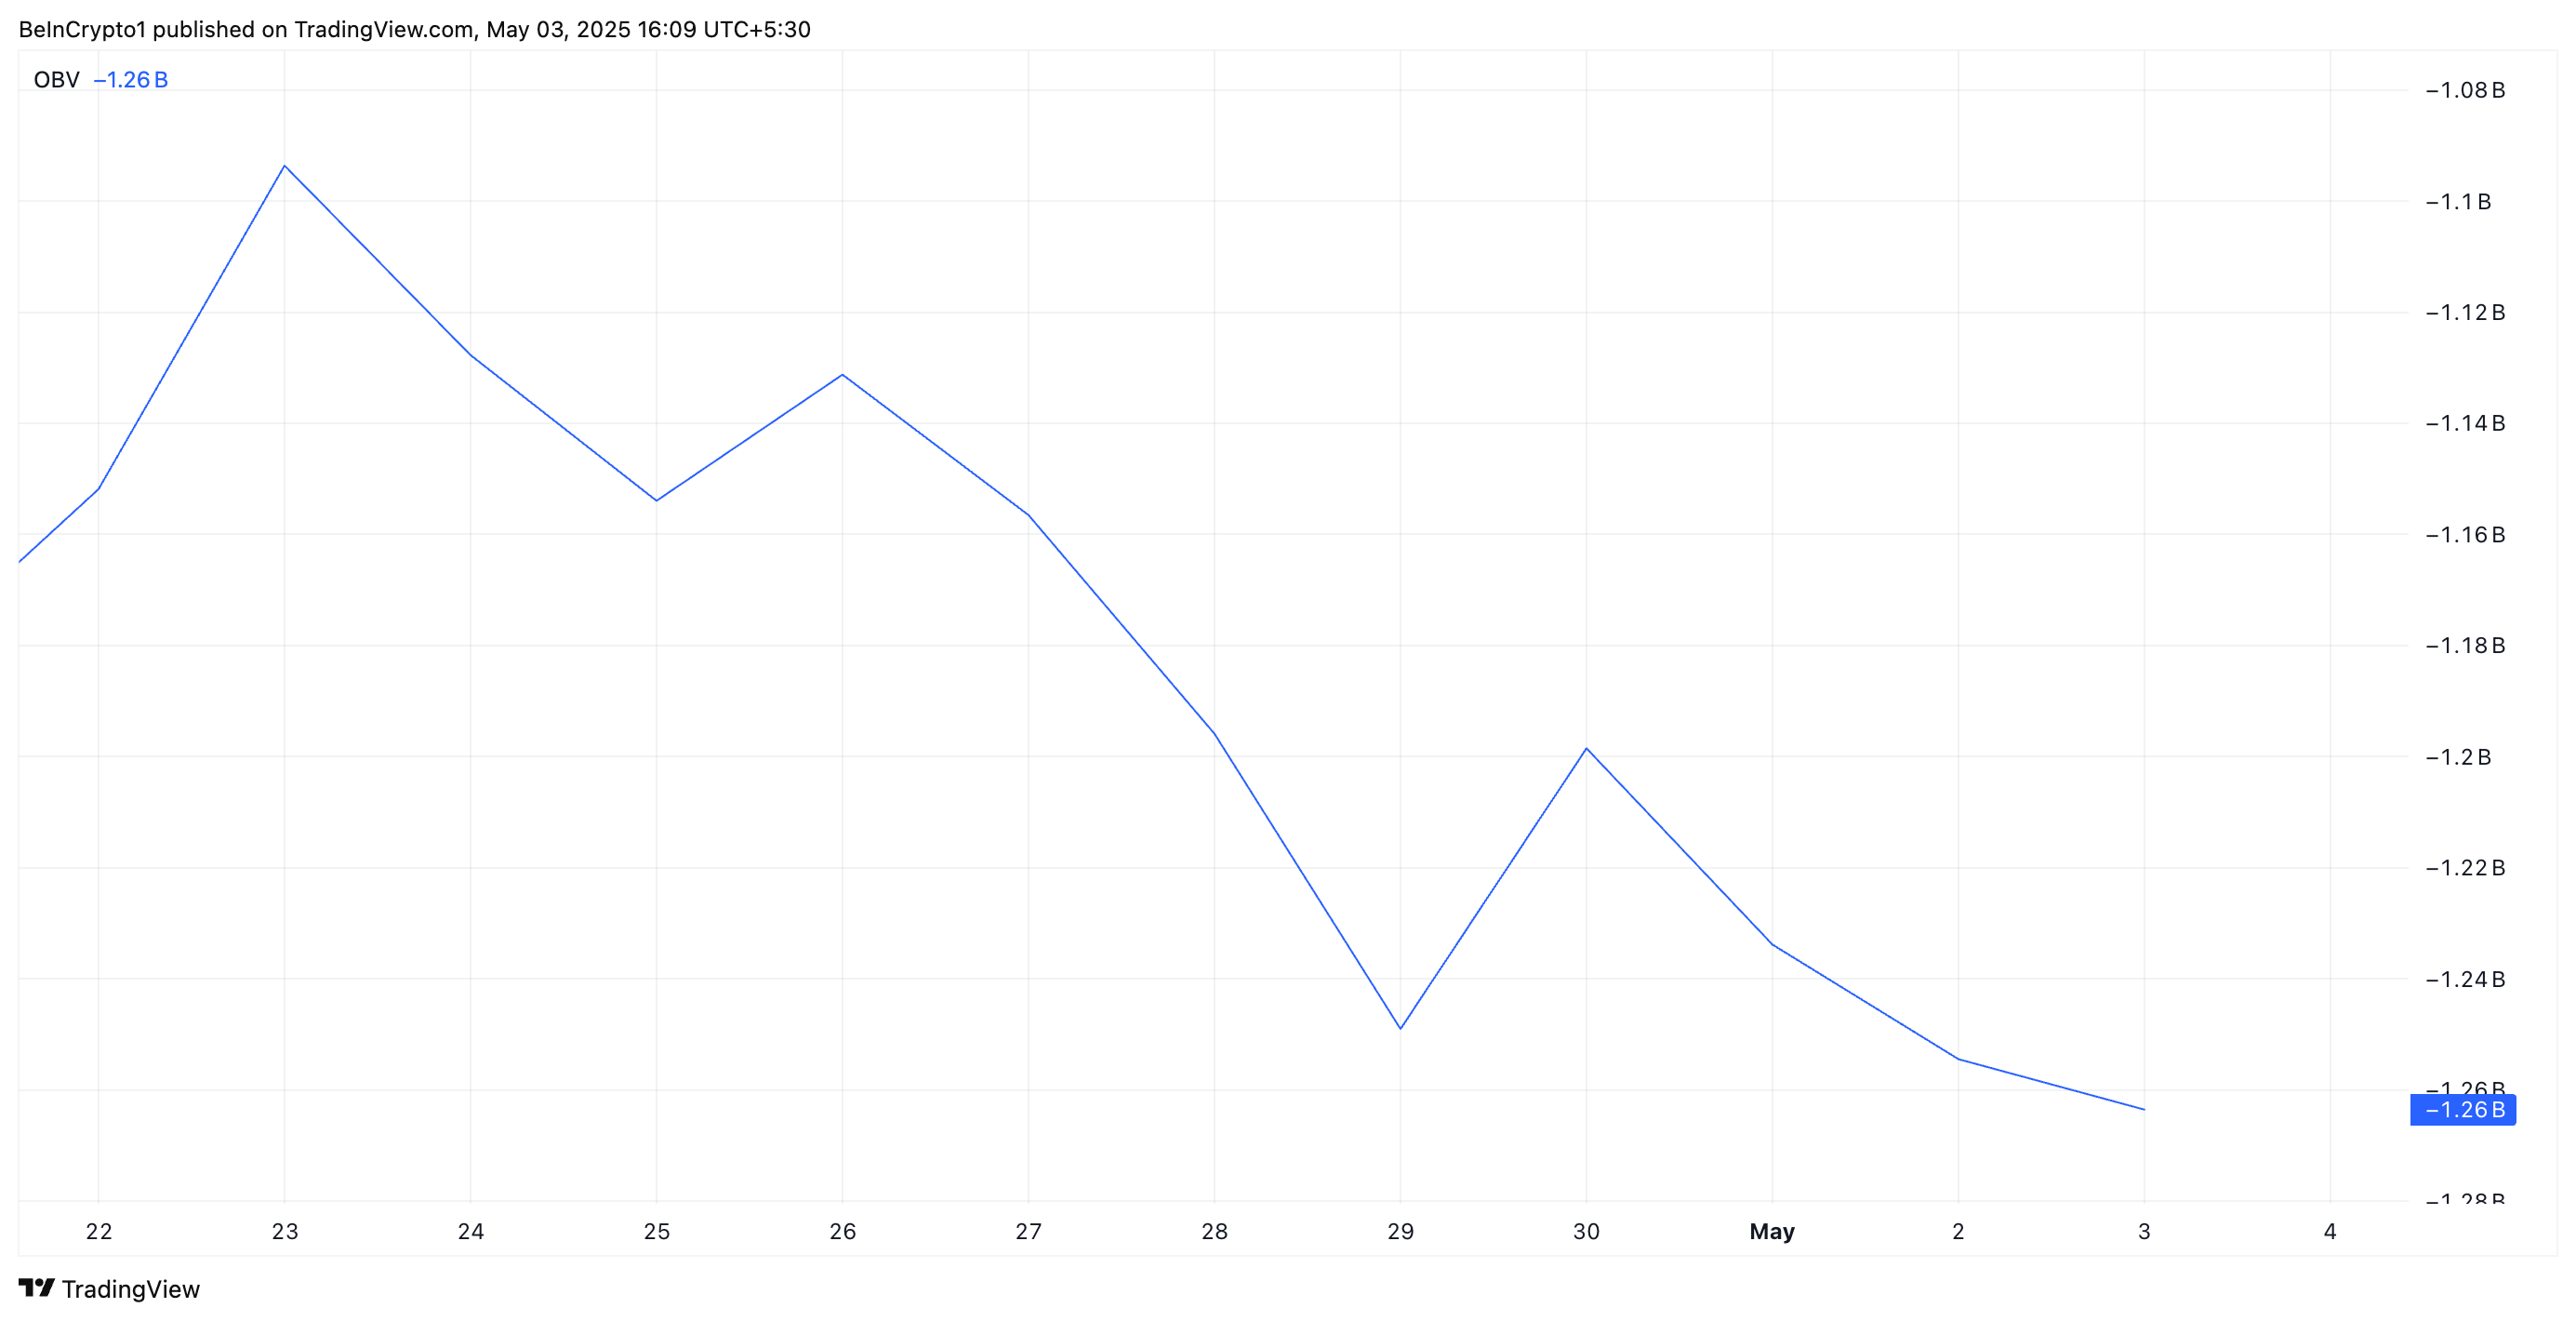
The OBV measures buying and selling pressure by tracking volume flow relative to price movements. When OBV falls like this, more volume is tied to selling than buying. This indicates weakening investor confidence and potential for further price declines.

PI Token Risks Retesting All-Time Low

PI’s plummeting Chaikin Money Flow (CMF) supports the bearish outlook above. At press time, this indicator, which tracks how money flows into and out of an asset, is below the zero line at -0.15.

This negative reading reflects the strength of the sell-side pressure in the PI spot markets. If this trend persists, PI could revisit its all-time low of $0.40.

PI Price Analysis.
PI Price Analysis. Source: TradingView

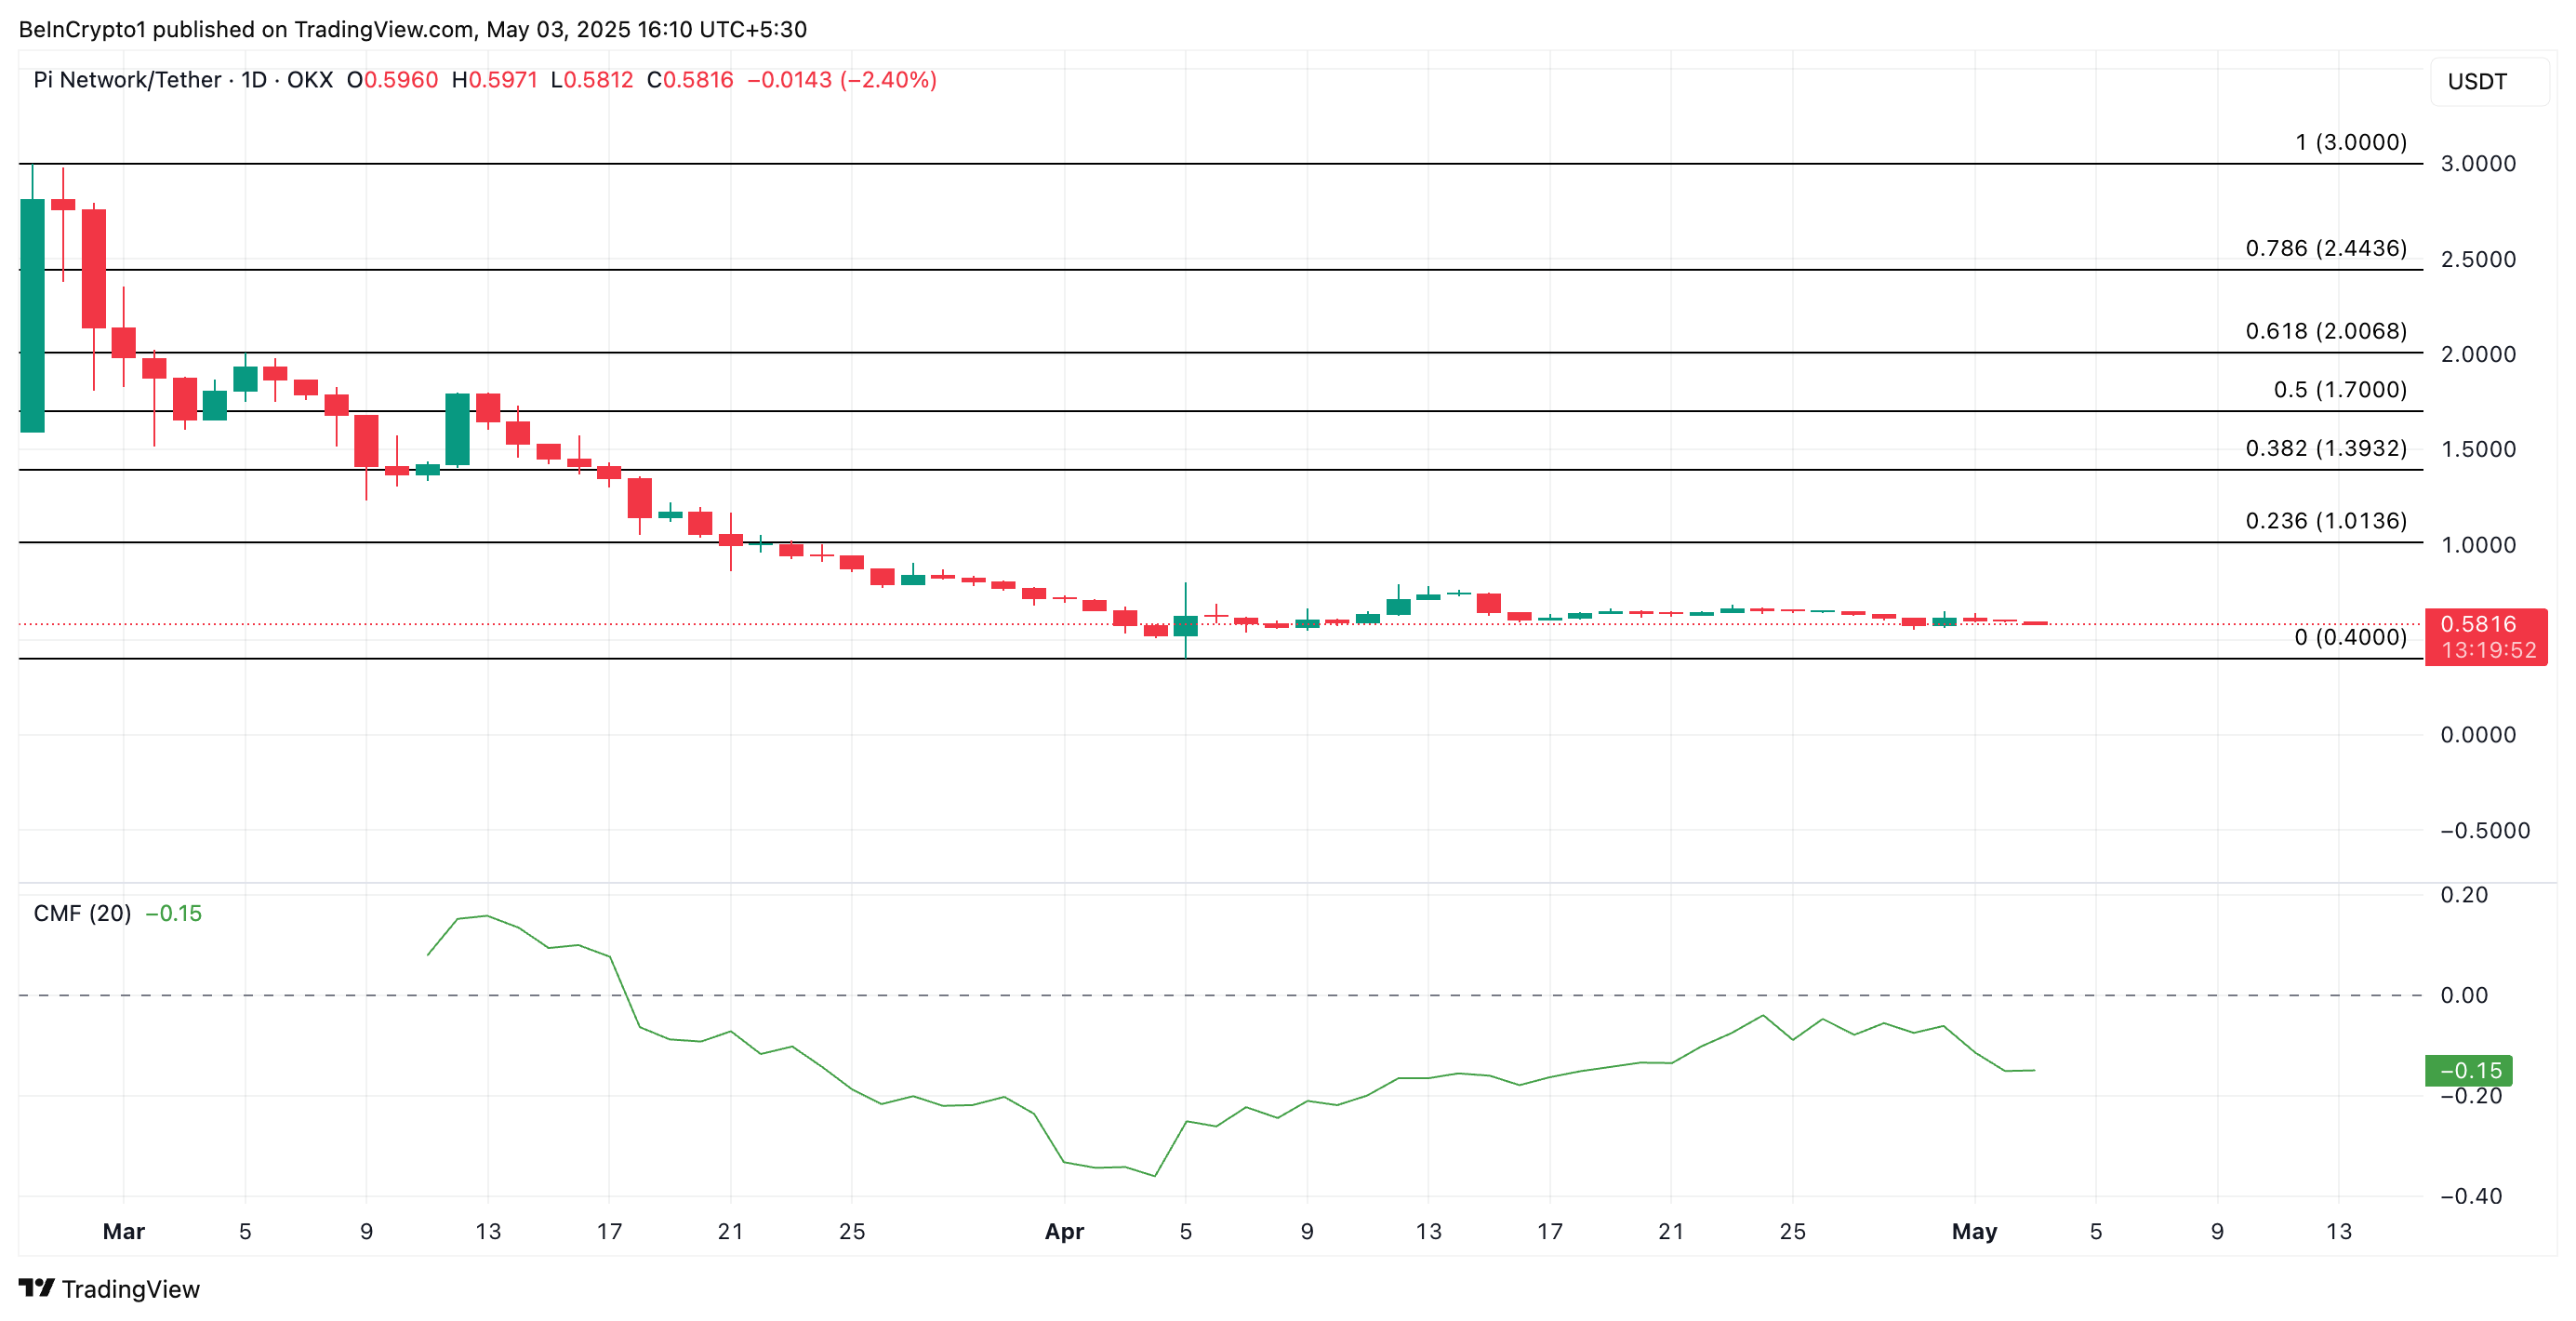
However, a bullish reversal in the current trend could propel PI’s price to $1.01.

Top crypto platforms in the US
Uphold Uphold Explore
eToro eToro Explore
Plus500 Plus500 Explore
Coinbase Coinbase Explore
Moonacy Moonacy Explore
Top crypto platforms in the US
Uphold Uphold Explore
eToro eToro Explore
Plus500 Plus500 Explore
Coinbase Coinbase Explore
Moonacy Moonacy Explore
Top crypto platforms in the US
Uphold Uphold
eToro eToro
Plus500 Plus500
Coinbase Coinbase
Moonacy Moonacy

Disclaimer

In line with the Trust Project guidelines, this price analysis article is for informational purposes only and should not be considered financial or investment advice. BeInCrypto is committed to accurate, unbiased reporting, but market conditions are subject to change without notice. Always conduct your own research and consult with a professional before making any financial decisions. Please note that our Terms and ConditionsPrivacy Policy, and Disclaimers have been updated.

Untitled-1.png
Abiodun Oladokun
Abiodun Oladokun is a Technical and On-Chain Analyst at BeInCrypto, where he specializes in market reports on cryptocurrencies from diverse sectors, including decentralized finance (DeFi), real-world assets (RWA), artificial intelligence (AI), decentralized physical infrastructure networks (DePIN), Layer 2s, and meme coins. Previously, he conducted market analysis and technical assessments of various altcoins at AMBCrypto, utilizing on-chain analytics platforms like Messari, Santiment...
READ FULL BIO
Sponsored
Sponsored