Trusted

Pi Network Extends Losing Streak as Buying Pressure Weakens: What’s Next?

2 mins
Updated by Ann Maria Shibu
Join our Trading Community on Telegram

In Brief

  • PI falls 6%, continuing its losing streak as buying pressure weakens and market participation declines significantly.
  • The On-Balance-Volume (OBV) indicator hits an all-time low, signaling increased selling activity and low liquidity for PI.
  • PI faces risk of dropping to $0.62, but a surge in buying could reverse the trend, pushing it toward $1.13.
  • promo

PI has continued its downtrend, slipping 5% in the last 24 hours despite the general market rally recorded over the past day.

The altcoin’s downturn signals weakening buying pressure as traders appear to shift their focus away from PI.

Pi Struggles as Market Participation Declines

Key technical indicators reinforce the bearish outlook for Pi. Its On-Balance-Volume (OBV), which tracks buying and selling pressure, has been steadily falling, indicating a decline in market participation and liquidity.

As of this writing, PI’s OBV sits at an all-time low of -845.93 million, falling by over 2000% since the beginning of March. 

PI OBV
PI OBV. Source: TradingView

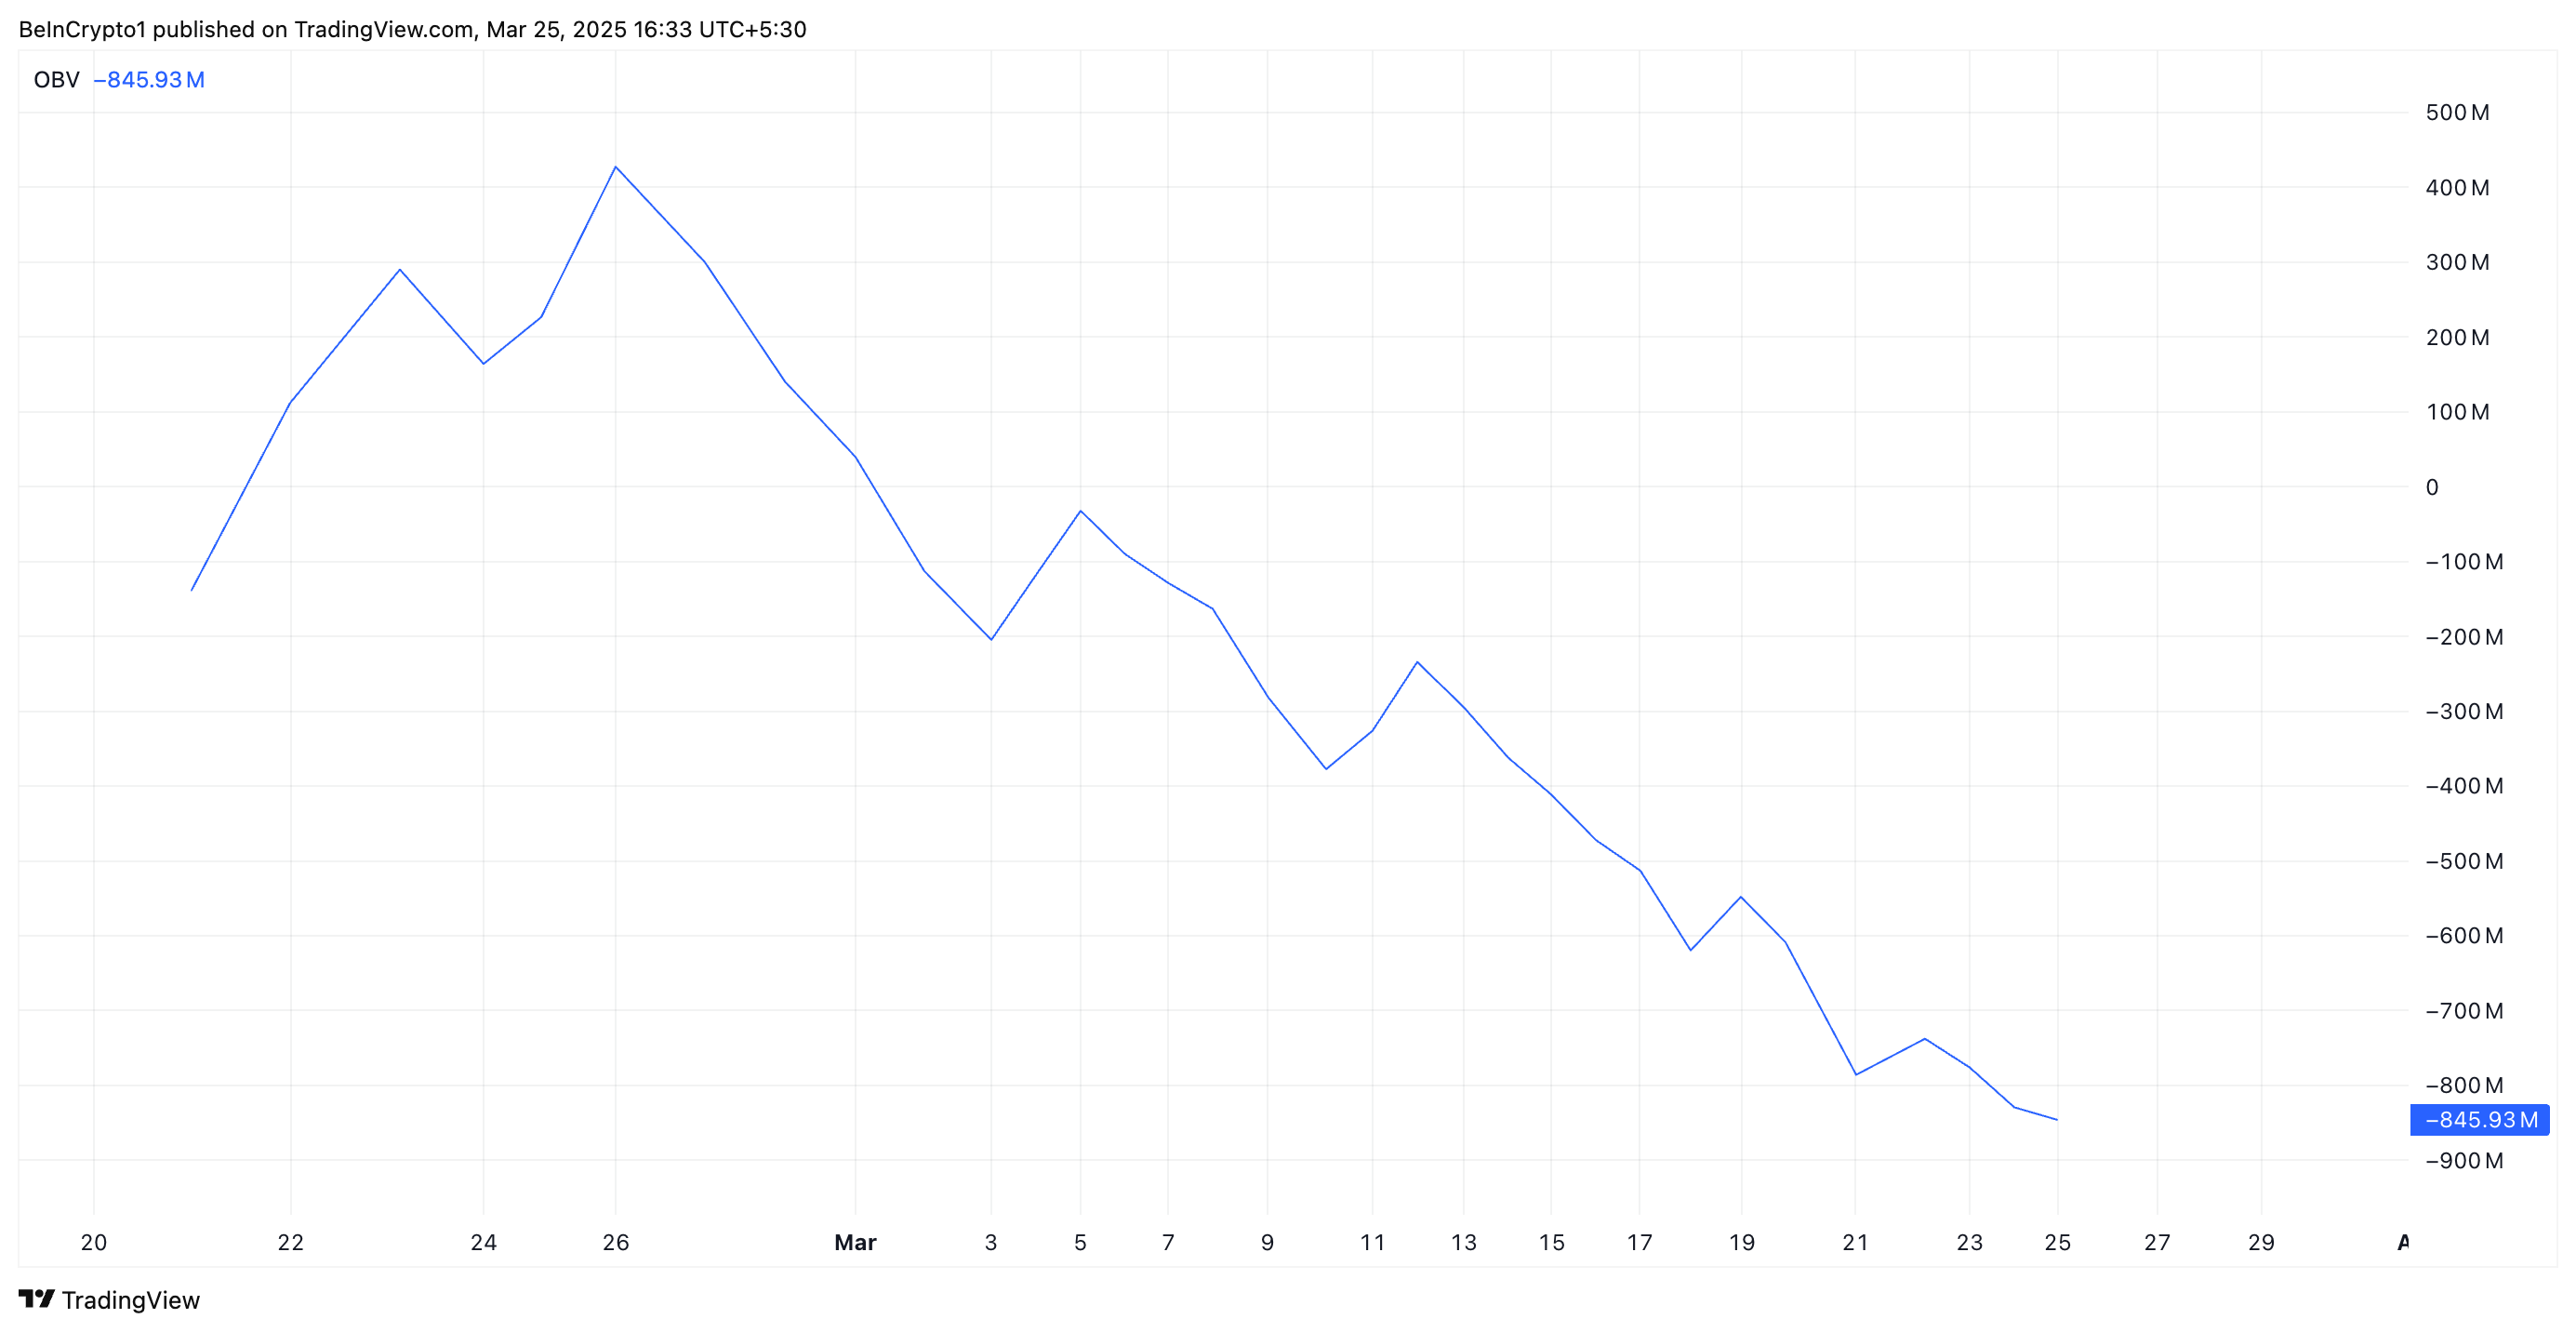
When an asset’s OBV plunges like this, it indicates a decline in buying activity and increasing selloffs. This suggests that more PI traders are offloading the asset than accumulating it, increasing the downward pressure on its price.

Further, PI has remained in a descending parallel channel, a pattern that reflects its downward trend. According to readings from the PI/USD one-day chart, PI has traded within this bearish pattern since reaching an all-time high of $3 on February 26. 

PI Descending Parallel Channel.
PI Descending Parallel Channel. Source: TradingView

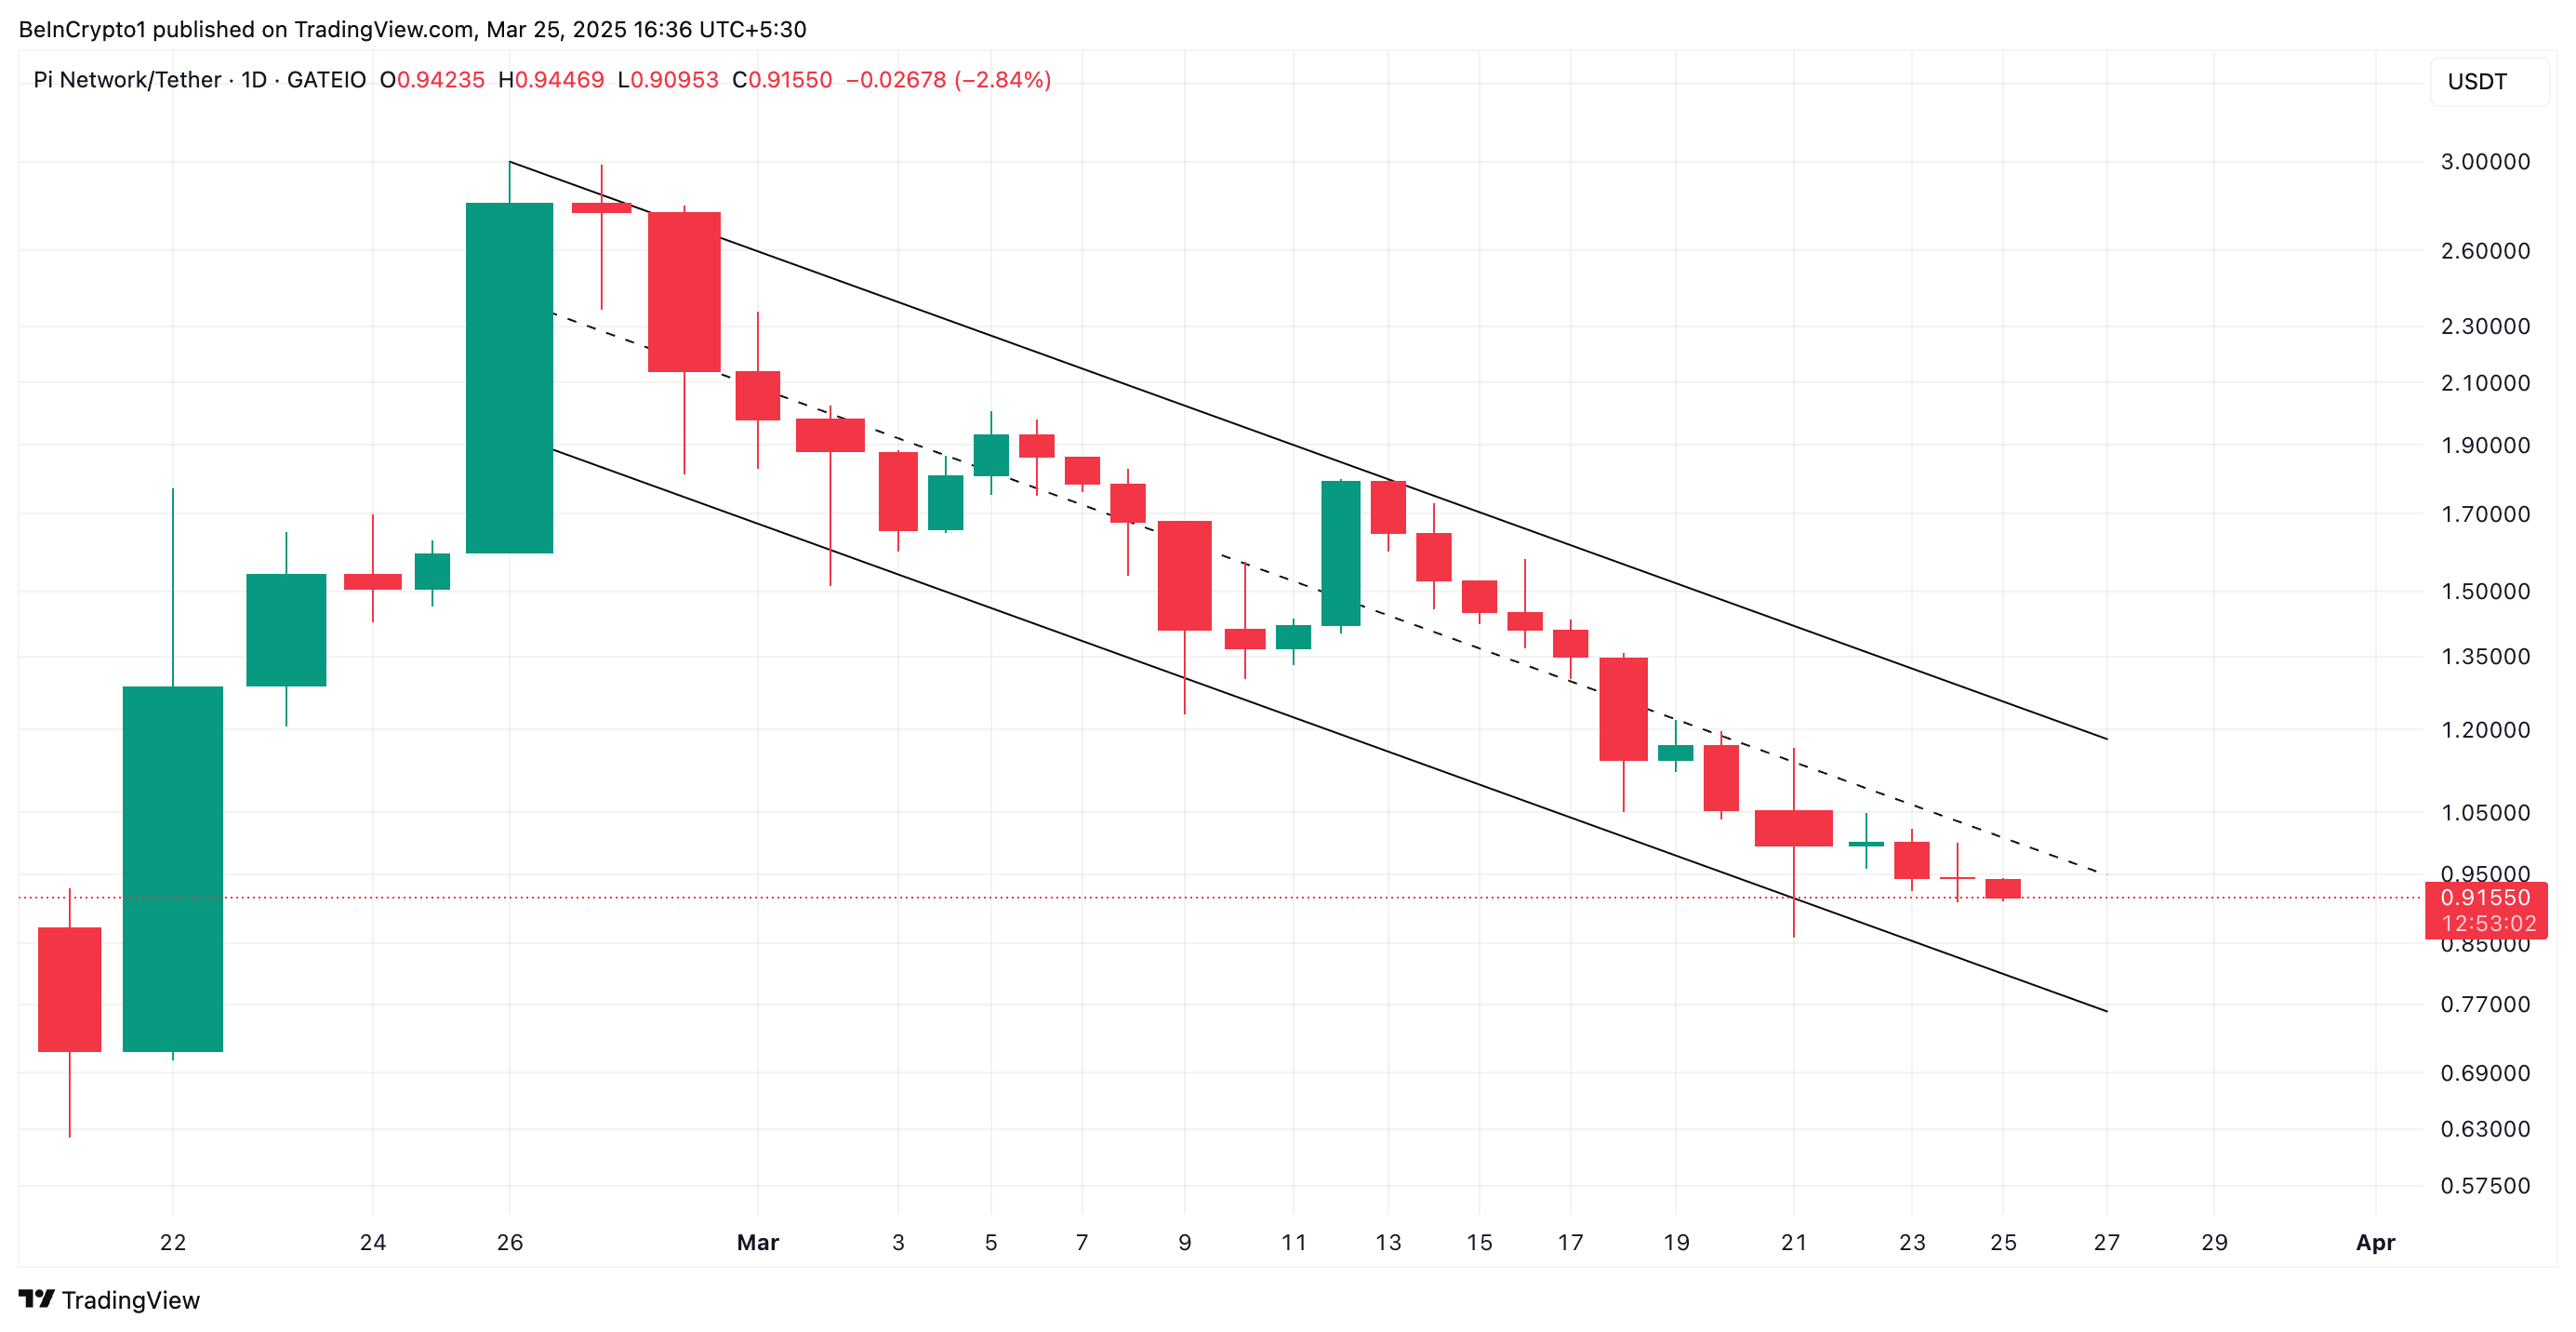
A descending parallel channel is formed when an asset’s price moves between two downward-sloping parallel trendlines. This structure indicates a consistent pattern of lower highs and lower lows, suggesting a sustained bearish trend. Here, token sellers maintain control and prevent significant upward momentum. 

The pattern hints that PI’s price may continue to decline until it breaks above the channel or finds strong support.

Pi Risks Further Decline as Bears Attempt to Drag Price Below $0.62

PI’s strengthening selling pressure puts it at risk of breaking below the descending parallel channel. If this happens, the token’s downtrend gains momentum, pushing its price to $0.62.

PI Price Analysis
PI Price Analysis. Source: TradingView

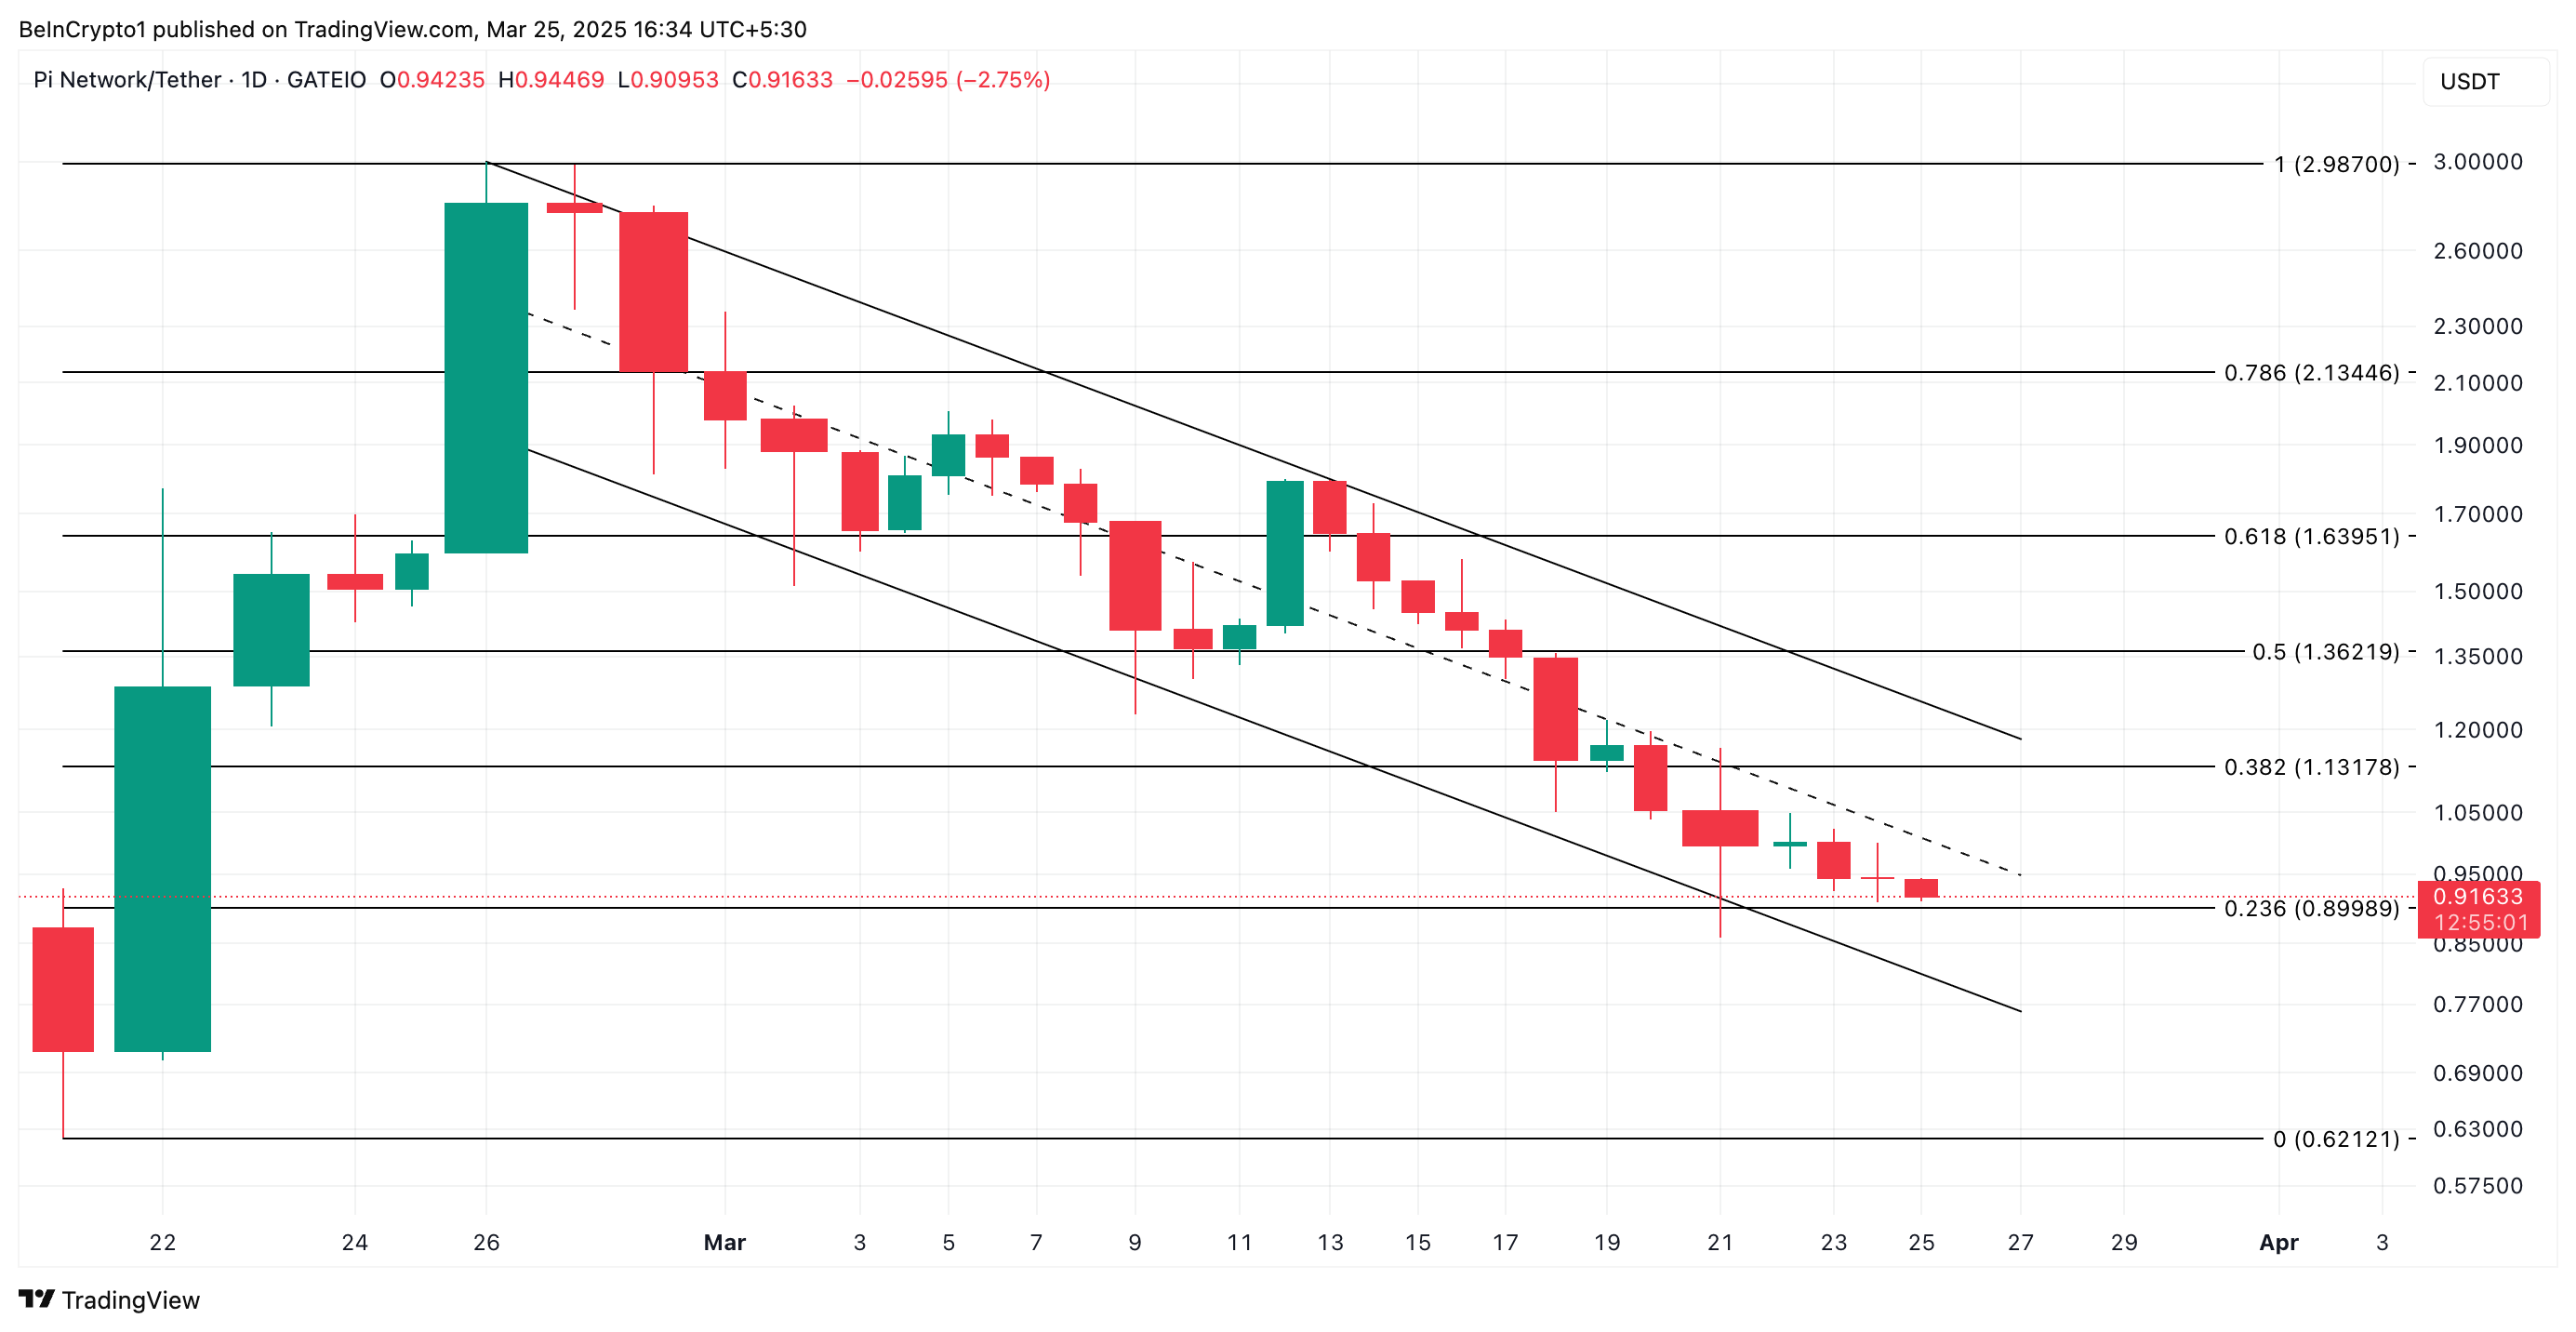
However, if the bulls regain dominance and buying activity spikes, PI could reverse its current trend and rally toward $1.13.

Best crypto platforms in Europe
YouHodler YouHodler Explore
eToro eToro Explore
Wirex Wirex Explore
Best crypto platforms in Europe
YouHodler YouHodler Explore
eToro eToro Explore
Wirex Wirex Explore
Best crypto platforms in Europe
OKX OKX
YouHodler YouHodler
eToro eToro
Wirex Wirex
MEXC MEXC

Disclaimer

In line with the Trust Project guidelines, this price analysis article is for informational purposes only and should not be considered financial or investment advice. BeInCrypto is committed to accurate, unbiased reporting, but market conditions are subject to change without notice. Always conduct your own research and consult with a professional before making any financial decisions. Please note that our Terms and ConditionsPrivacy Policy, and Disclaimers have been updated.

Untitled-1.png
Abiodun Oladokun
Abiodun Oladokun is a Technical and On-Chain Analyst at BeInCrypto, where he specializes in market reports on cryptocurrencies from diverse sectors, including decentralized finance (DeFi), real-world assets (RWA), artificial intelligence (AI), decentralized physical infrastructure networks (DePIN), Layer 2s, and meme coins. Previously, he conducted market analysis and technical assessments of various altcoins at AMBCrypto, utilizing on-chain analytics platforms like Messari, Santiment...
READ FULL BIO
Sponsored
Sponsored