


Bitcoin (BTC) has been decreasing since April 24 but bounced strongly off of support on May 19.
While the exact wave count is not certain, both the bullish and bearish counts suggest a short-term increase will transpire.
Wave four
Bitcoin has been falling since April 14, when it reached an all-time high price of $64,895. By May 26, it has fallen to a 5-month low of $30,000.
Both the bearish and bullish counts suggest that BTC is currently in wave four of a bullish impulse (red). This pattern has been in place since December 2018. Long-term indicators provide very similar readings in waves two and four.
However, the bearish count indicates that another drop towards at least $27,195 will occur, potentially completing a fourth wave pullback. On the other hand, the bullish count (white) suggests that wave four will develop into a symmetrical triangle.
For the previous wave count analysis, click here.
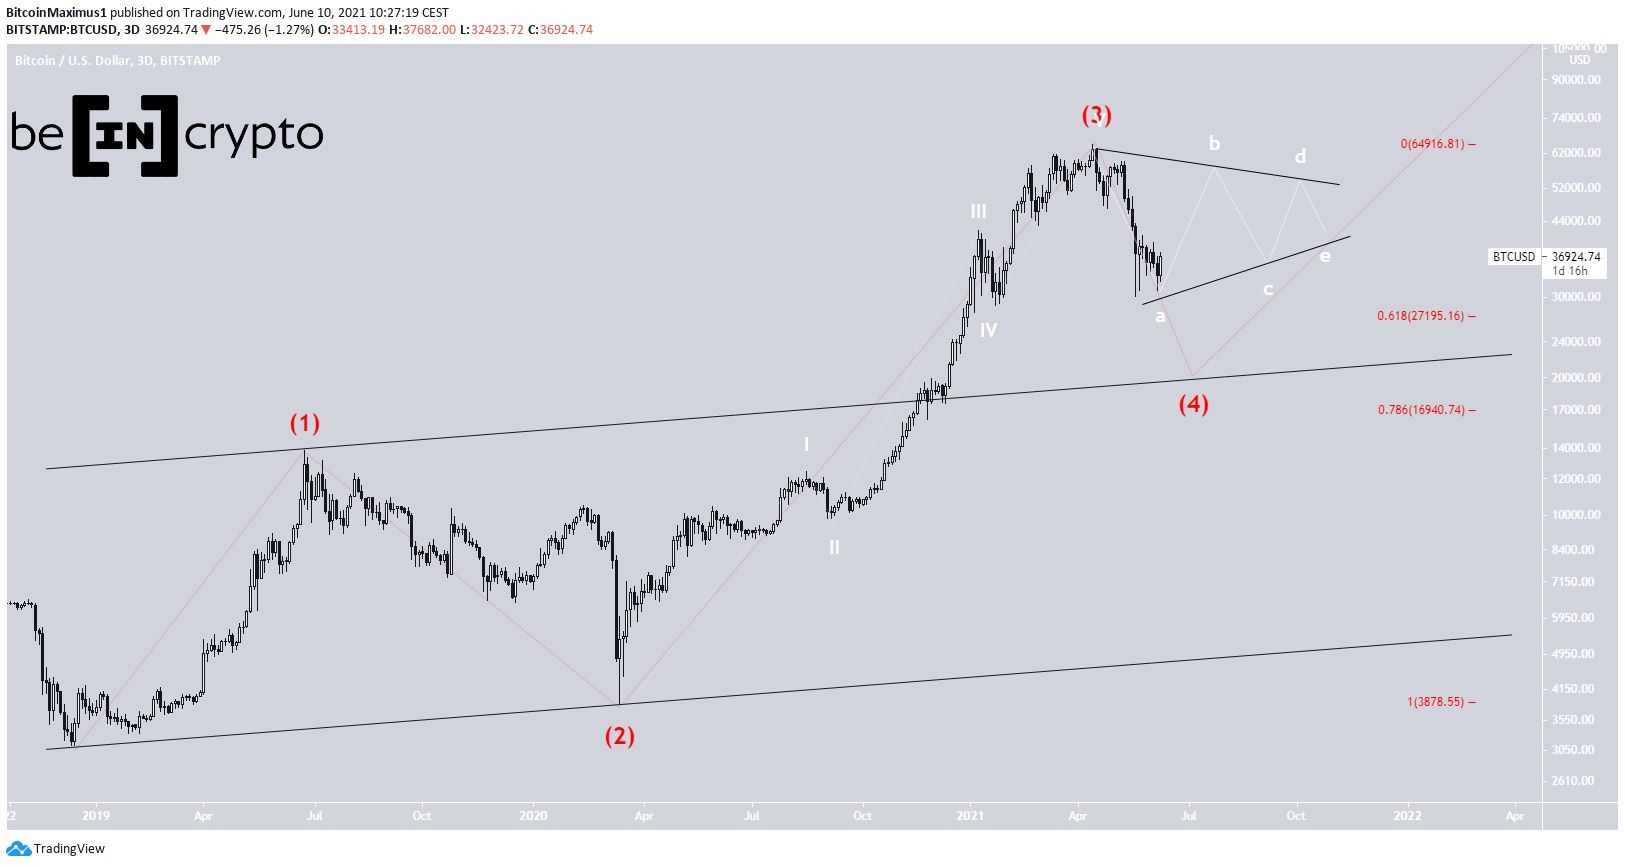
Bearish BTC count
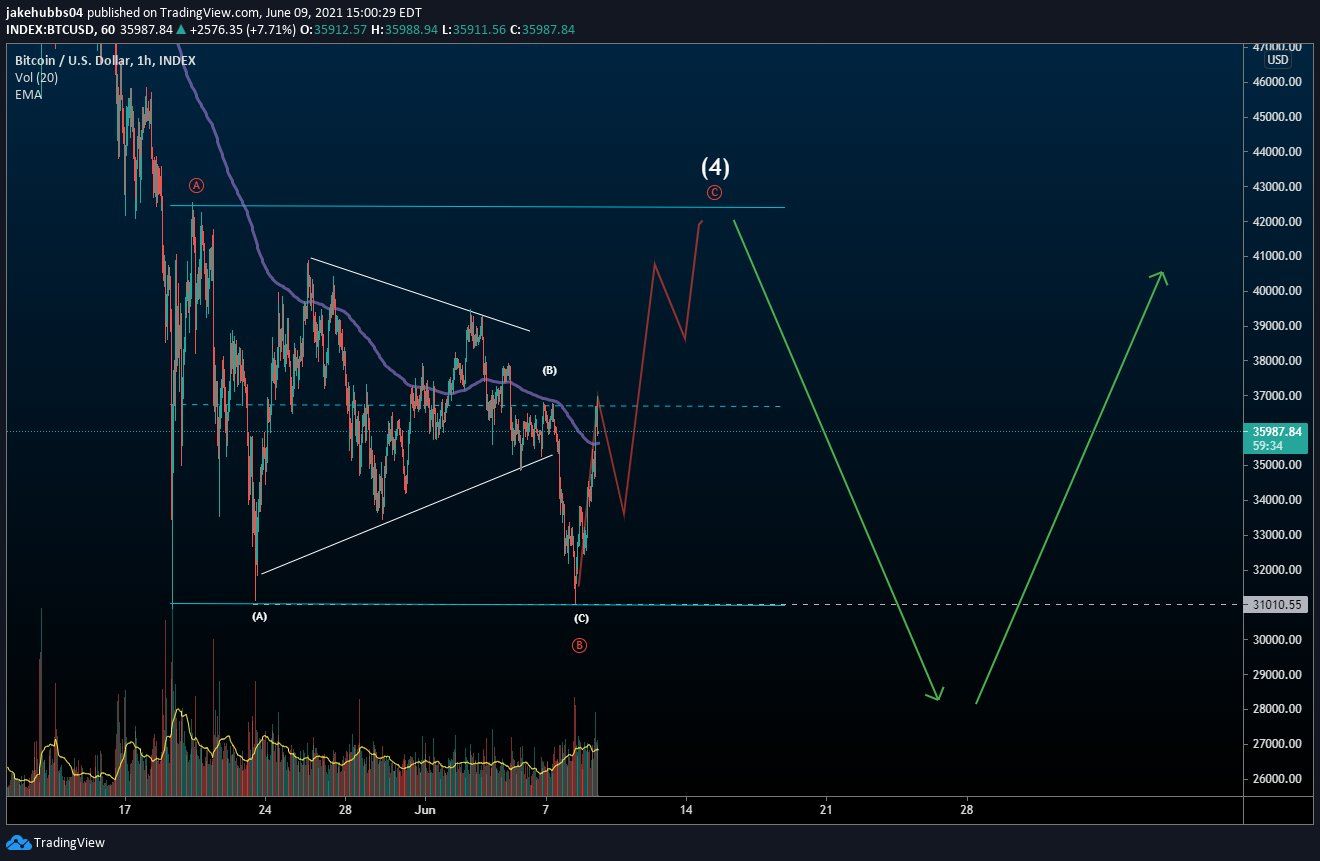
Cryptocurrency trader @TheTradingHubb outlined a potential wave count for BTC, which shows the price rising towards the mid $40,000s.
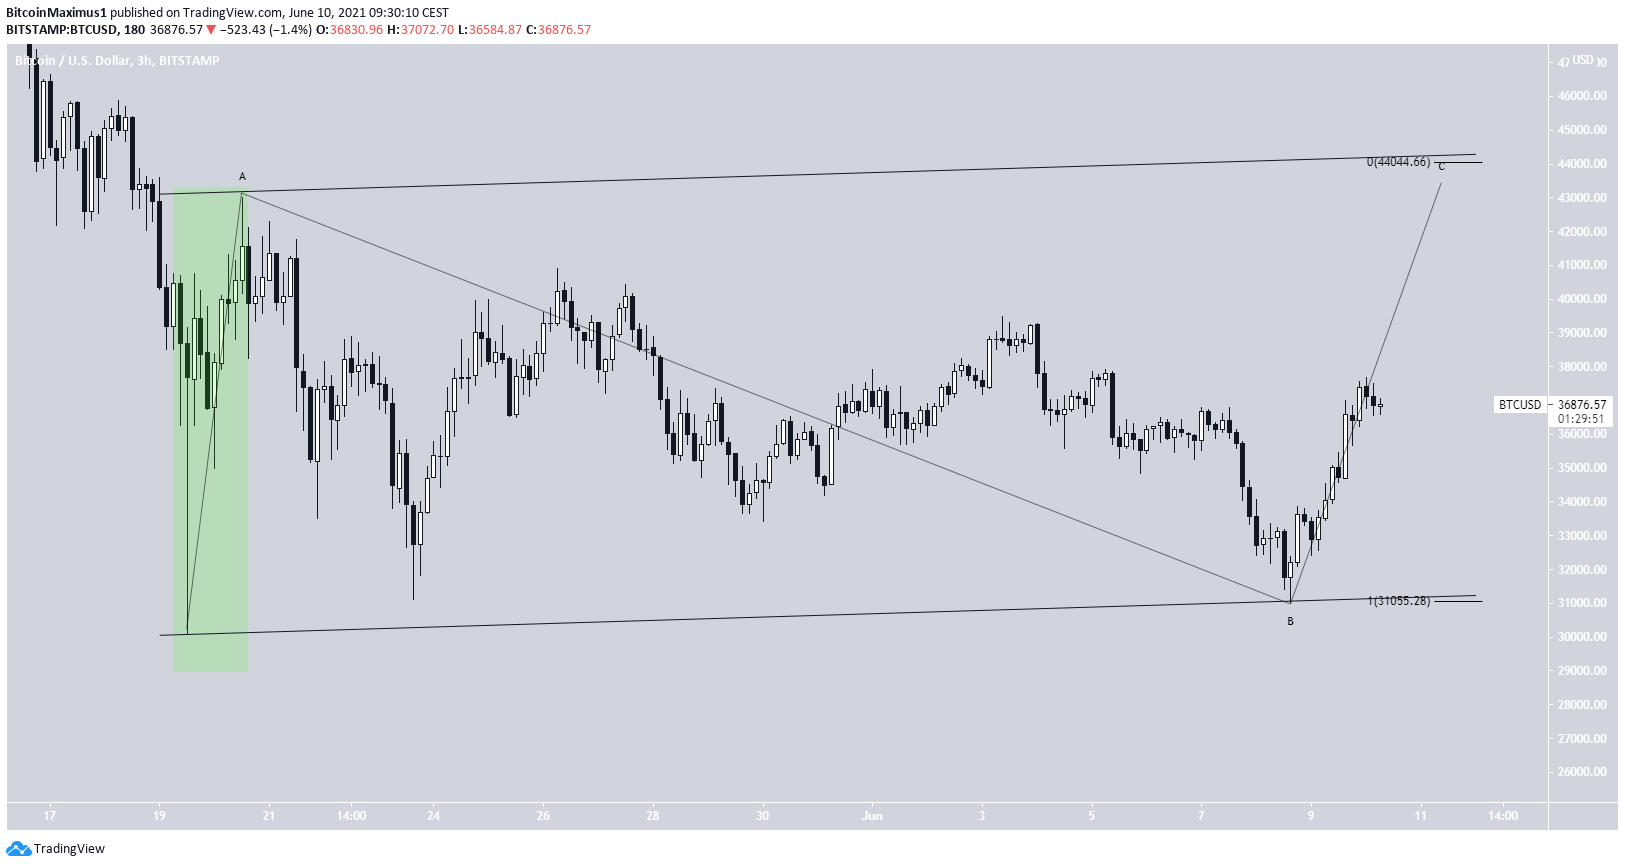
Since the original move following the May 19 lows is a three-wave structure (highlighted in green), it’s likely to be wave A.
Therefore, the entire movement could be a flat correction, which would eventually take BTC to $44,050. This is the resistance line of an ascending parallel channel and would give waves A:C a 1:1 ratio.
In the long term, the movement would complete wave four (orange) and a fourth wave pullback. The $44,000 region is also the 0.5 Fib retracement resistance level and the middle of the descending parallel channel. Because of this, it’s likely to act as resistance.
An increase above the bottom of wave 1 (red line) at $47,000 would invalidate this count and indicate that the bullish count is in play.
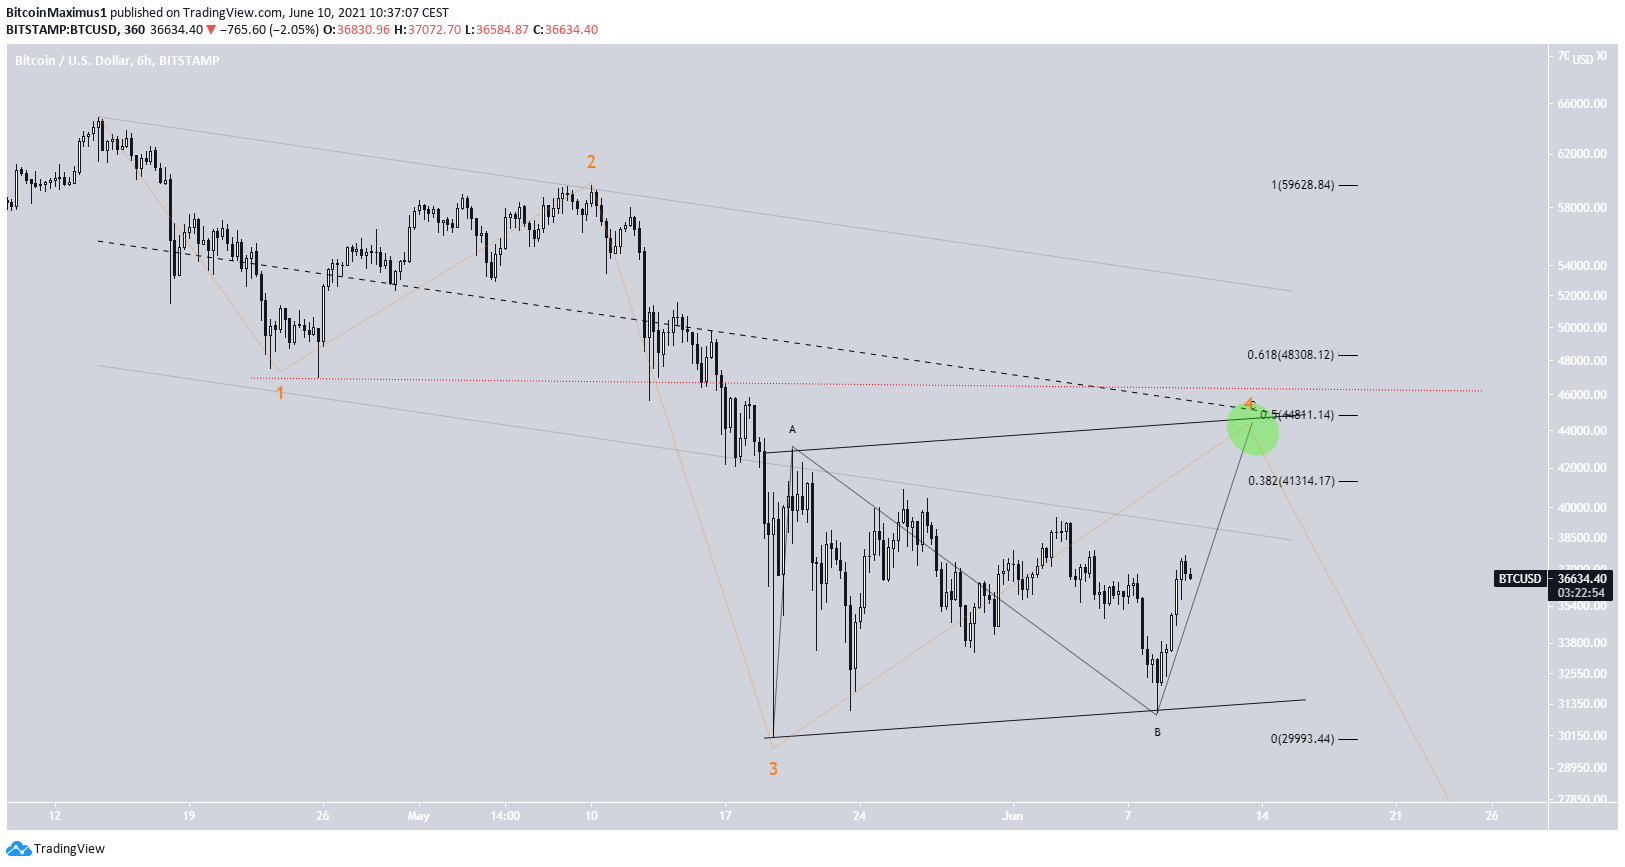
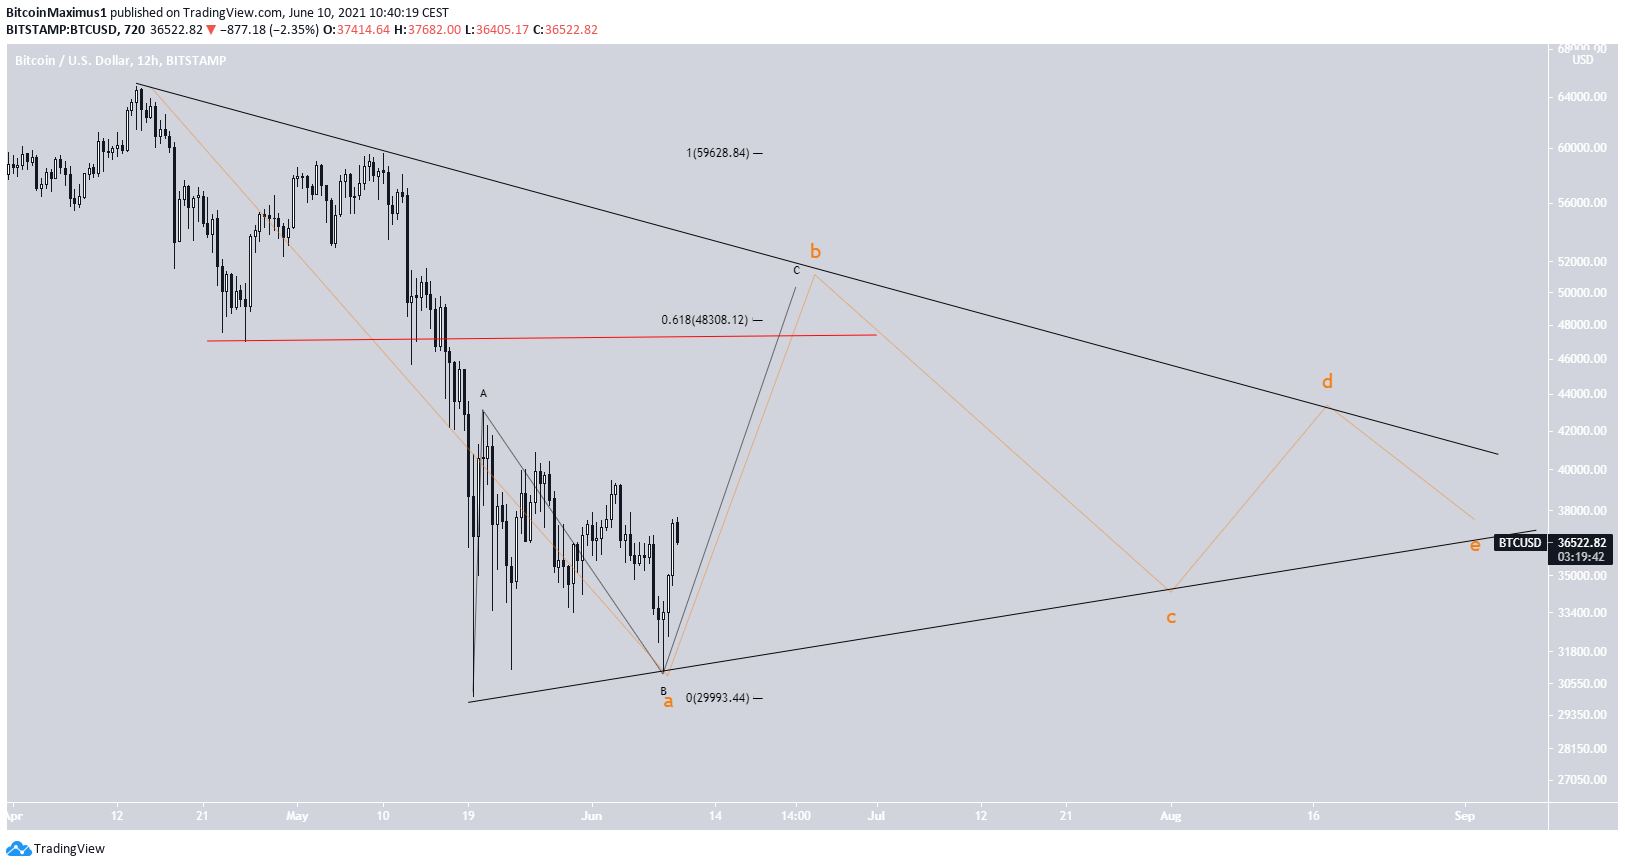
Bullish BTC count
Interestingly, the bullish count is also following an A-B-C structure. However, in this case, it would break out above the $47,000 line and move above $48,000.
This would create the B wave of a long-term symmetrical triangle, which would likely confirm a long period of consolidation.
In any case, both counts suggest that a movement towards at least $44,000 is expected.
For BeInCrypto’s previous bitcoin (BTC) analysis, click here.



