The Ethereum price has reached an important resistance line, which has been in place since June 26. While a breakout above could trigger a rapid increase, the price seems more likely to fail and reverse its trend.
Even though the price is trading at resistance, the outlook is not entirely bearish. Cryptocurrency trader @Glowto1994 outlined an Ethereum chart that shows the price completing an A-B-C correction, which would take the price to a high of $370 – $470, before a long decline with a final target slightly below $50.
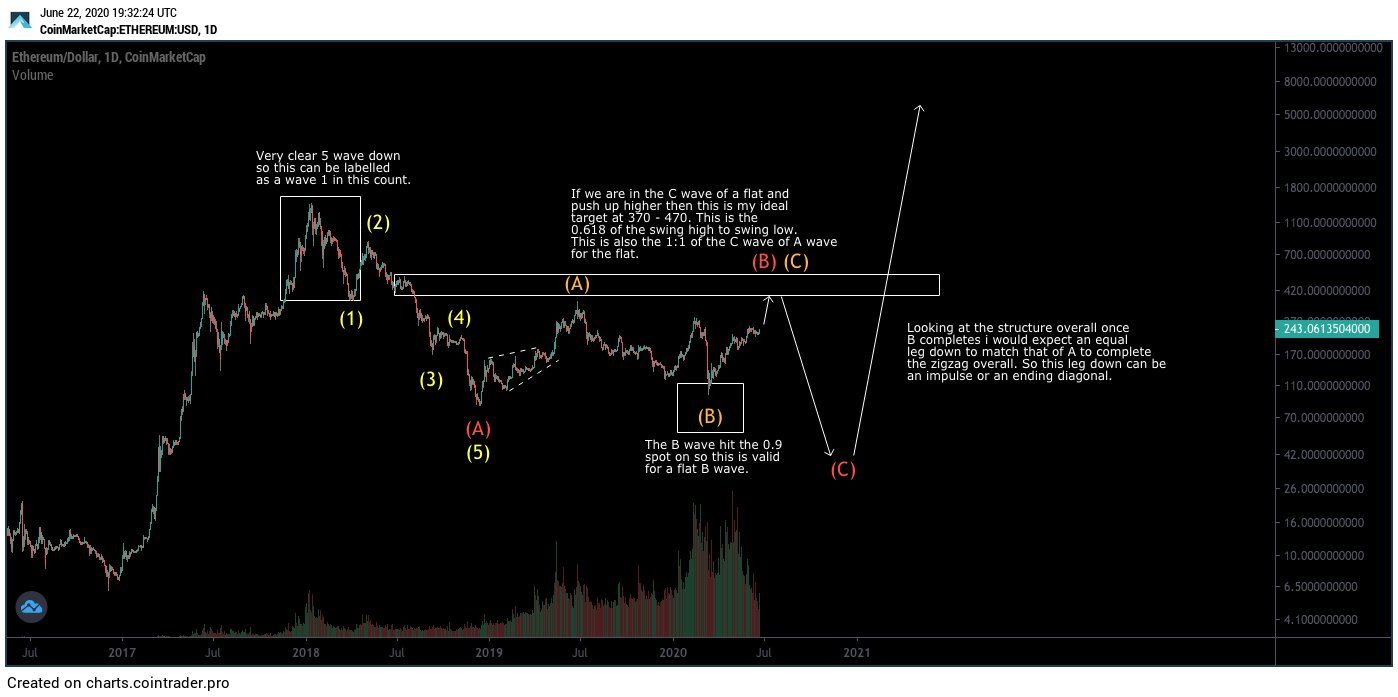
Will the Ethereum price drop below $50? And if it does, will it increase all the way to $370-$470 before that? Continue reading below in order to find out.
Long-Term Resistance
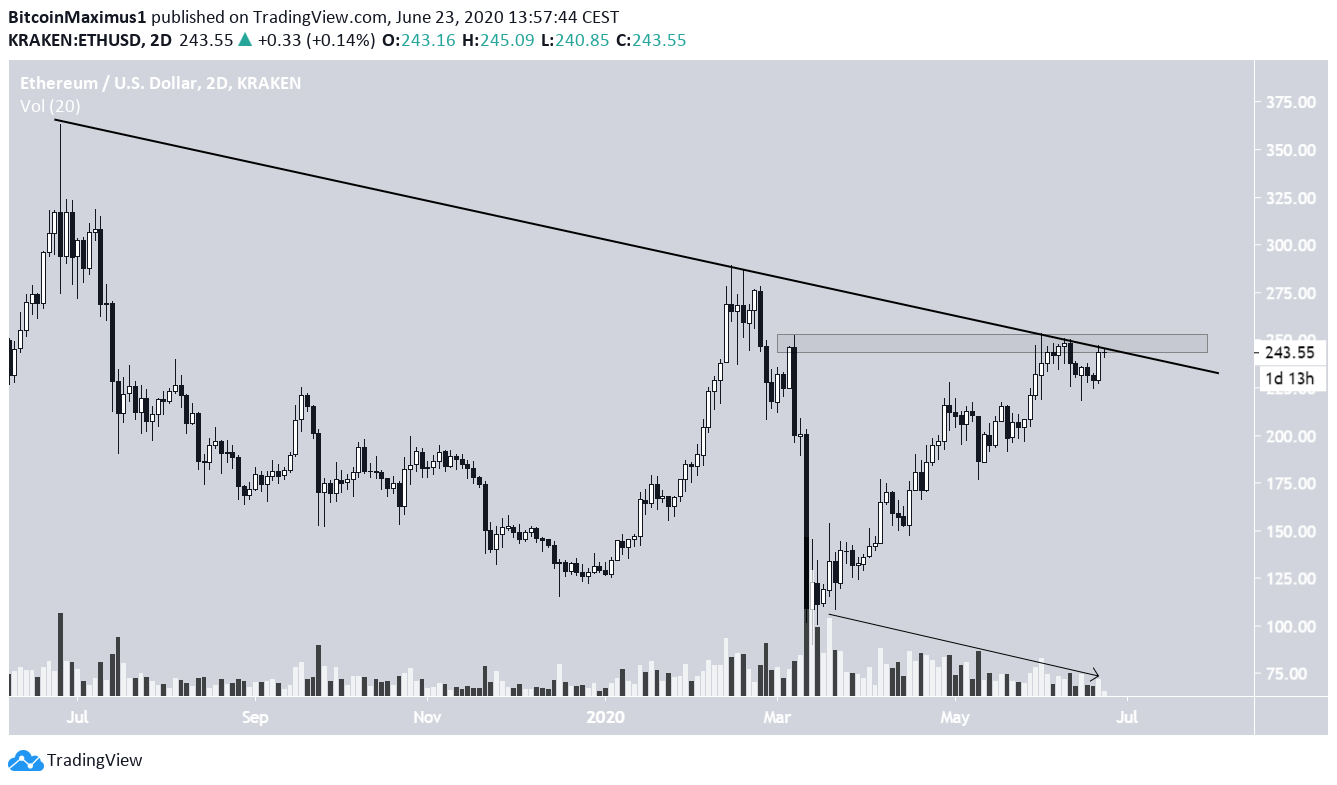
The Ethereum price has been following a descending resistance line since June 25, when it reached a high of $363. At the time of writing, the price was trading right at this resistance line, having touched it for the fourth time.
In addition, ETH is also trading at the $250 resistance area, making it difficult for the price to break out. Finally, volume has been gradually decreasing since the current upward move began on March 12, a bearish sign during an uptrend.
If the price were to break out, there would be resistance at the June 2019 and February 2020 highs, at $270 and $300, respectively. Therefore a target of $370 – $470 given in the tweet seems a bit too ambitious.
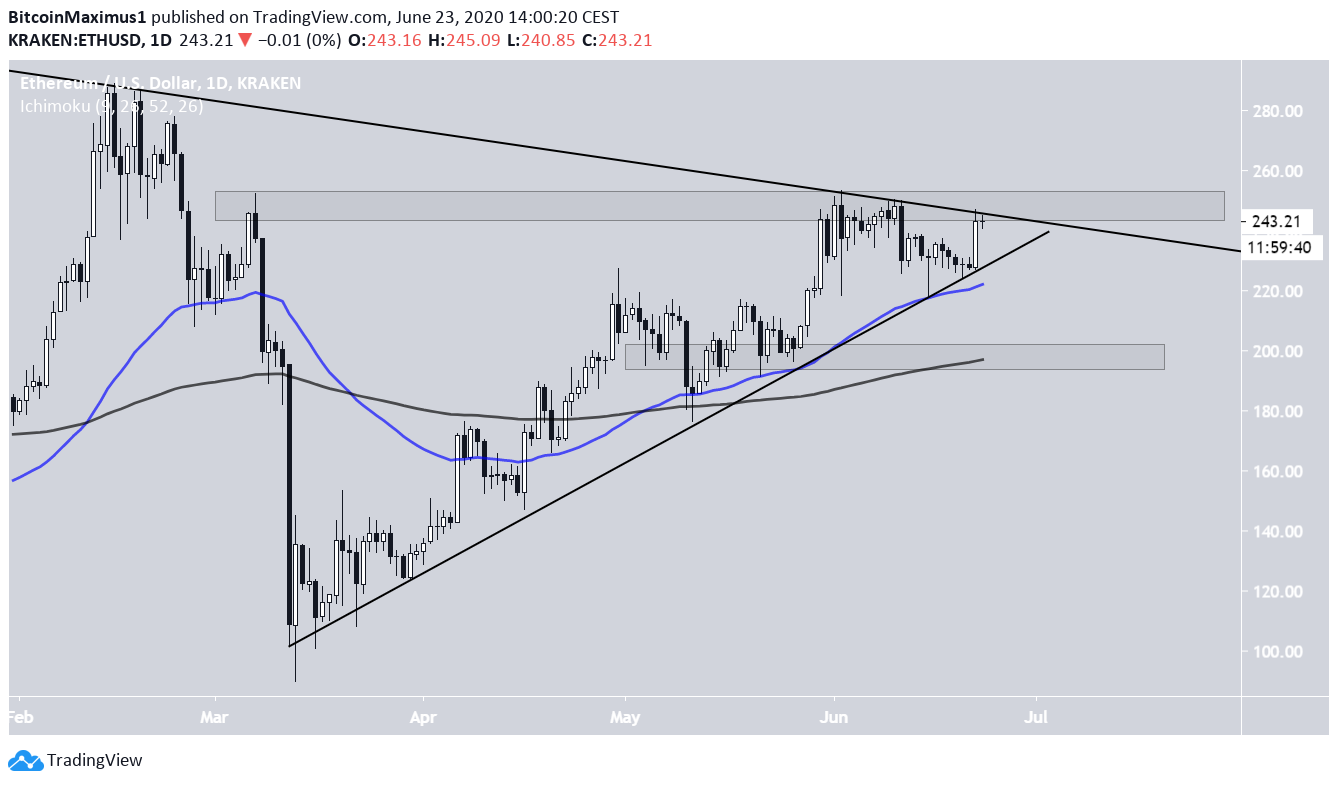
The daily chart reveals that the price has been following an ascending support line since the previous bottom on March 12. The support line is strengthened by the presence of the 50-day moving average (MA).
If the price were to break down, it would likely decrease all the way to $190 – $200, the closest support area, which is also supported by the 200-day MA.
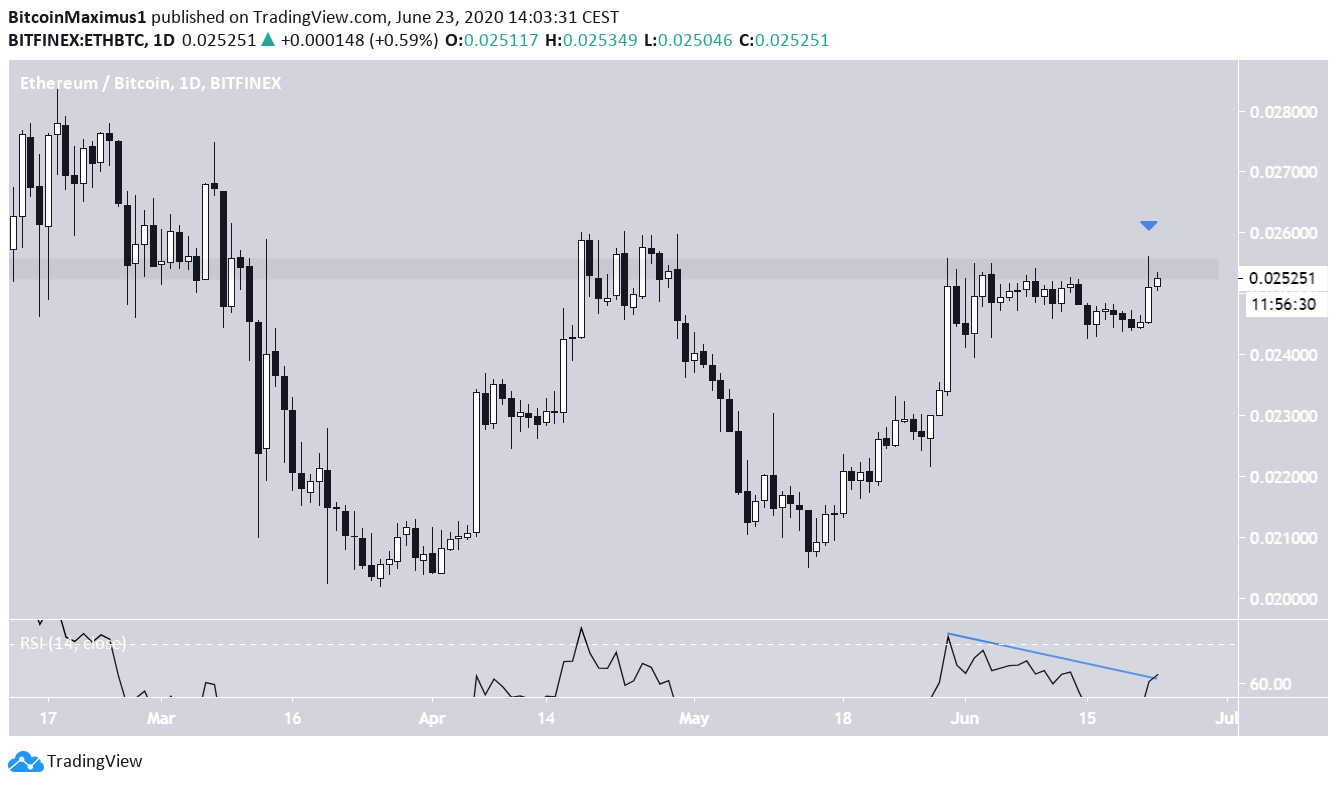
Ethereum/Bitcoin
The Ethereum/Bitcoin chart shows a similar move. The price is currently inside a resistance area at ฿0.0255. Furthermore, the price made an attempt at breaking out yesterday but was rejected and created a long upper wick in the process. This is a bearish sign that suggests there is selling pressure at the current price.
Furthermore, the daily RSI has formed bearish divergence, another sign that ETH/BTC is expected to decrease.