Origin Protocol (OGN) has created a long-term double bottom pattern and broke out from a descending resistance line after.
It’s possible that OGN has completed a short-term correction and will head upwards toward $0.21.
Origin Protocol Double Bottom And Breakout
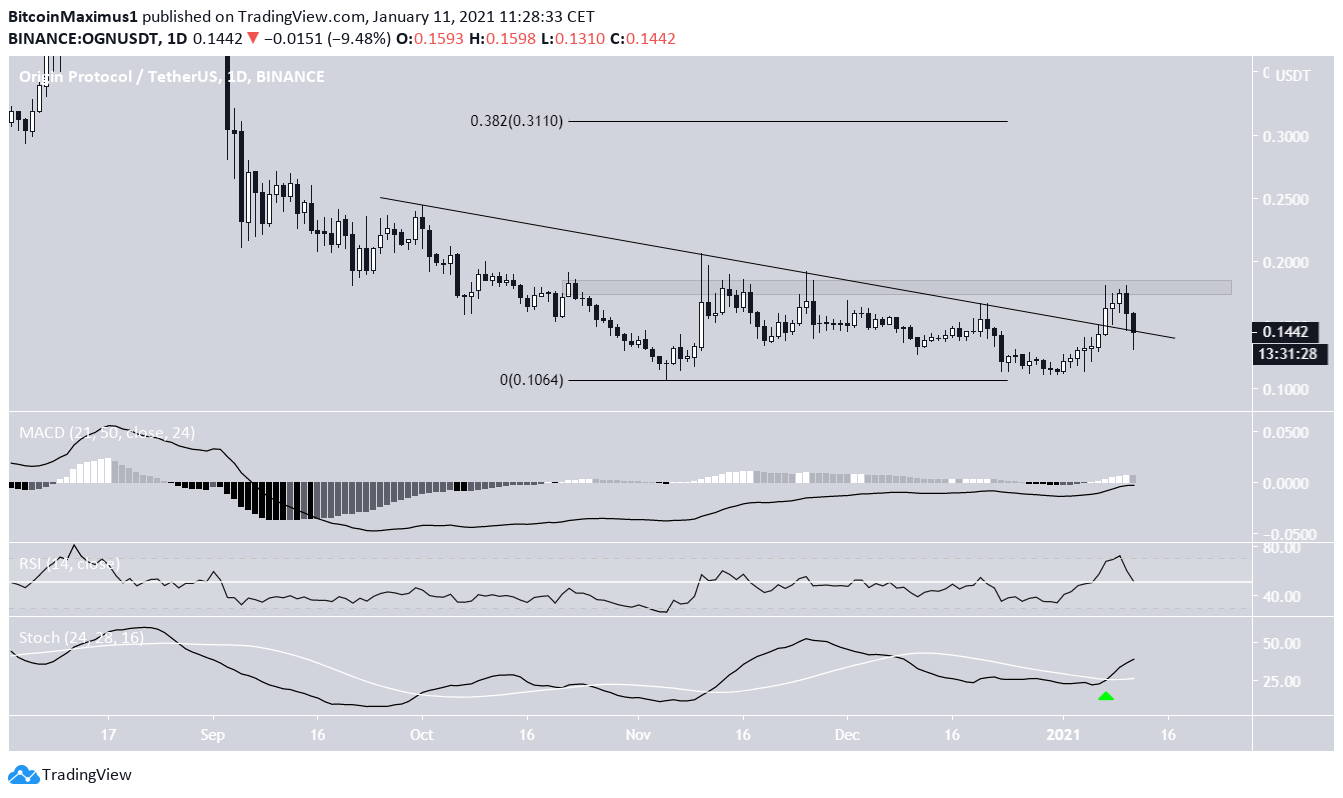
On Nov. 5, OGN reached a low of $0.106, which was very close to the all-time low price of $0.096. This effectively created a double bottom pattern, which was combined with a bullish divergence in the weekly RSI.
This is a strong bullish signal that often precedes price reversals.

Cryptocurrency trader @Cryptomagnified outlined an OGN chart and stated that the price is in the process of breaking out from a long-term resistance line.
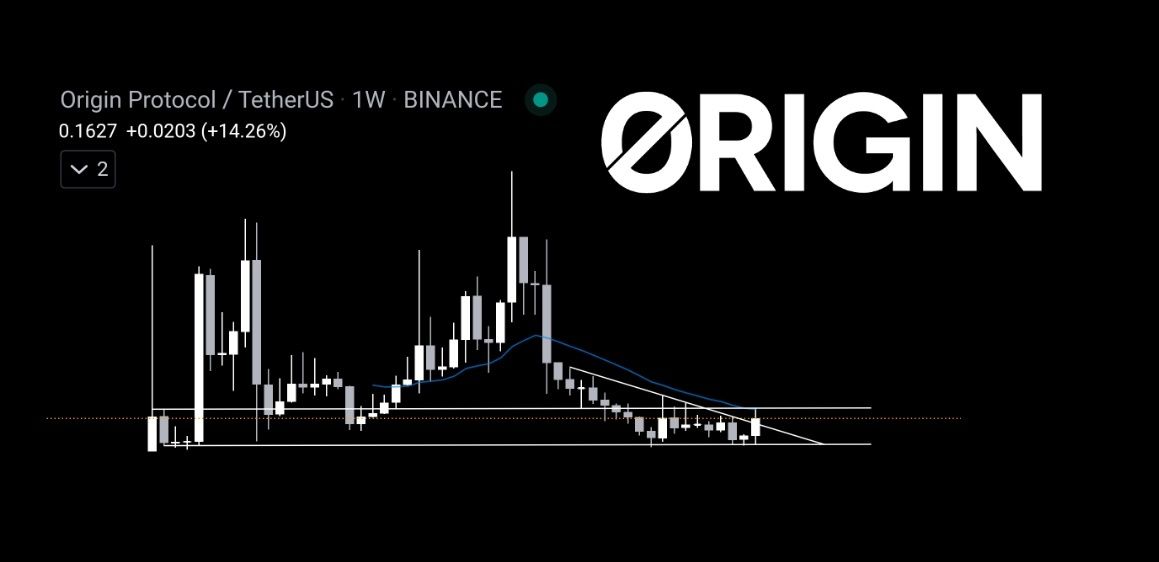
Since the Tweet, OGN has broken out from the resistance line but was rejected by the $0.18 horizontal resistance area. Currently, OGN is in the process of validating the line as support.
Technical indicators are relatively bullish. The Stochastic oscillator has made a bullish cross and the RSI looks to be bouncing at the 50-line. The MACD, however, has yet to cross above 0.
If OGN breaks out above the $0.18 area, the next resistance would be found at $0.31 (the 0.382 Fib retracement level).
Completed Correction
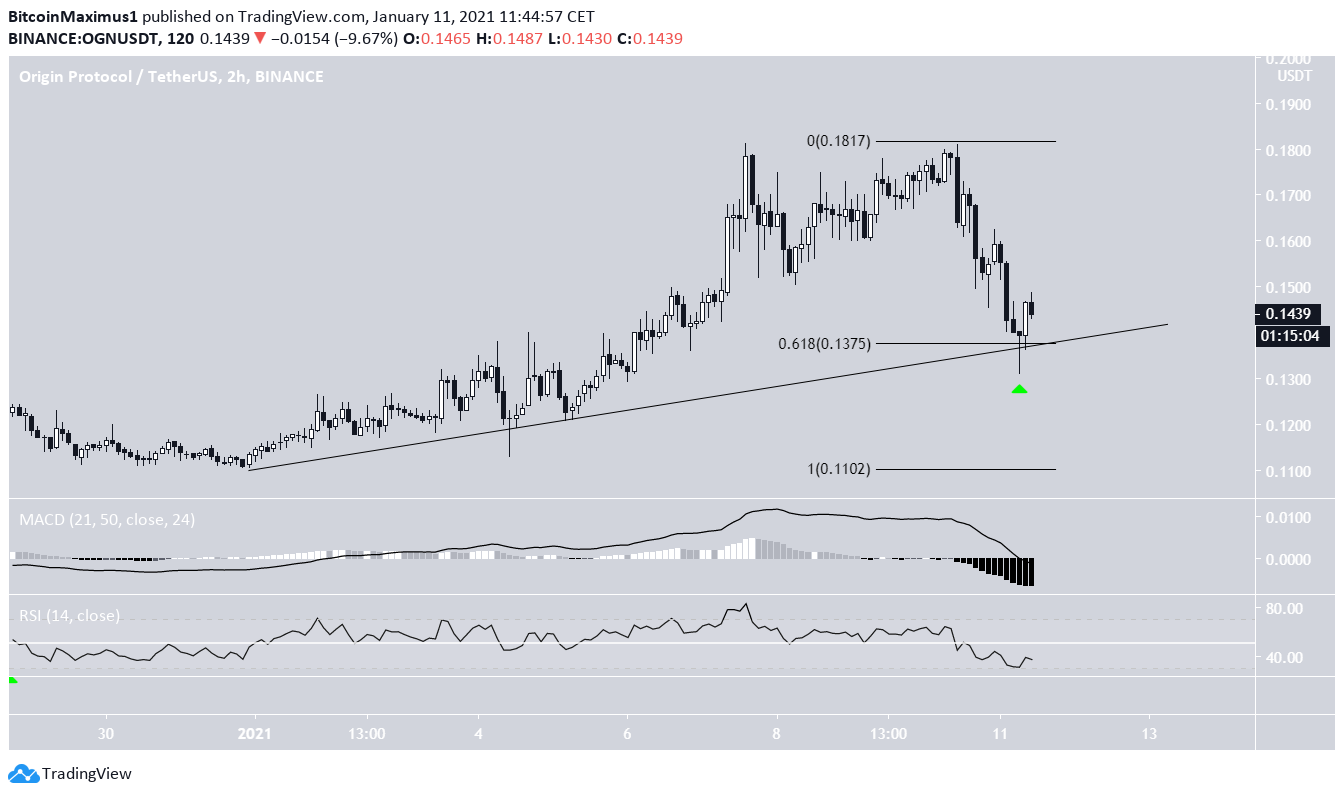
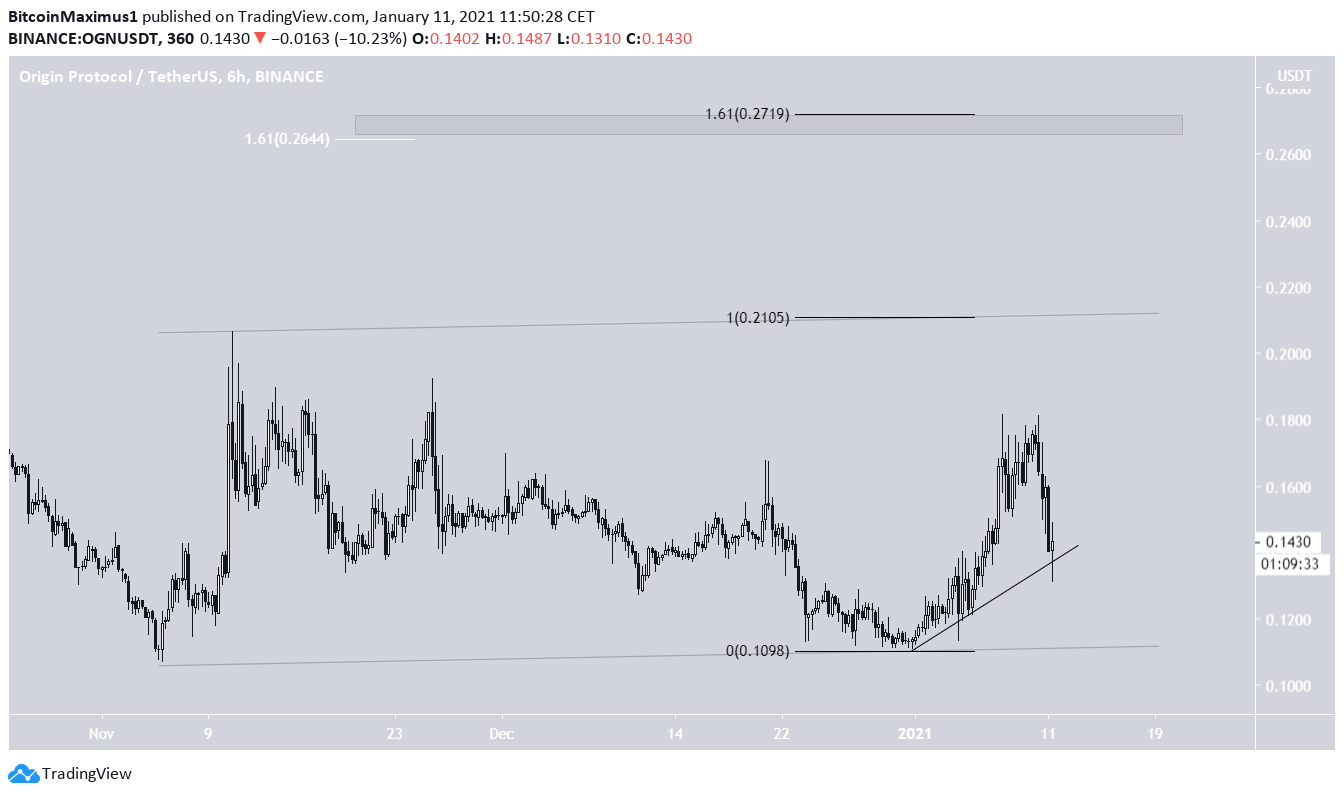
The two-hour chart shows an ascending support line, above which OGN has just bounced. Furthermore, the line coincides with the 0.618 Fib retracement level of the entire upward movement, making it a likely place to initiate a reversal.
Technical indicators, on the other hand, do not yet confirm a reversal.
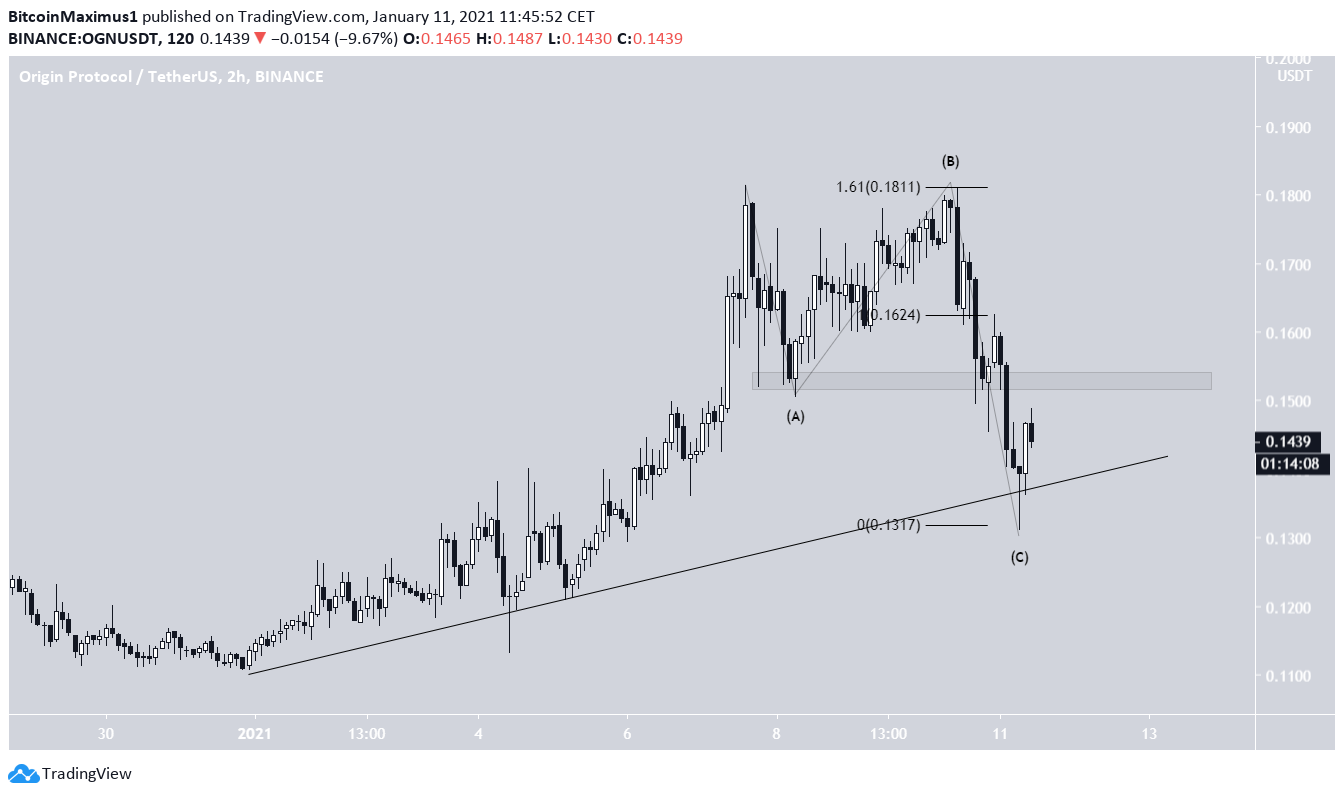
The decrease very much resembles an A-B-C irregular flat corrective structure, in which waves A:C have a 1:1.61 ratio. This ratio is quite common in similar corrective structures.
Reclaiming the $0.152 resistance level would likely confirm this possibility and suggest that OGN is heading higher.
Future OGN Movement
If OGN continues to move higher, the first likely target for the top would be at $0.21. This level is found by drawing a parallel channel connecting the most recent highs and lows.
The next most likely target for the top would be found between $0.264-$0.271 by using a combination of Fib extensions and external Fib retracements.
This target would also be close to the $0.31 resistance area, making it likely to act as the top.
Conclusion
It’s possible that Origin Protocol (OGN) has completed a short-term correction and will increase toward the range of $0.21 and $0.27.
For BeInCrypto’s latest Bitcoin (BTC) analysis, click here!
Disclaimer: Cryptocurrency trading carries a high level of risk and may not be suitable for all investors. The views expressed in this article do not reflect those of BeInCrypto.
Disclaimer
In line with the Trust Project guidelines, this price analysis article is for informational purposes only and should not be considered financial or investment advice. BeInCrypto is committed to accurate, unbiased reporting, but market conditions are subject to change without notice. Always conduct your own research and consult with a professional before making any financial decisions. Please note that our Terms and Conditions, Privacy Policy, and Disclaimers have been updated.


