
Today’s on-chain analysis highlights the declining hashrate of the Bitcoin network, which correlates with the bearish trend of the BTC price. However, it turns out that there are still more new users taking advantage of the bottom to join the crypto market.
At the same time, indicators of changing positions of long-term hodlers and declining BTC liquid supply provide signals of a potential trend reversal. Still, the correlation between the dropping price of BTC in the last two months and the short-term speculators sell-off remains very apparent.
Drop in hashrate and addresses
Since the all-time high of $64,800 on 14 April, the hashrate of the Bitcoin network has experienced a steady decline. The current value has reached levels not seen since May 2020 (green circle), when the BTC price was $9,000.
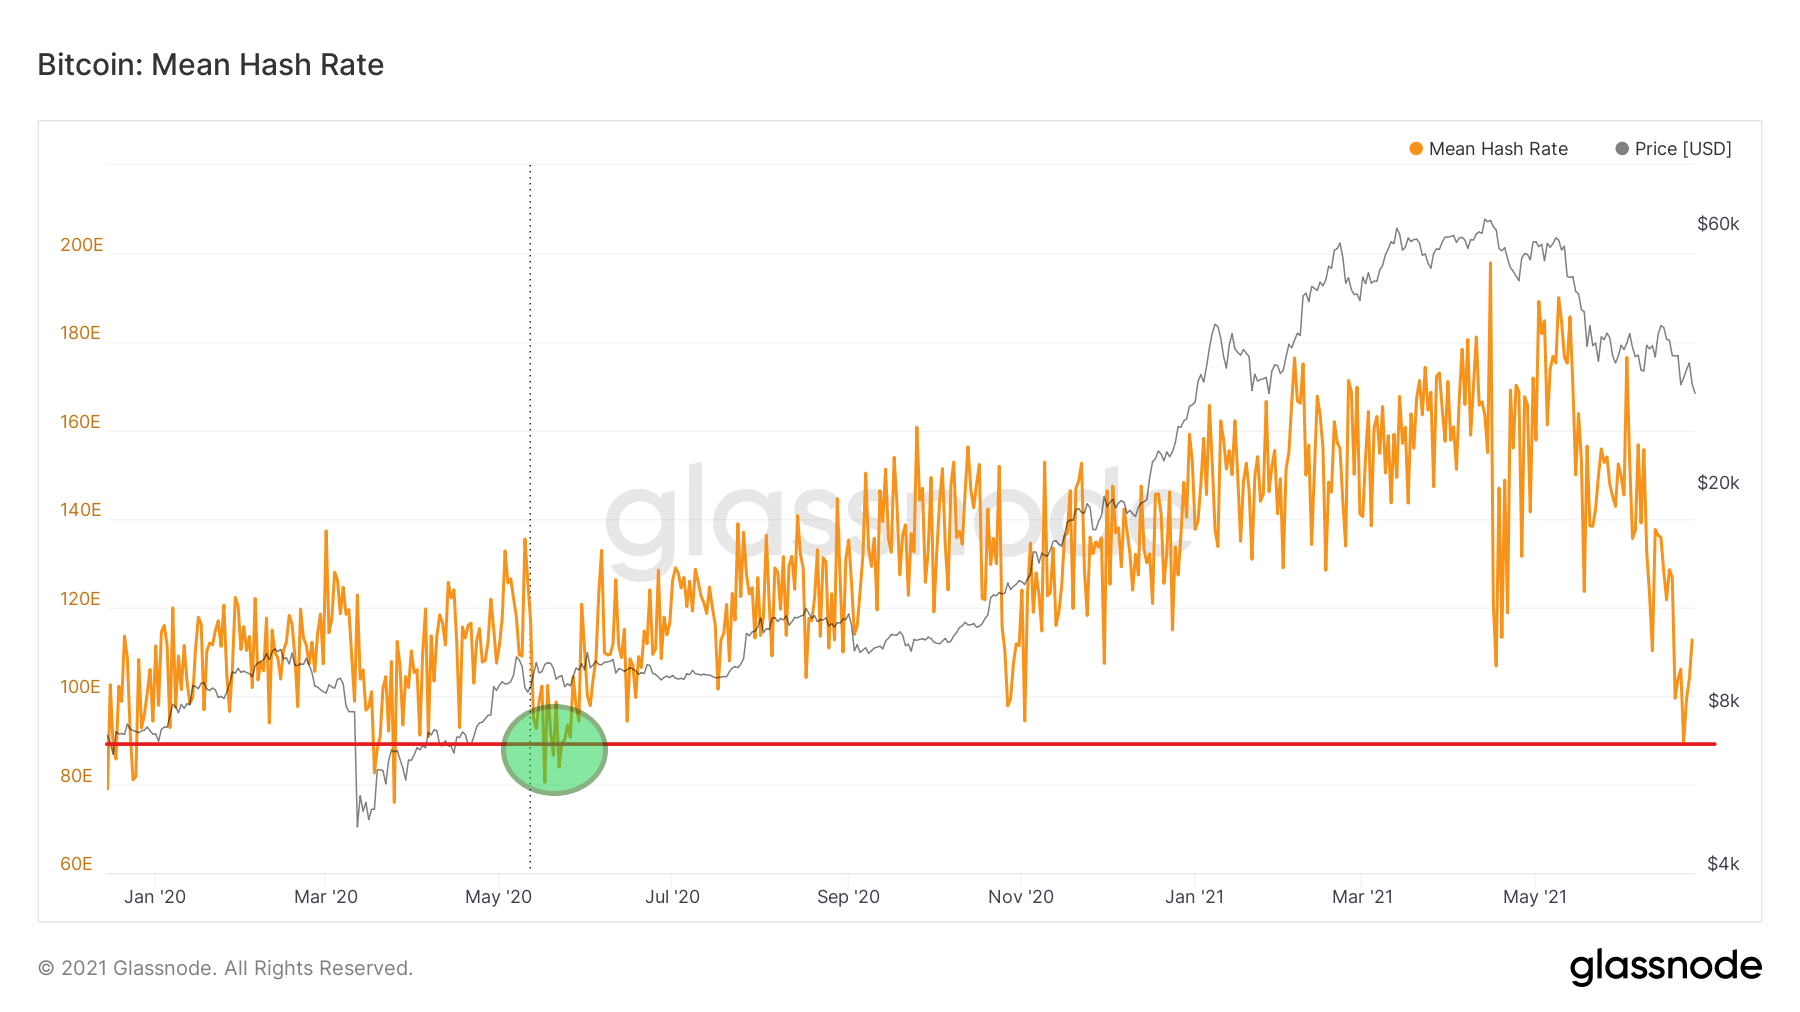
The drop in hashrate is therefore correlated with the drop in the BTC price. One of the reasons is also FUD related to the regulation of Bitcoin mining in China and the mine shutdowns there.
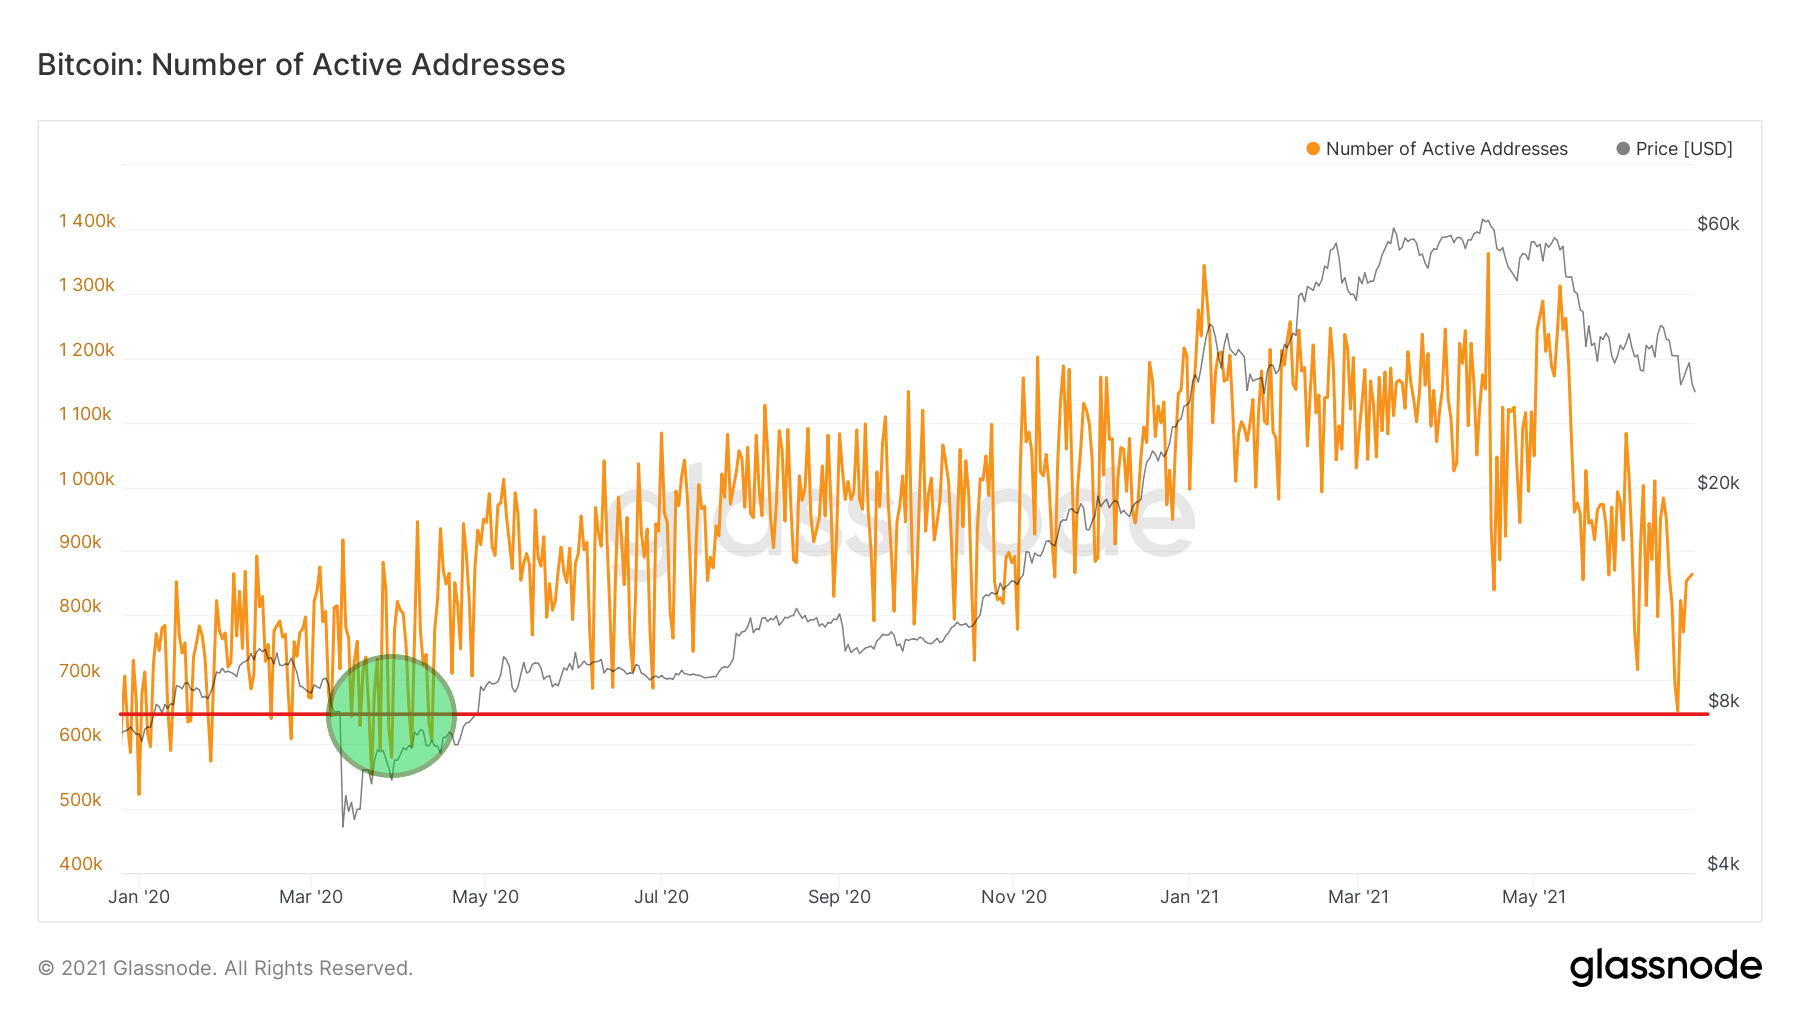
We see similar behavior in the on-chain indicator, which illustrates the number of active BTC addresses. Here too, the network sees a decline from all-time high to levels not seen since March 2020 (green circle). Back then, Bitcoin was recovering quickly from the COVID-19 crisis and the bottom at $3782.
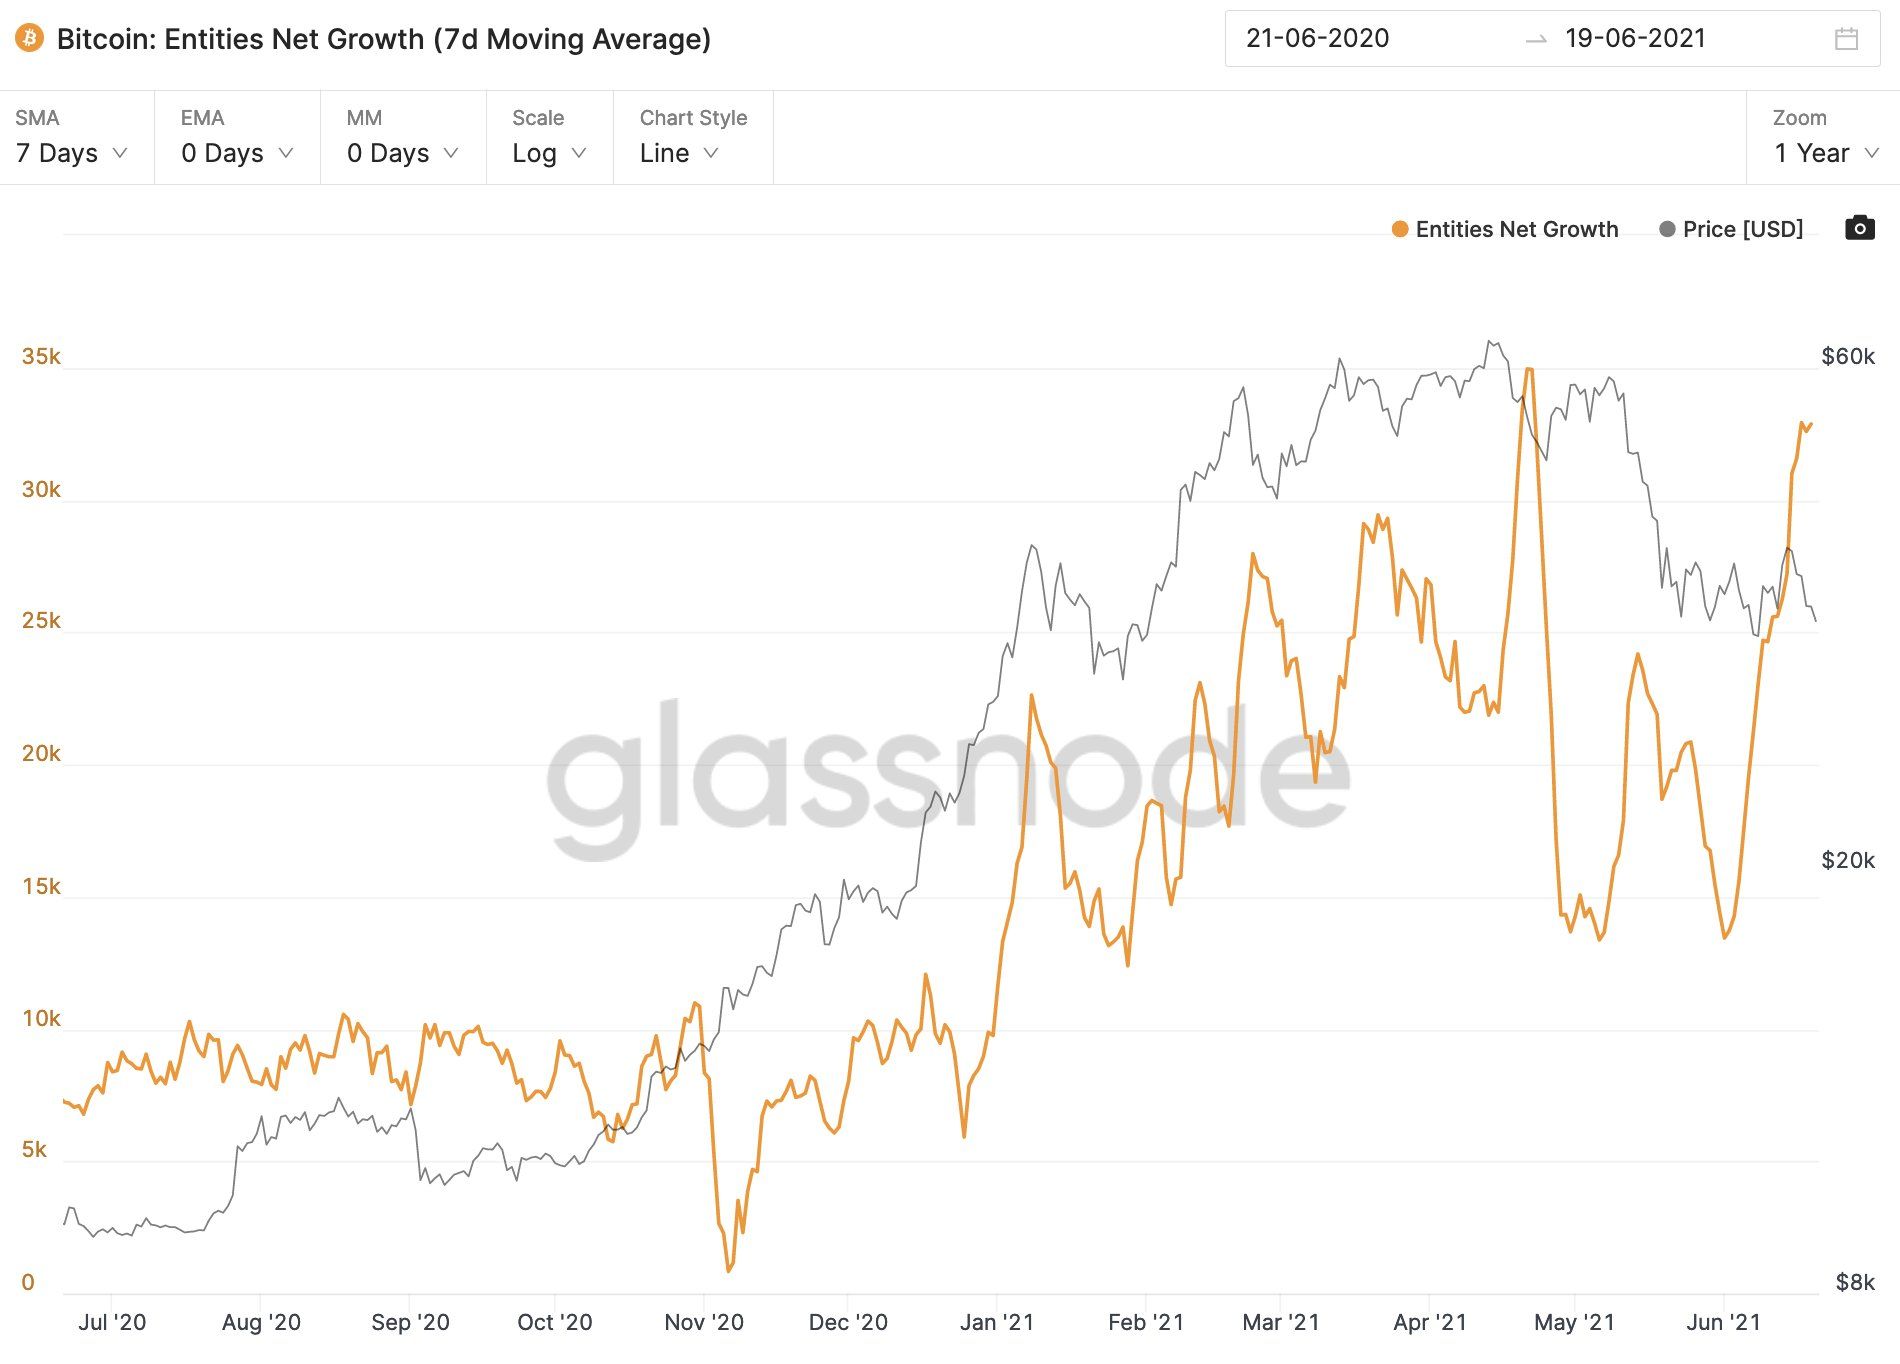
Despite this, Willy Woo tweeted a chart of the 7-day moving average of Entities Net Growth, which gives a slightly different picture. According to this on-chain analyst, net user growth is “as strong as ever”.
Indeed, the chart shows that after the double bottom in May and June, the last few days have seen a revival in user growth, who seem to be joining the market and taking advantage of the discounted BTC price.
Hodlers increase positions and BTC loses liquidity again
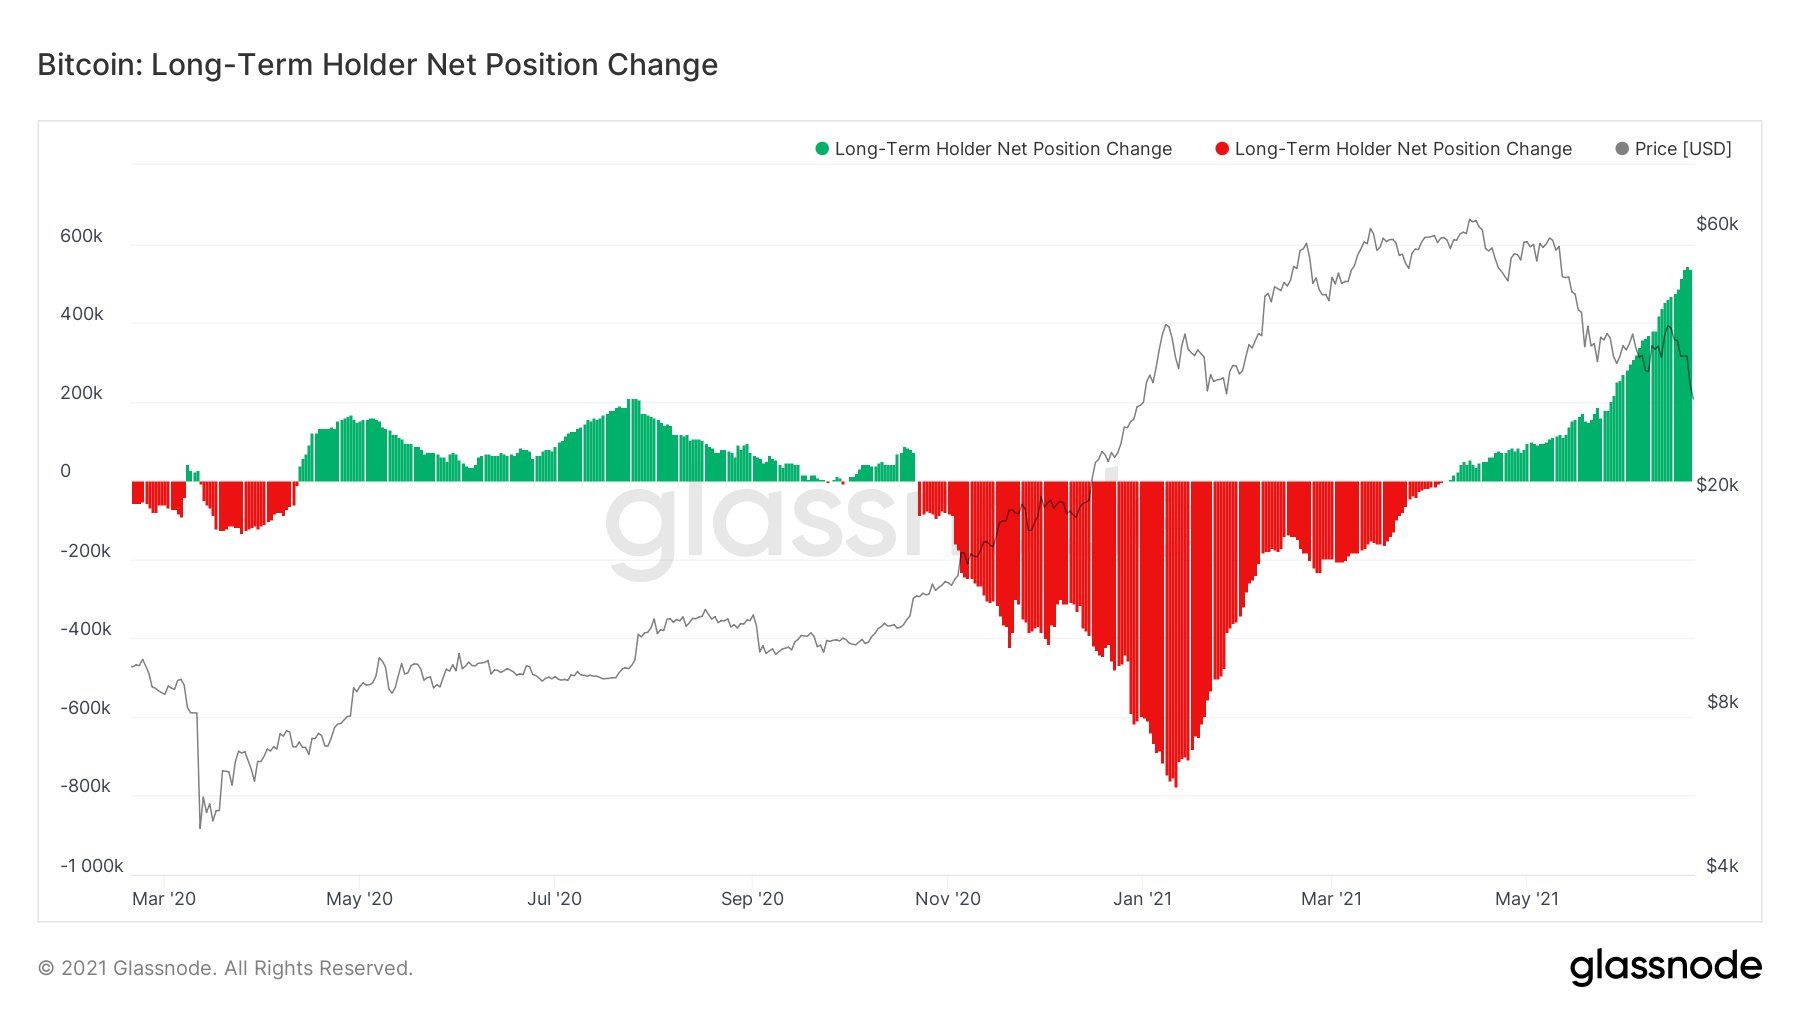
Another on-chain analyst, Yann & Jan, has published updated charts of the positions of long-term hodlers (LTH) and the change of BTC liquid supply. They provide additional arguments that the current price action could potentially serve as a reversal of the downtrend and a continuation of a long-term bull market in the future.
First of all, the chart of the positions of long-term hodlers unambiguously indicates a progressive phase of BTC accumulation and buying, which increases inversely proportional to the Bitcoin price. Such a strong increase in positions by LTH was not seen for over a year.
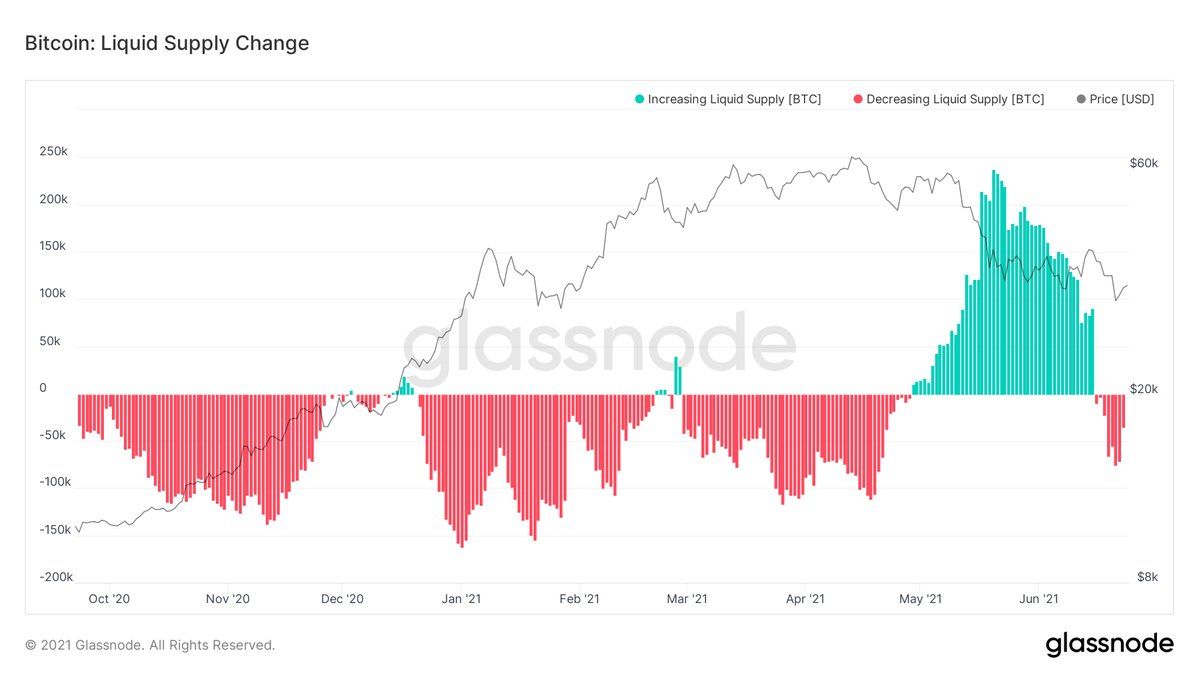
Then, for the first time since the May lows, the chart of BTC liquid supply change (Liquid Supply Change) entered negative territory. This means that once again the amount of Bitcoin available for trading is starting to outstrip demand and could potentially lead to higher prices.
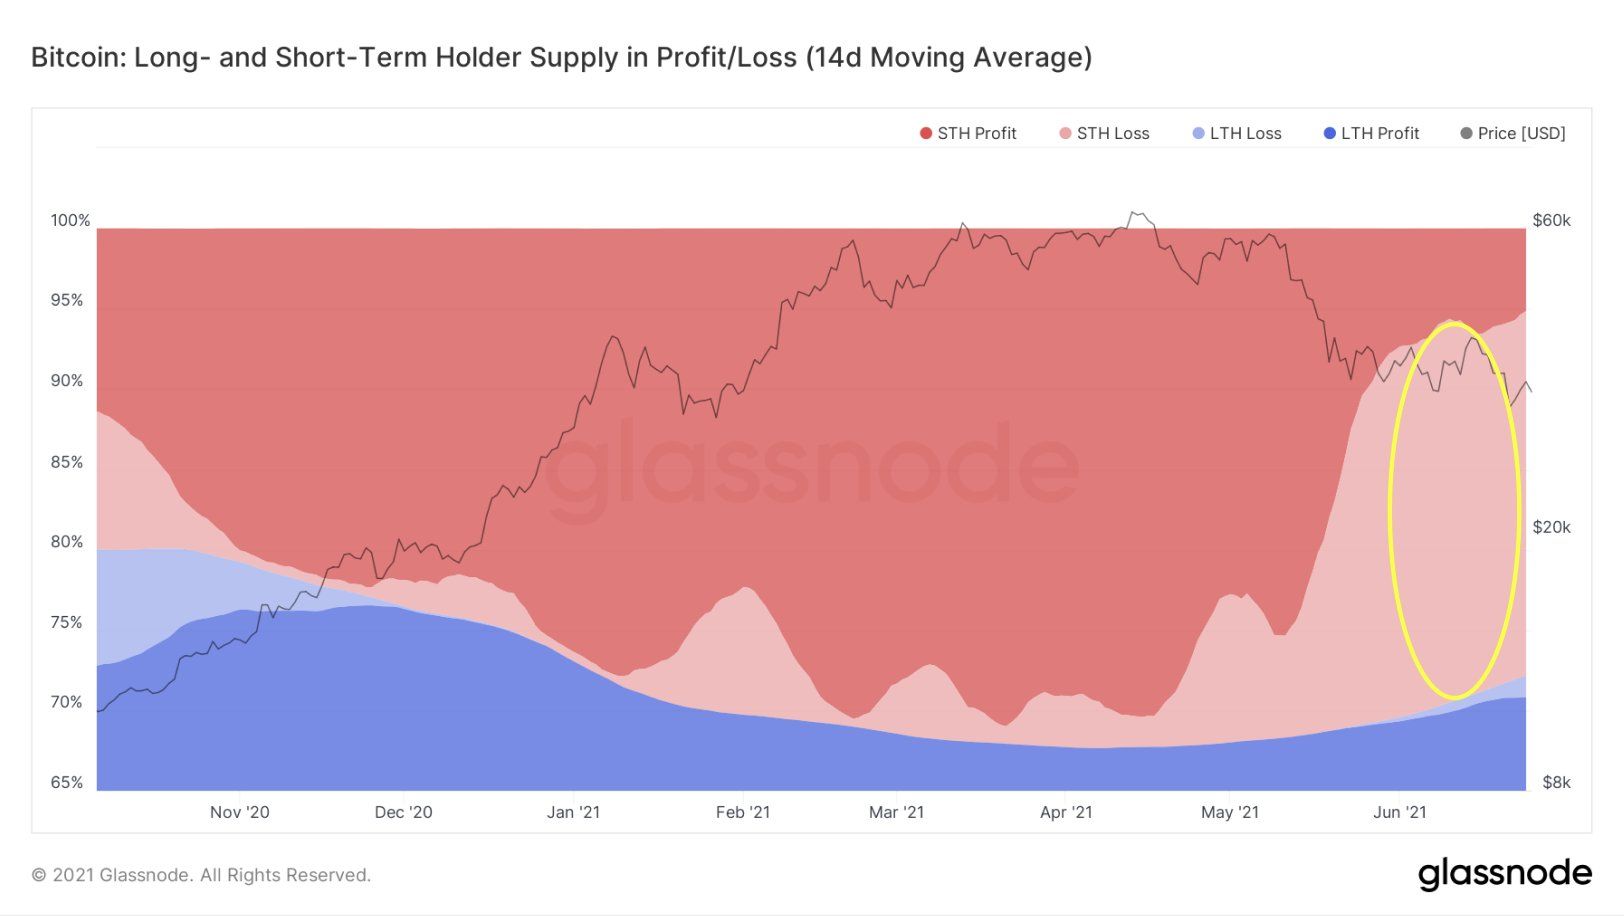
Finally, the latest chart confirms the trend that BeInCrypto wrote about in an analysis a few days ago. The group of investors that has realized the most losses during the drops are the short term speculators in the bright red area (yellow circle).
This group was also recently joined by some long term hodlers (light blue area), who sold with a loss in around $30,000. However, this is a small portion, as most LTHs are still in the profit.
For BeInCrypto’s latest Bitcoin (BTC) analysis, click here.
