


The Ocean Protocol (OCEAN) price has broken down from an ascending support line that had been in place since Oct.
While OCEAN is trading just above a minor support area, technical indicators suggest that it will break down and head towards the support areas outlined in the article.
OCEAN Breakdown From Support
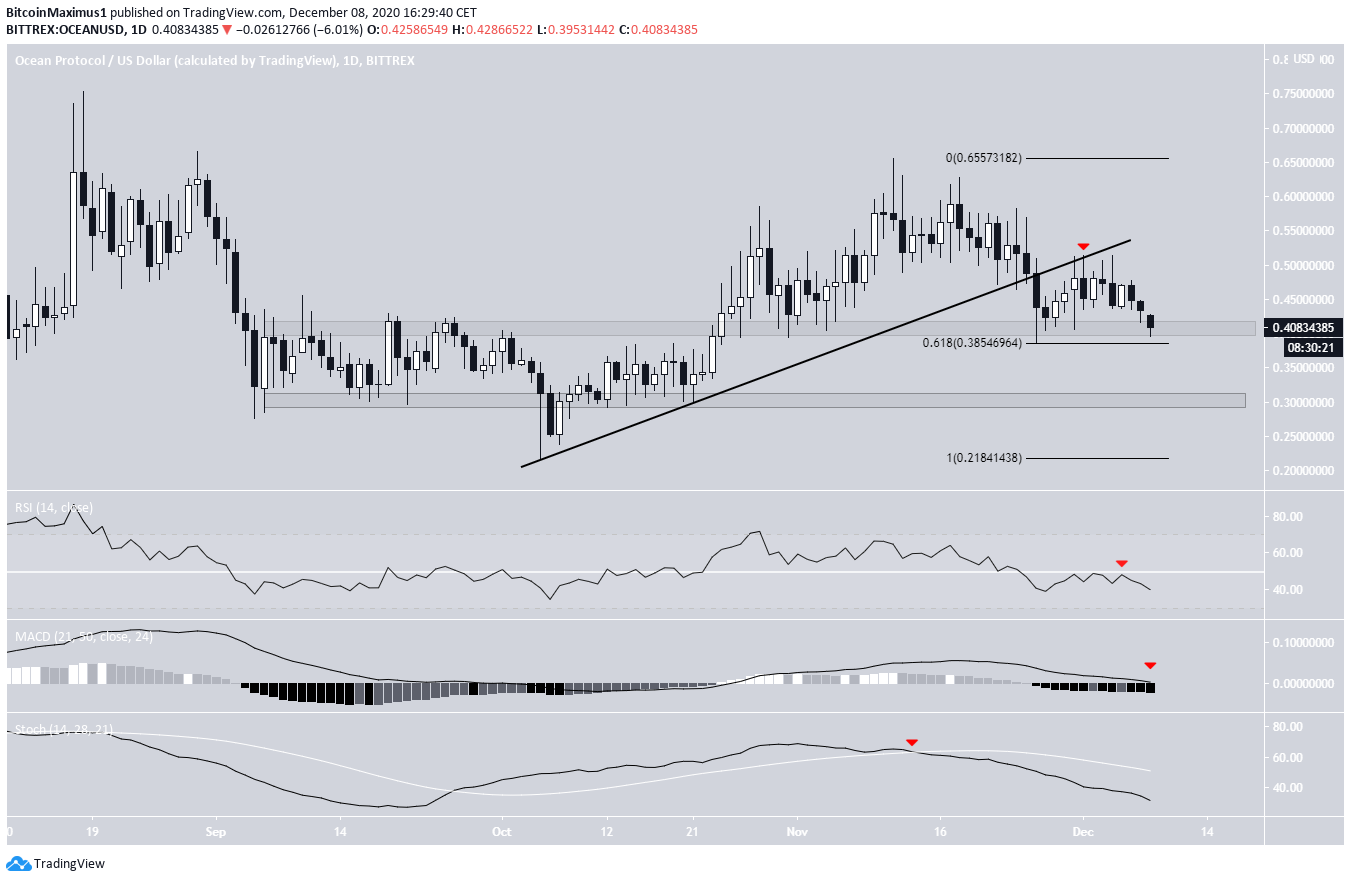
The OCEAN price had been following an ascending support line since reaching a low of $0.21 on Oct. 5. However, it broke down from the line on Nov. 26 and validated it as resistance afterward (shown with the red arrow in the image below). It then resumed its downward trend.
Currently, it’s trading inside the $0.41 support area, which coincides with the 0.618 Fib retracement level of the entire upward move. The next support area is at $0.30.
Technical indicators are decisively bearish. The RSI is below 50, the MACD has just turned negative, and the Stochastic Oscillator has made a bearish cross and is moving downwards.
Possible Breakdown
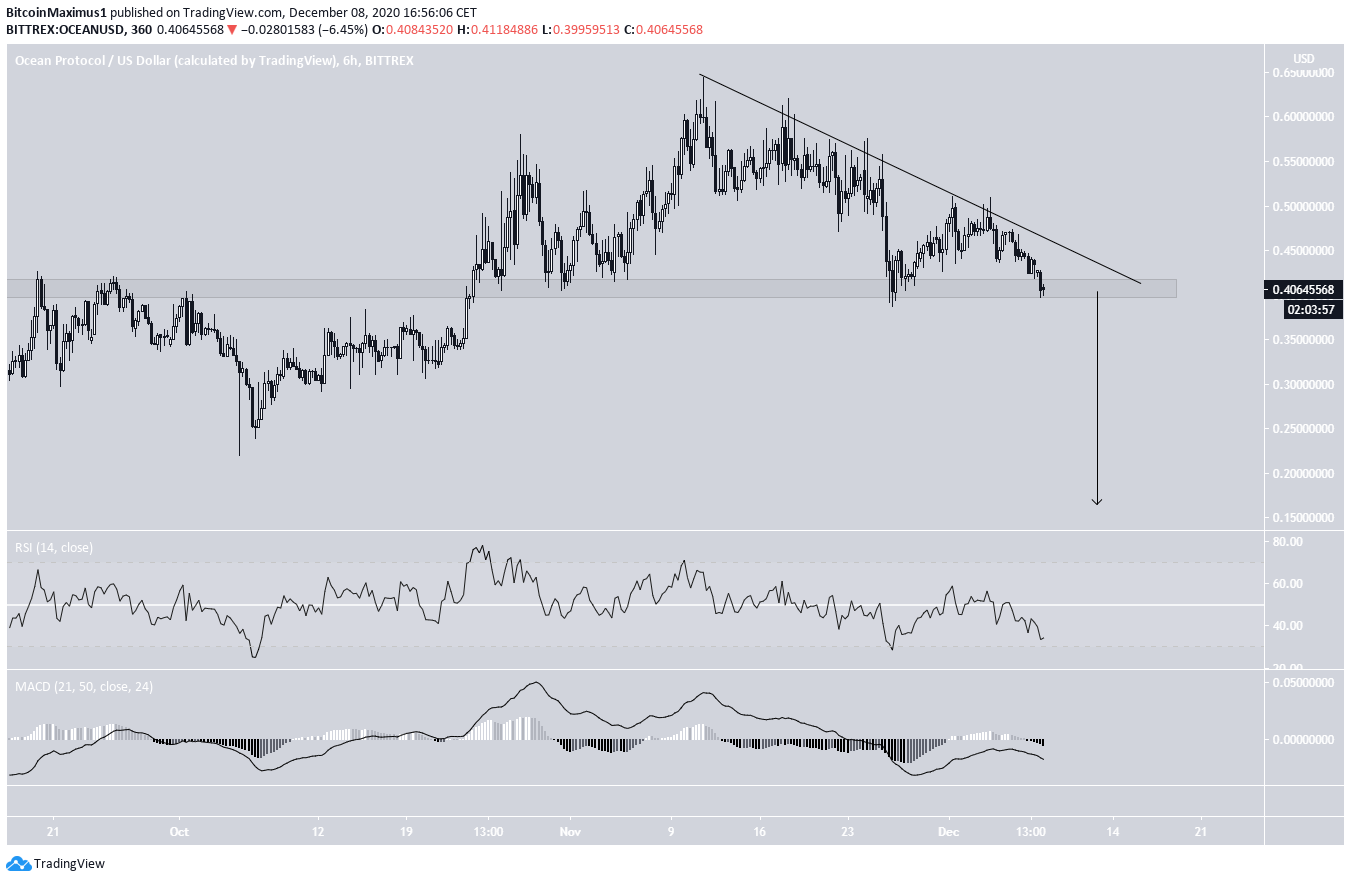
The shorter-term six-hour chart shows that OCEAN has been following a descending resistance line since Nov. 11. Combined with the $0.41 support area, the line possibly creates a descending triangle, which is a bearish pattern.
A breakdown that travels the entire height of the pattern would take OCEAN all the way down to $0.17.
Both the MACD and the RSI are bearish and support this possibility.
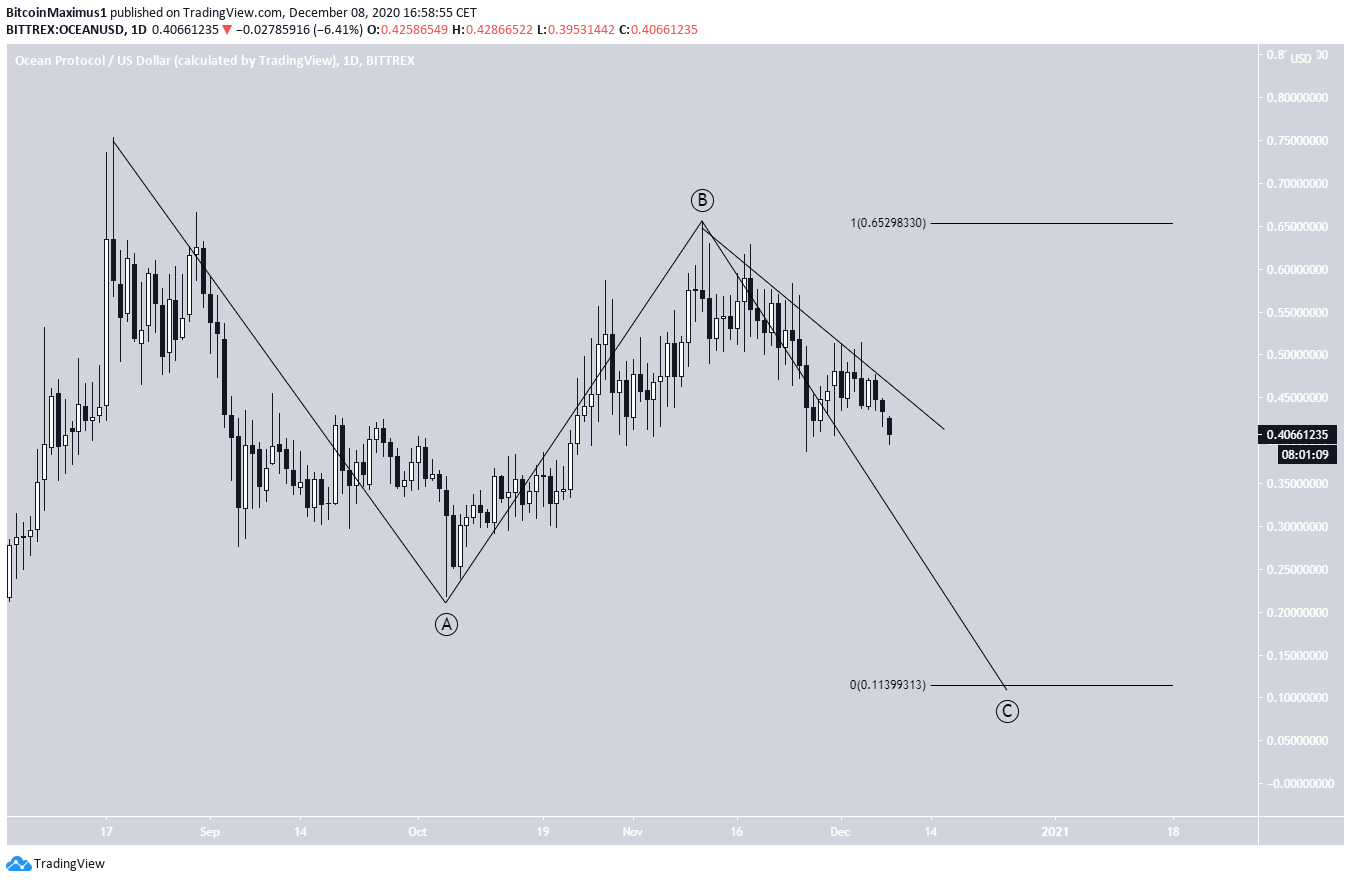
The decline would also fit with the possibility that the entire movement since Aug. 18 is an A-B-C corrective structure (shown in black below), in which OCEAN is currently in wave C.
If waves A:C have a 1:1 ratio, which is common in such corrections, the price would reach a low of $0.11 before possibly beginning to move upwards.
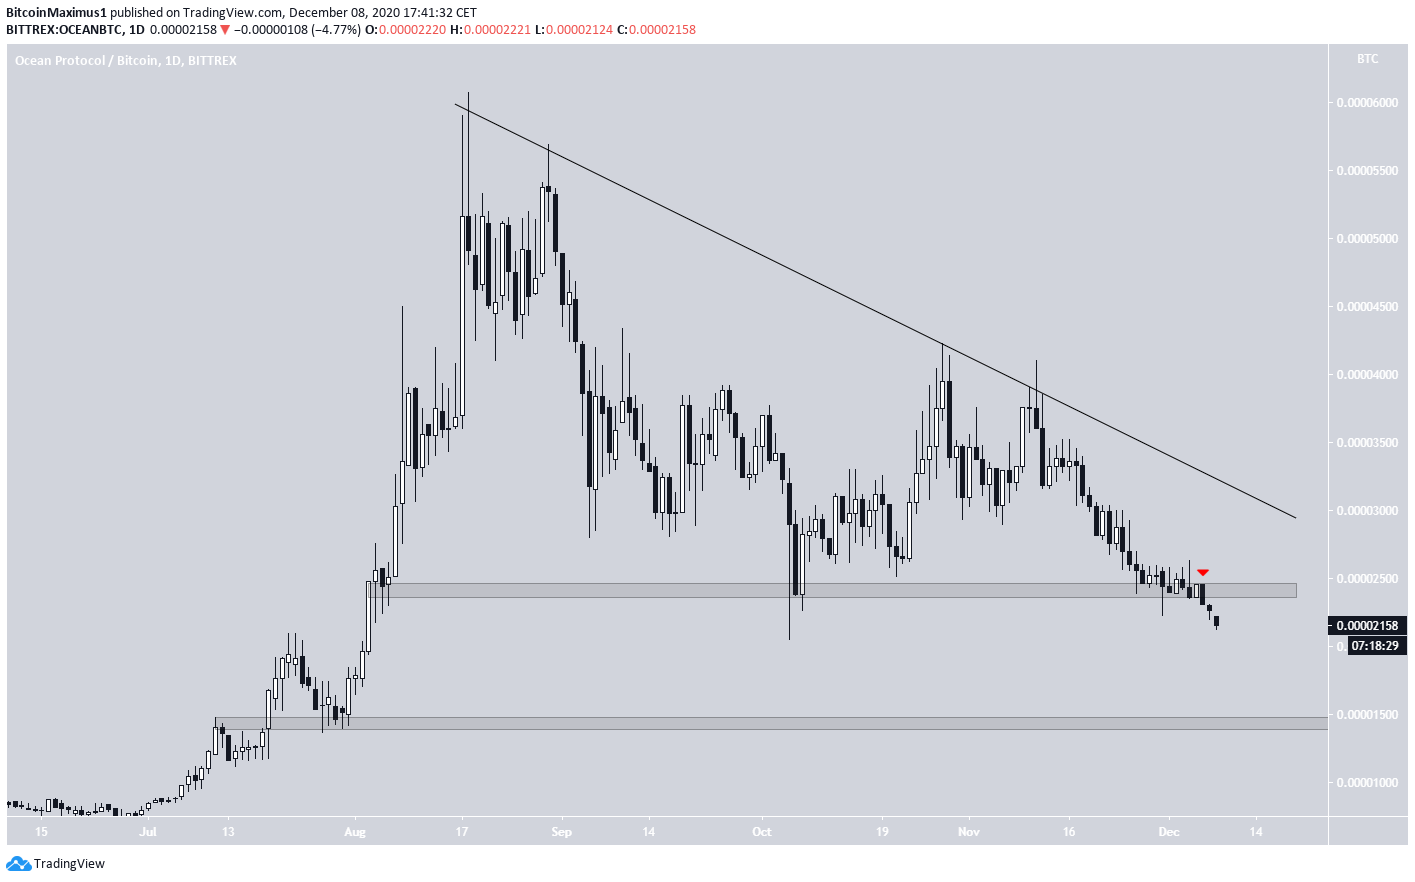
OCEAN/BTC
Cryptocurrency trader @CryptoMichNL outlined an OCEAN chart, stating that the price will likely drop once more towards 1400 satoshis before possibly beginning an upward move.
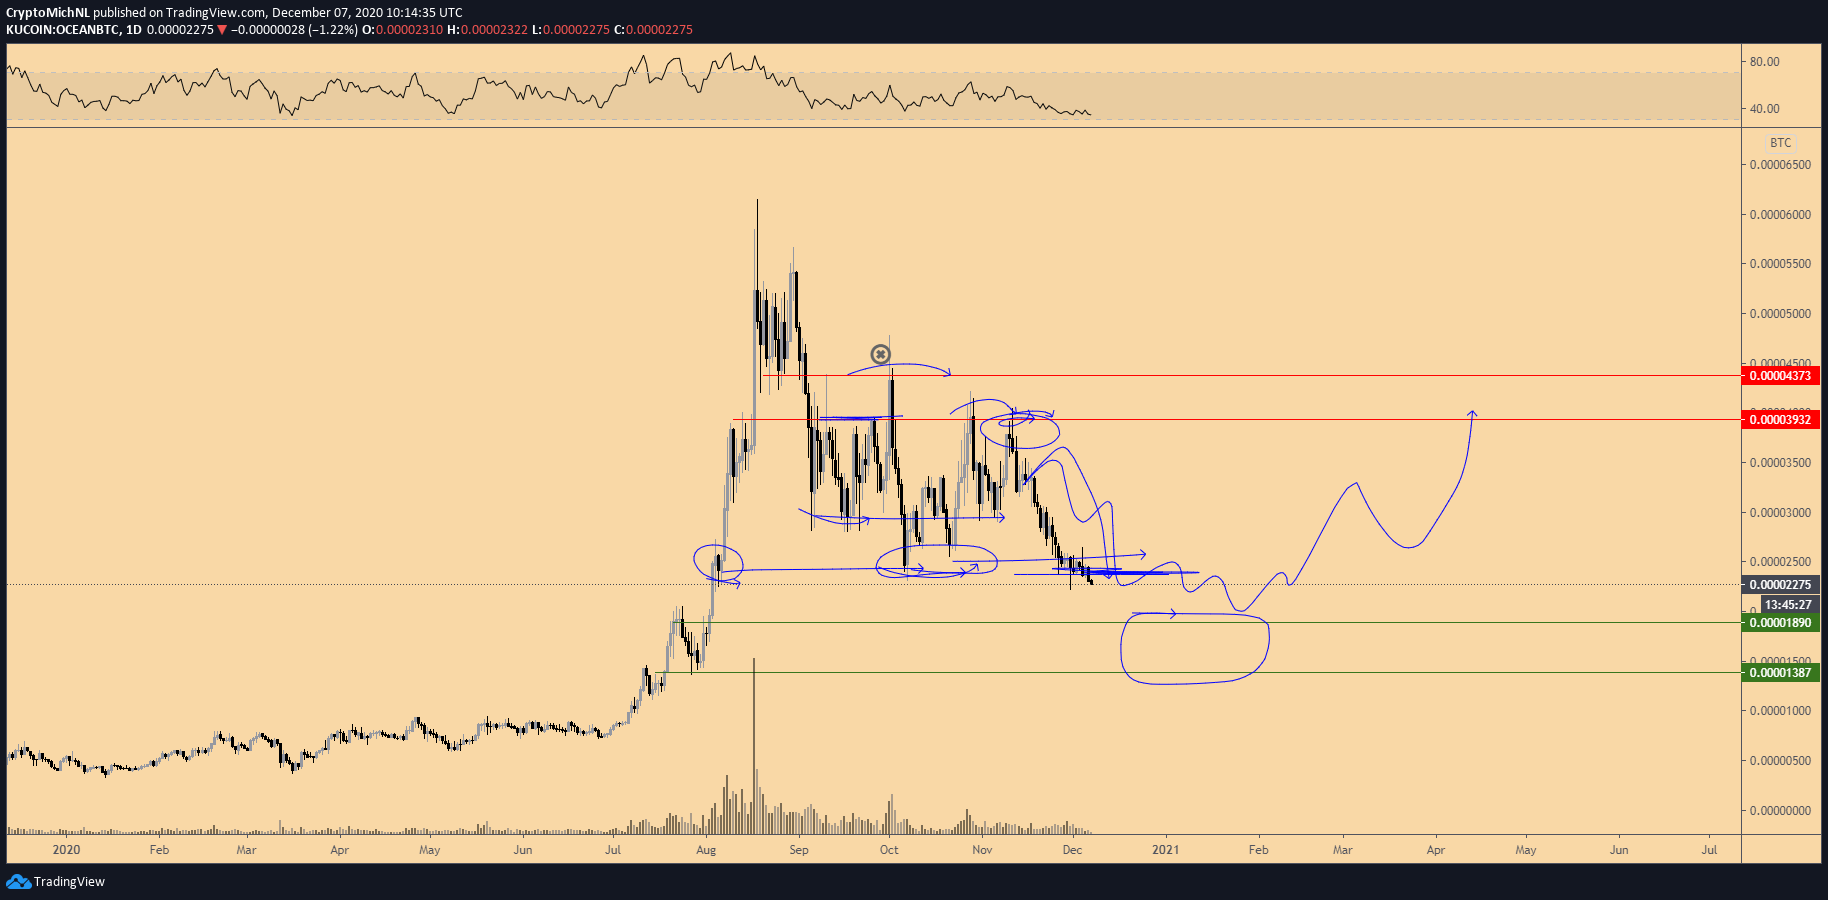
The OCEAN/BTC price has been declining since Aug. 18, when it reached a high of 6071 satoshis. While it temporarily found support above 2400 satoshis, it is now in the process of breaking down from that area.
The closest support area is all the way at 1400 satoshis, and due to the lack of bullish signs, it should decline to that area.
Conclusion
To conclude, the OCEAN price should break down below its minor support area and possibly find support at $0.30.
If the $0.30 area fails, it could fall all the way to $0.16. Similarly, the OCEAN/BTC pair is likely to decline towards 1400 satoshis.
For BeInCrypto’s previous Bitcoin analysis, click here!
Disclaimer: Cryptocurrency trading carries a high level of risk and may not be suitable for all investors. The views expressed in this article do not reflect those of BeInCrypto.


