


The NULS (NULS) price has been decreasing since hitting a local high in July. Once it reached a crucial support level at $0.18, the price has appeared to pivot back to the upside.
While the wave count suggests that NULS has already reached a bottom, a reversal will be confirmed if the price is able to break out from the current descending resistance line.
NULS Reaches Support
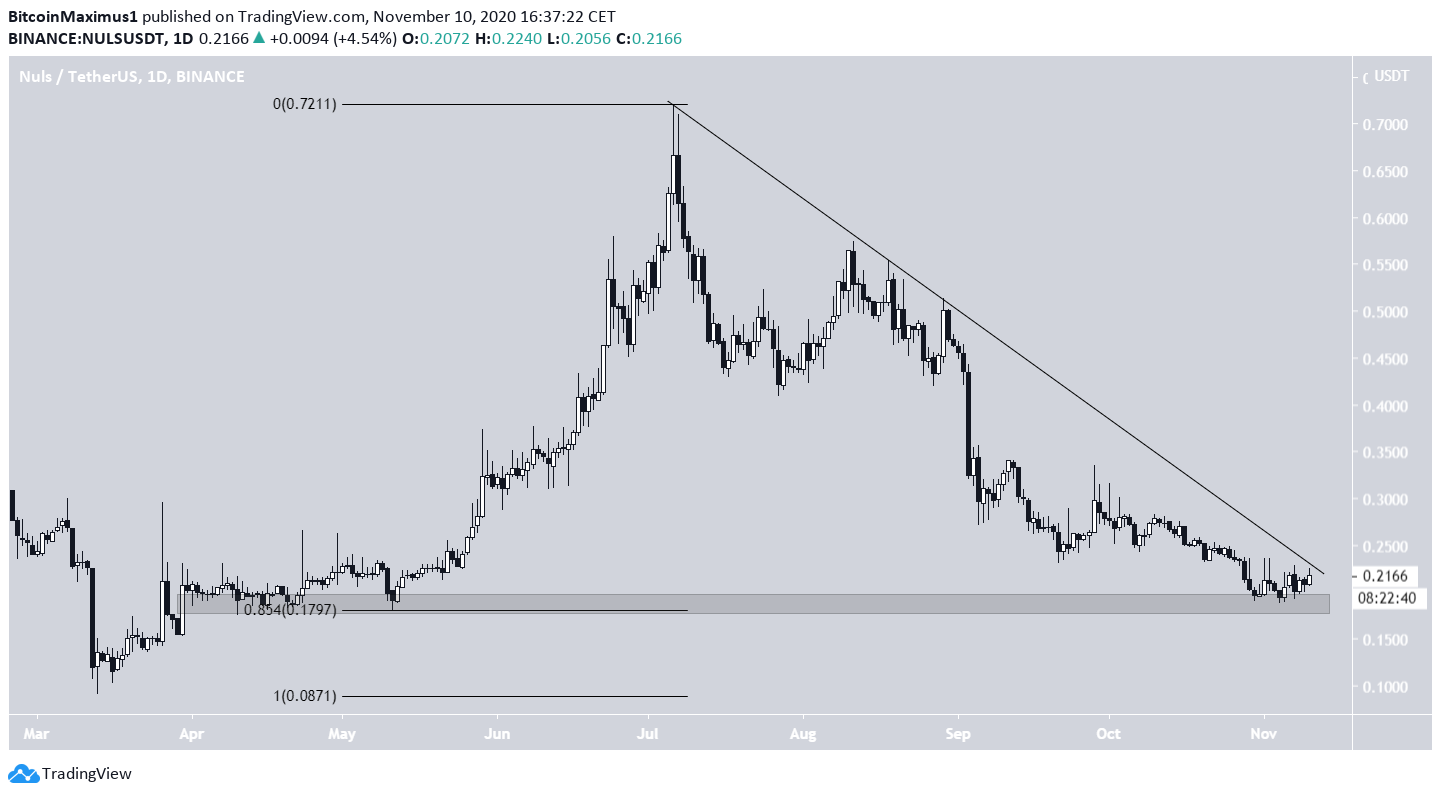
Since the beginning of November, NULS has been trading very close to the $0.18 support area, which is the 0.85 Fib level of the entire upward move. The price appears to have created a higher low and has started to move upwards.
While the area has offered support, the price is still stuck under a descending resistance line that has been in place since the July 6 high of $0.72.
Until the price is successful in breaking out from this line, we cannot confidently state that the trend has reversed.
Impending Breakout
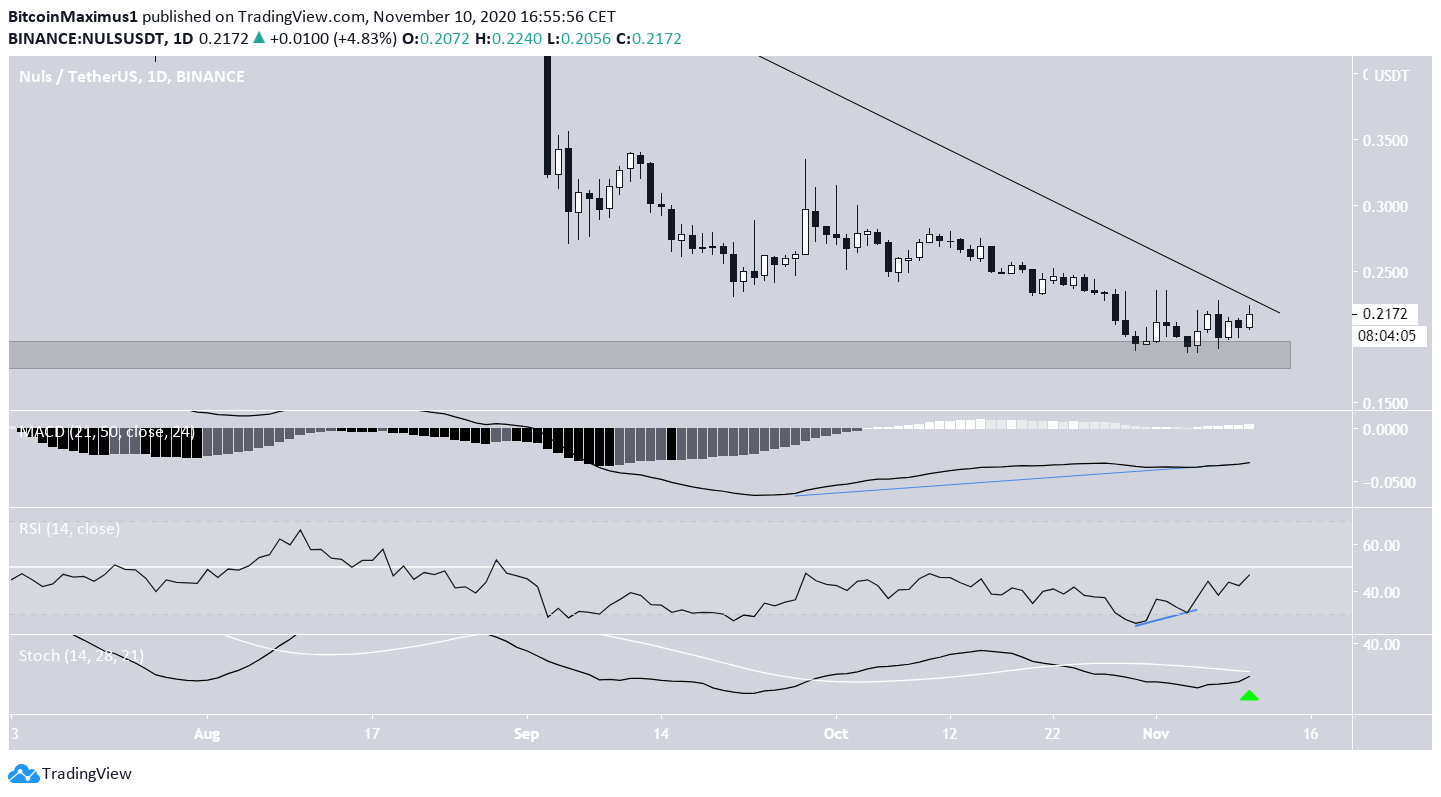
Technical indicators in the daily time-frame are turning bullish, but have not yet confirmed the trend reversal.
While there is a growing bullish divergence in both the MACD and the RSI, the former is below 0 and the latter is below 50. Furthermore, the Stochastic oscillator has yet to make a bullish cross.
A breakout from the descending resistance line would likely mean that the trend has turned bullish.
Wave Count
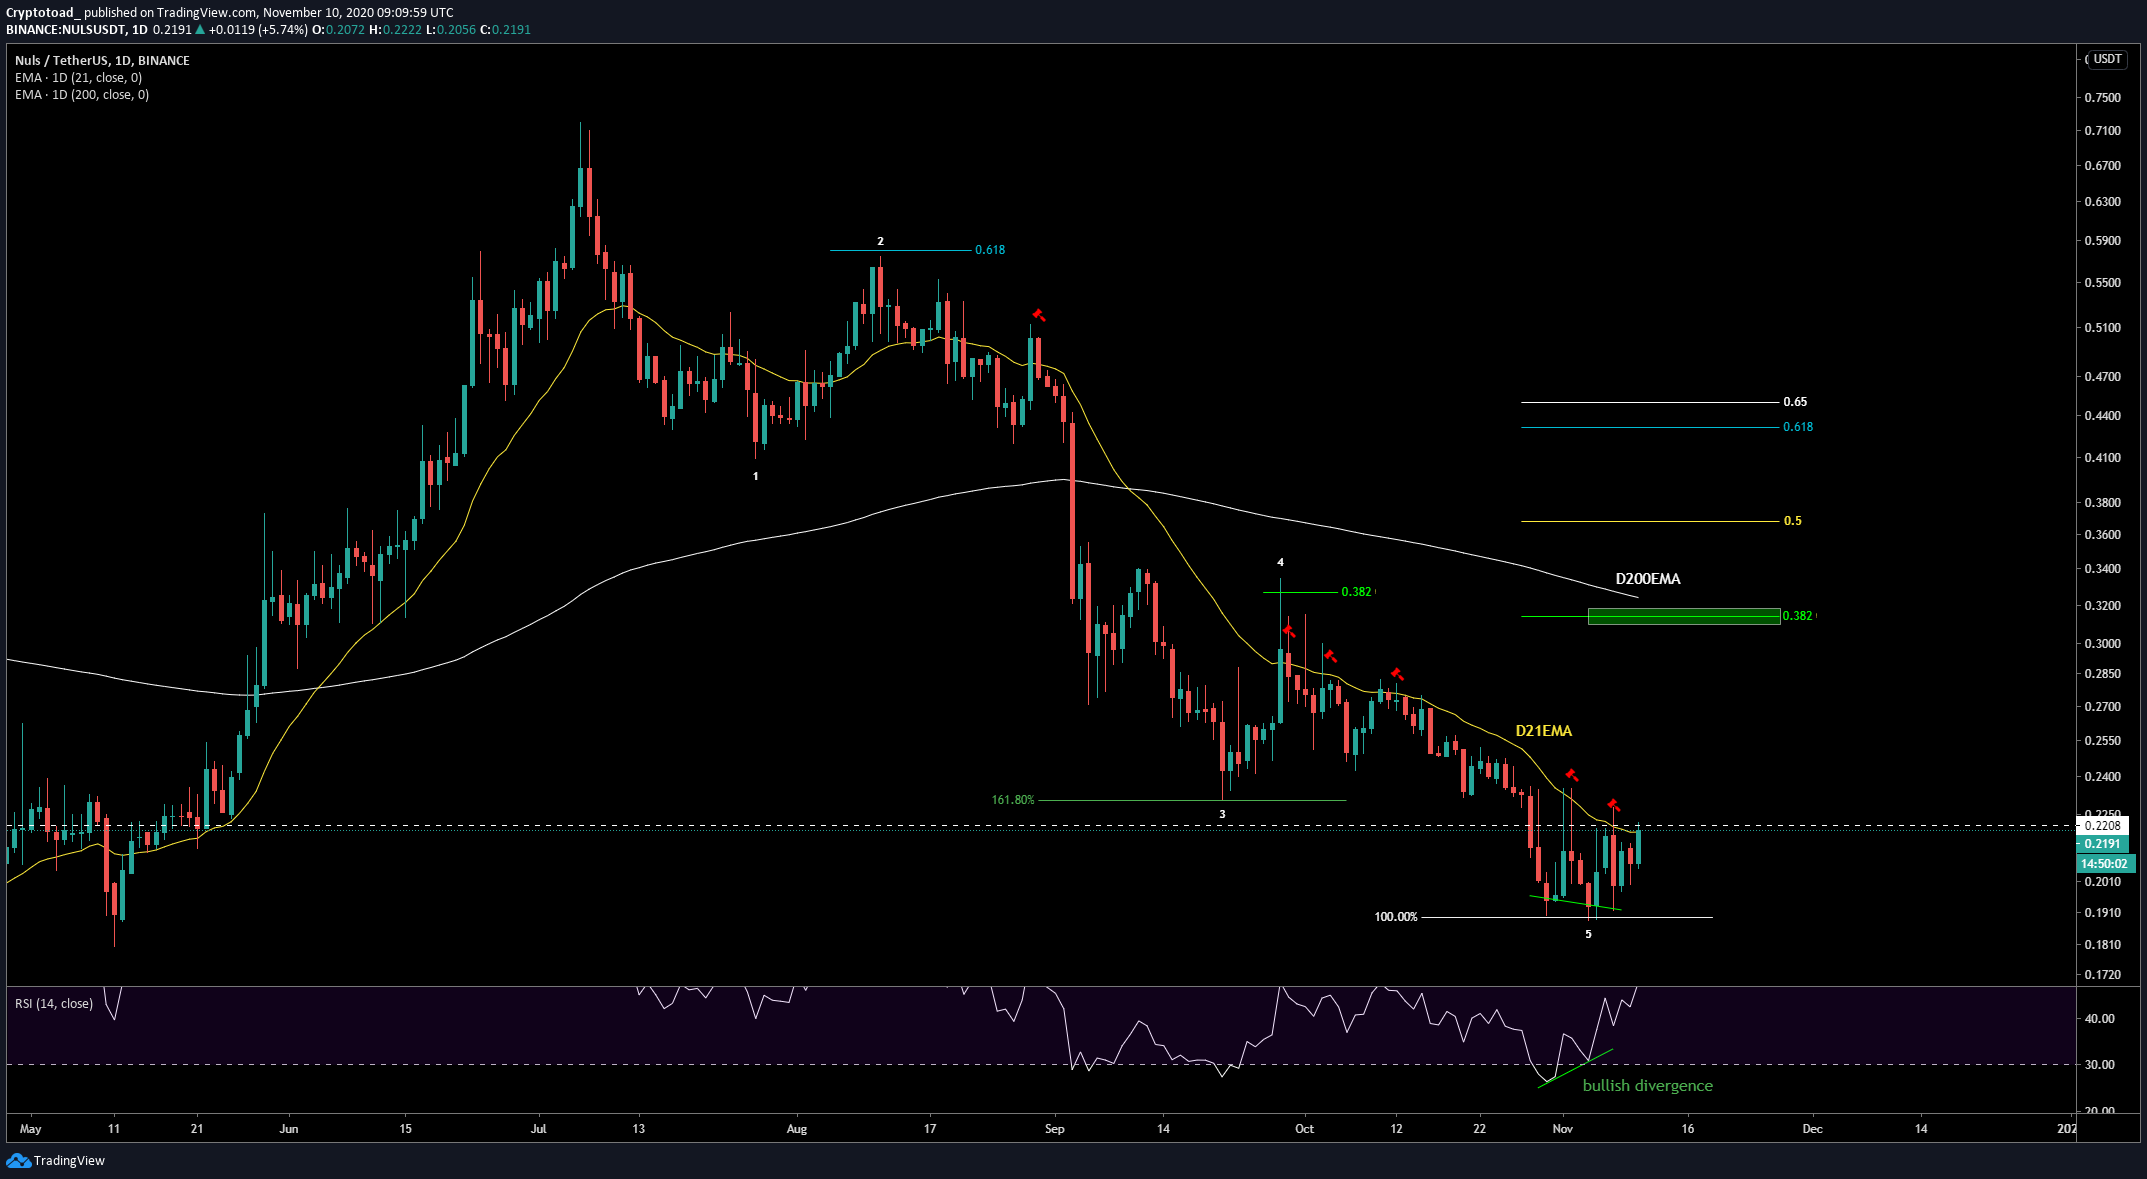
Cryptocurrency trader @mesawine1 stated that NULS has completed a bearish impulse, and predicted that once it can break over the current moving average resistance, it could increase all the way to $0.31.
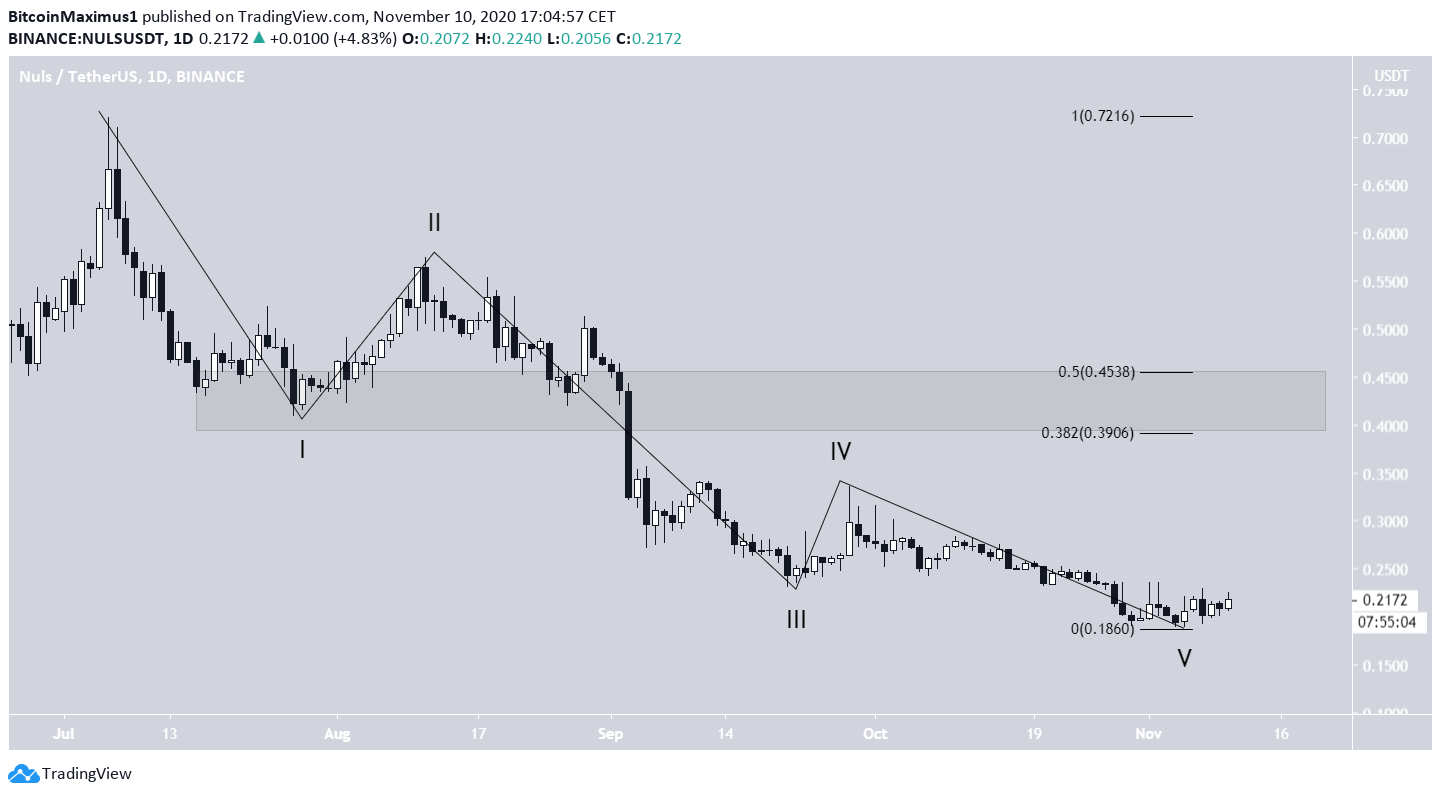
Since the July 6 high, it does seem like NULS has completed a bearish impulse (shown in black below) after reaching a low on Nov 4.
If the count is accurate, NULS should now create a corrective structure.
While it is too early to determine a target for a correction, the most likely area to act as the top would be found between $0.39-$0.45. This range is both a horizontal resistance level and the 0.382-0.5 Fib levels of the entire decrease.
Conclusion
The wave count and multiple technical indicators suggest that NULS has either reached or is very close to reaching a bottom. A breakout from the descending resistance line would likely confirm the trend reversal.
For BeInCrypto’s latest Bitcoin analysis, click here!
Disclaimer: Cryptocurrency trading carries a high level of risk and may not be suitable for all investors. The views expressed in this article do not reflect those of BeInCrypto.


