The NEO price has created a bearish reversal pattern near $23. While a short-term decline seems likely, the long-term trend remains bullish.
Double Top
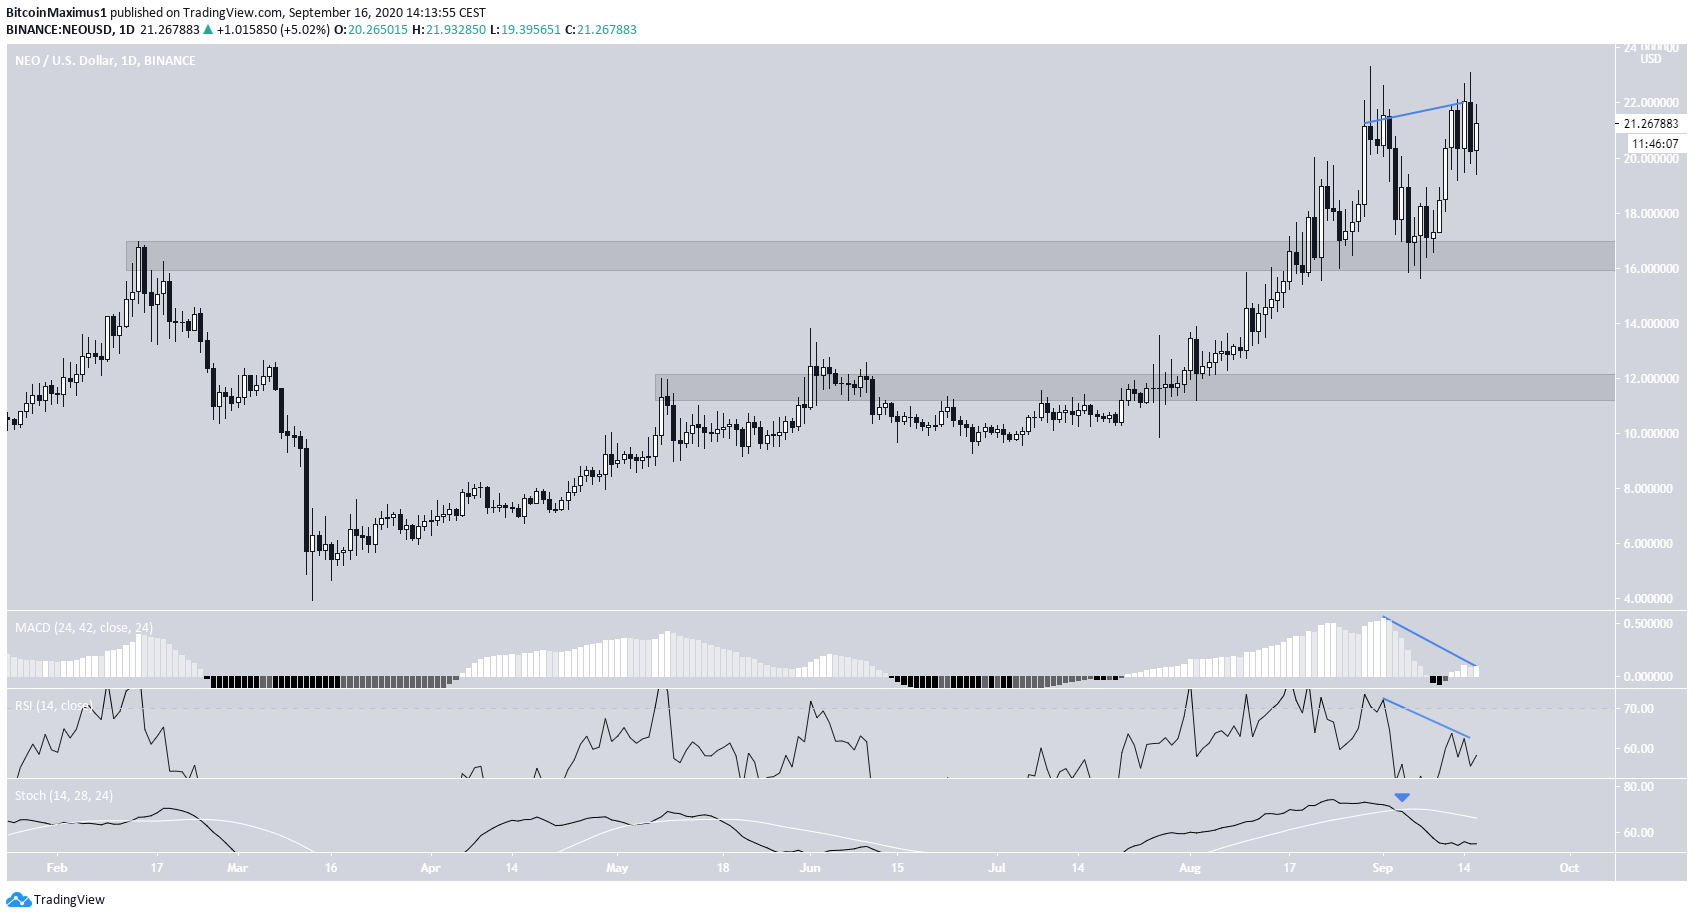
On August 30, the NEO price reached a high of $23.31. Throughout the following week, a considerable drop took place which encompassed the entire cryptocurrency market.
Despite this, the NEO price regained the entirety of its losses in a short period, reaching a high of $23.09 on September 25.
However, the price fell again shortly afterward, possibly creating a double top pattern. The pattern was combined with considerable bearish divergence on both the RSI and the MACD, while the Stochastic Oscillator made a bearish cross.
These are signs that the price is likely to move downwards. If it does, the closest support area is found at $16.50, while the next one is at $11.70.
Long-Term Support Levels
Cryptocurrency trader @Lomahcrypto stated that he is now a NEO maximalist since he believes that the price will move upwards in the long-term.
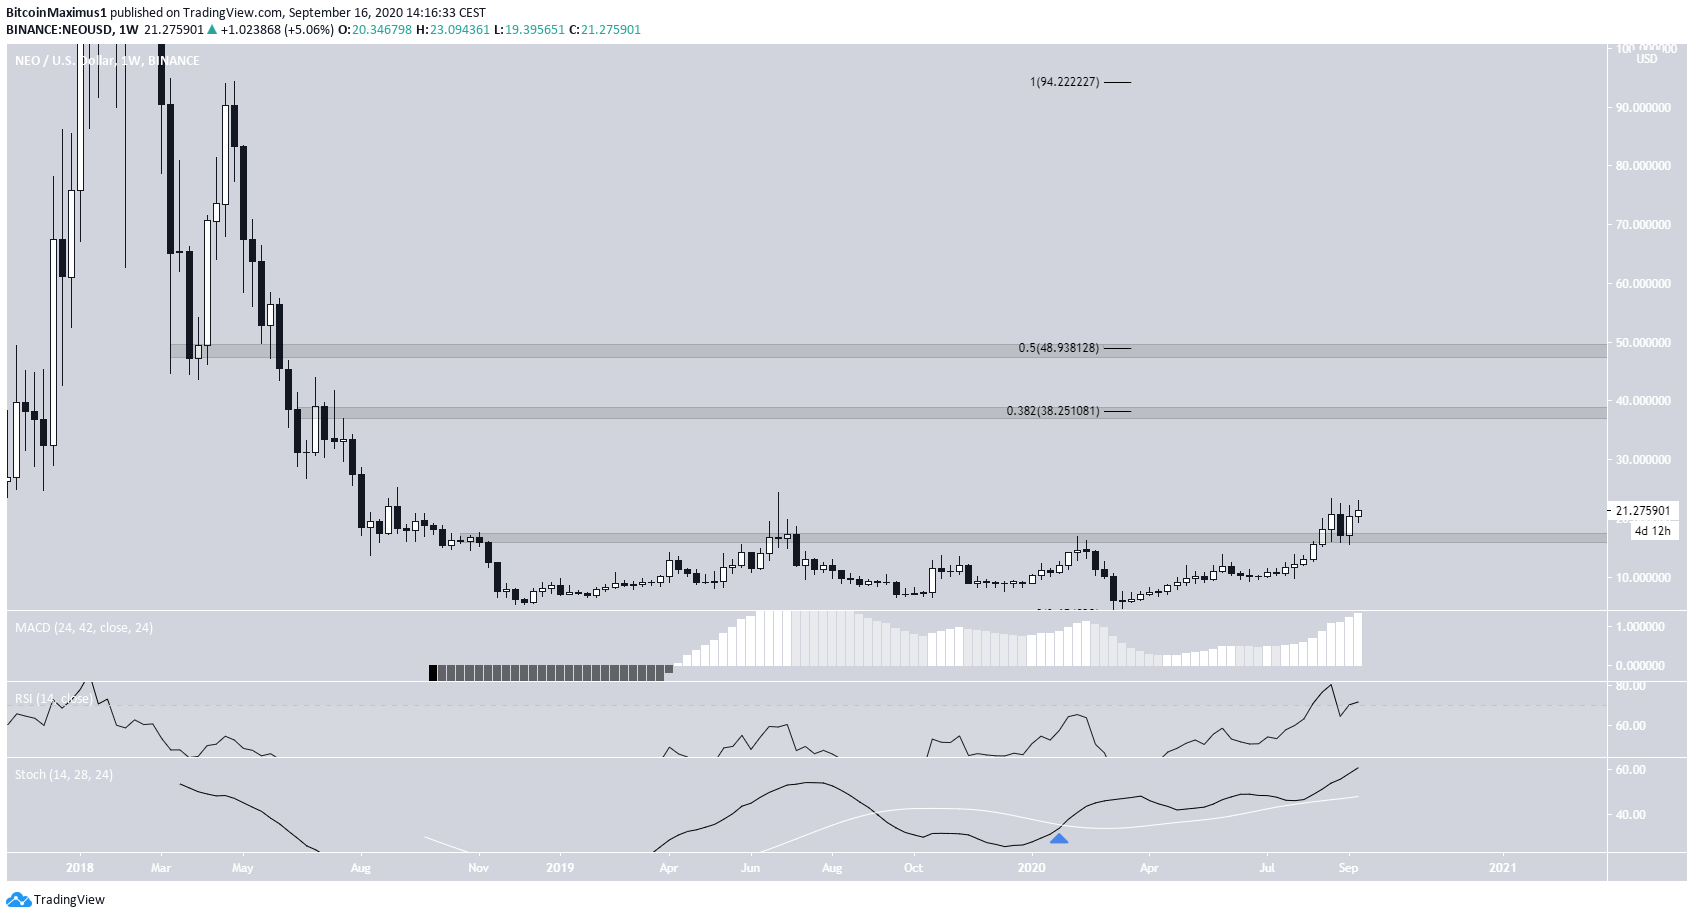
The weekly chart does indeed look bullish. The move mentioned in the previous section caused a breakout from the long-term resistance area at $16.50.
Because the price has already reached a close inside the previous wick resistance, the next resistance areas would be found all the way at $38 and $49, respectively. These are the 0.382 and 0.5 fib levels of the entire previous decline.
Technical indicators are bullish. The Stochastic Oscillator has made a bullish cross and has been rising alongside the MACD and RSI, even though the latter is overbought.
Therefore, the long-term trend for NEO remains bullish, despite the possibility of a short-term fall.
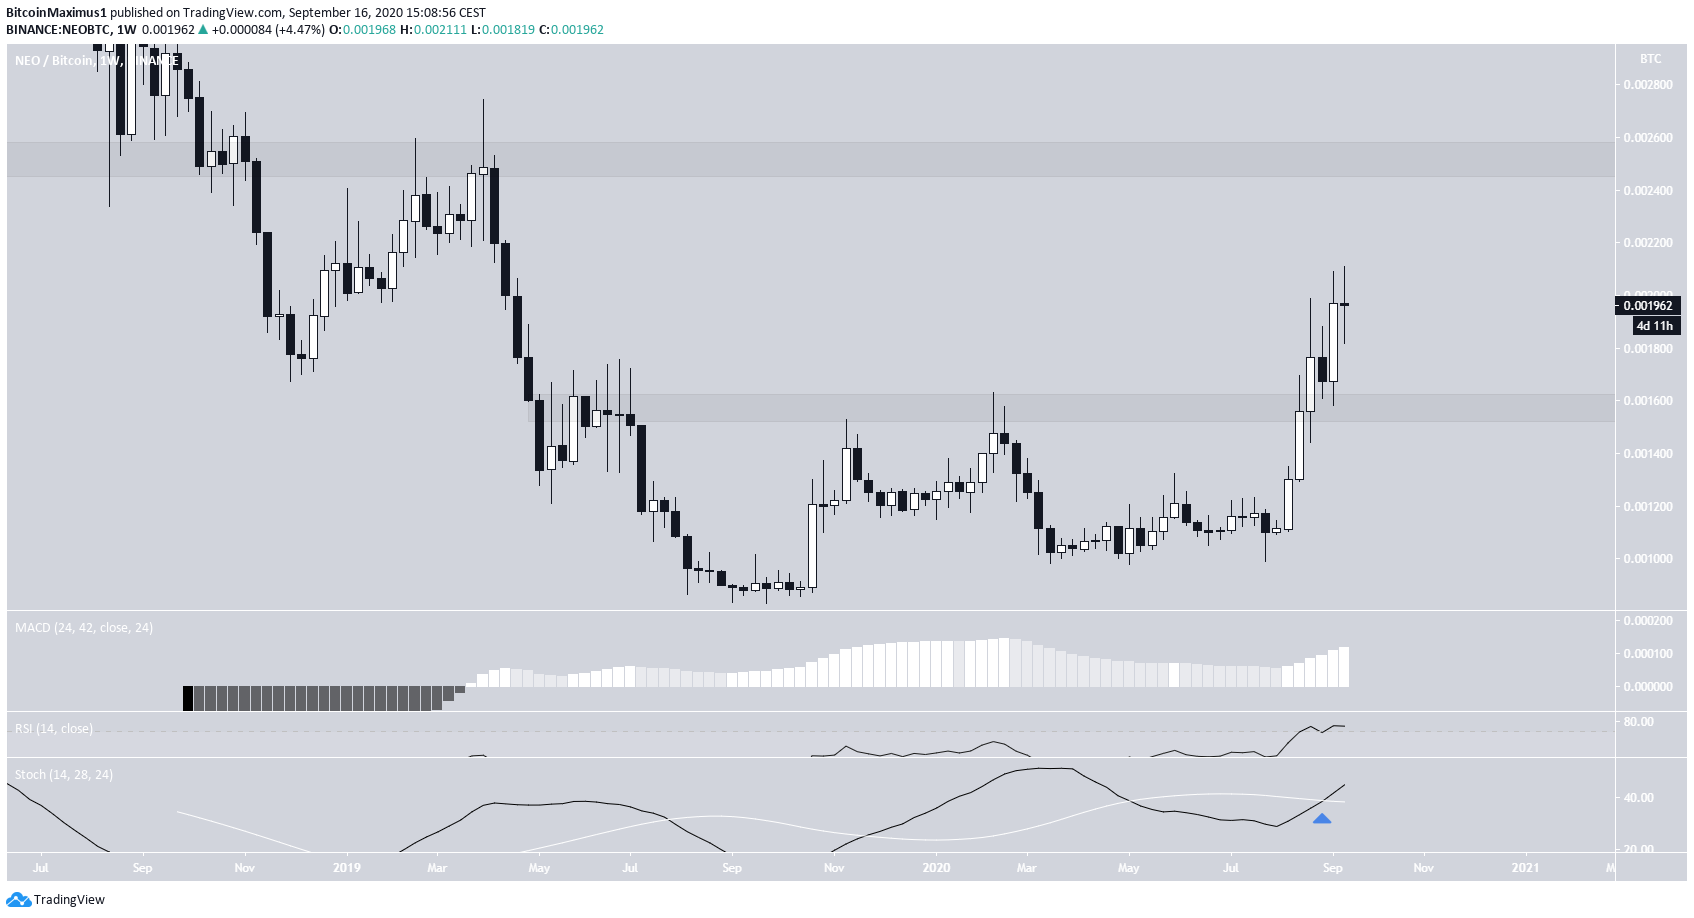
NEO/BTC
The NEO/BTC weekly chart looks similarly bullish. The price has broken out and validated the ₿0.00156 area as support, creating a bullish engulfing candlestick the following week. If the price continues moving upwards, the next resistance area would be found at ₿0.00256.
Technical indicators are bullish. All three of the RSI, MACD & Stochastic Oscillators are increasing, and the latter has already made a bullish cross. This is a sign that the price should continue moving upwards.