


After a long period of consolidation, the NEO price created a bullish engulfing candlestick on February 2 — at one point, increasing by 12 percent.
NEO Price Highlights
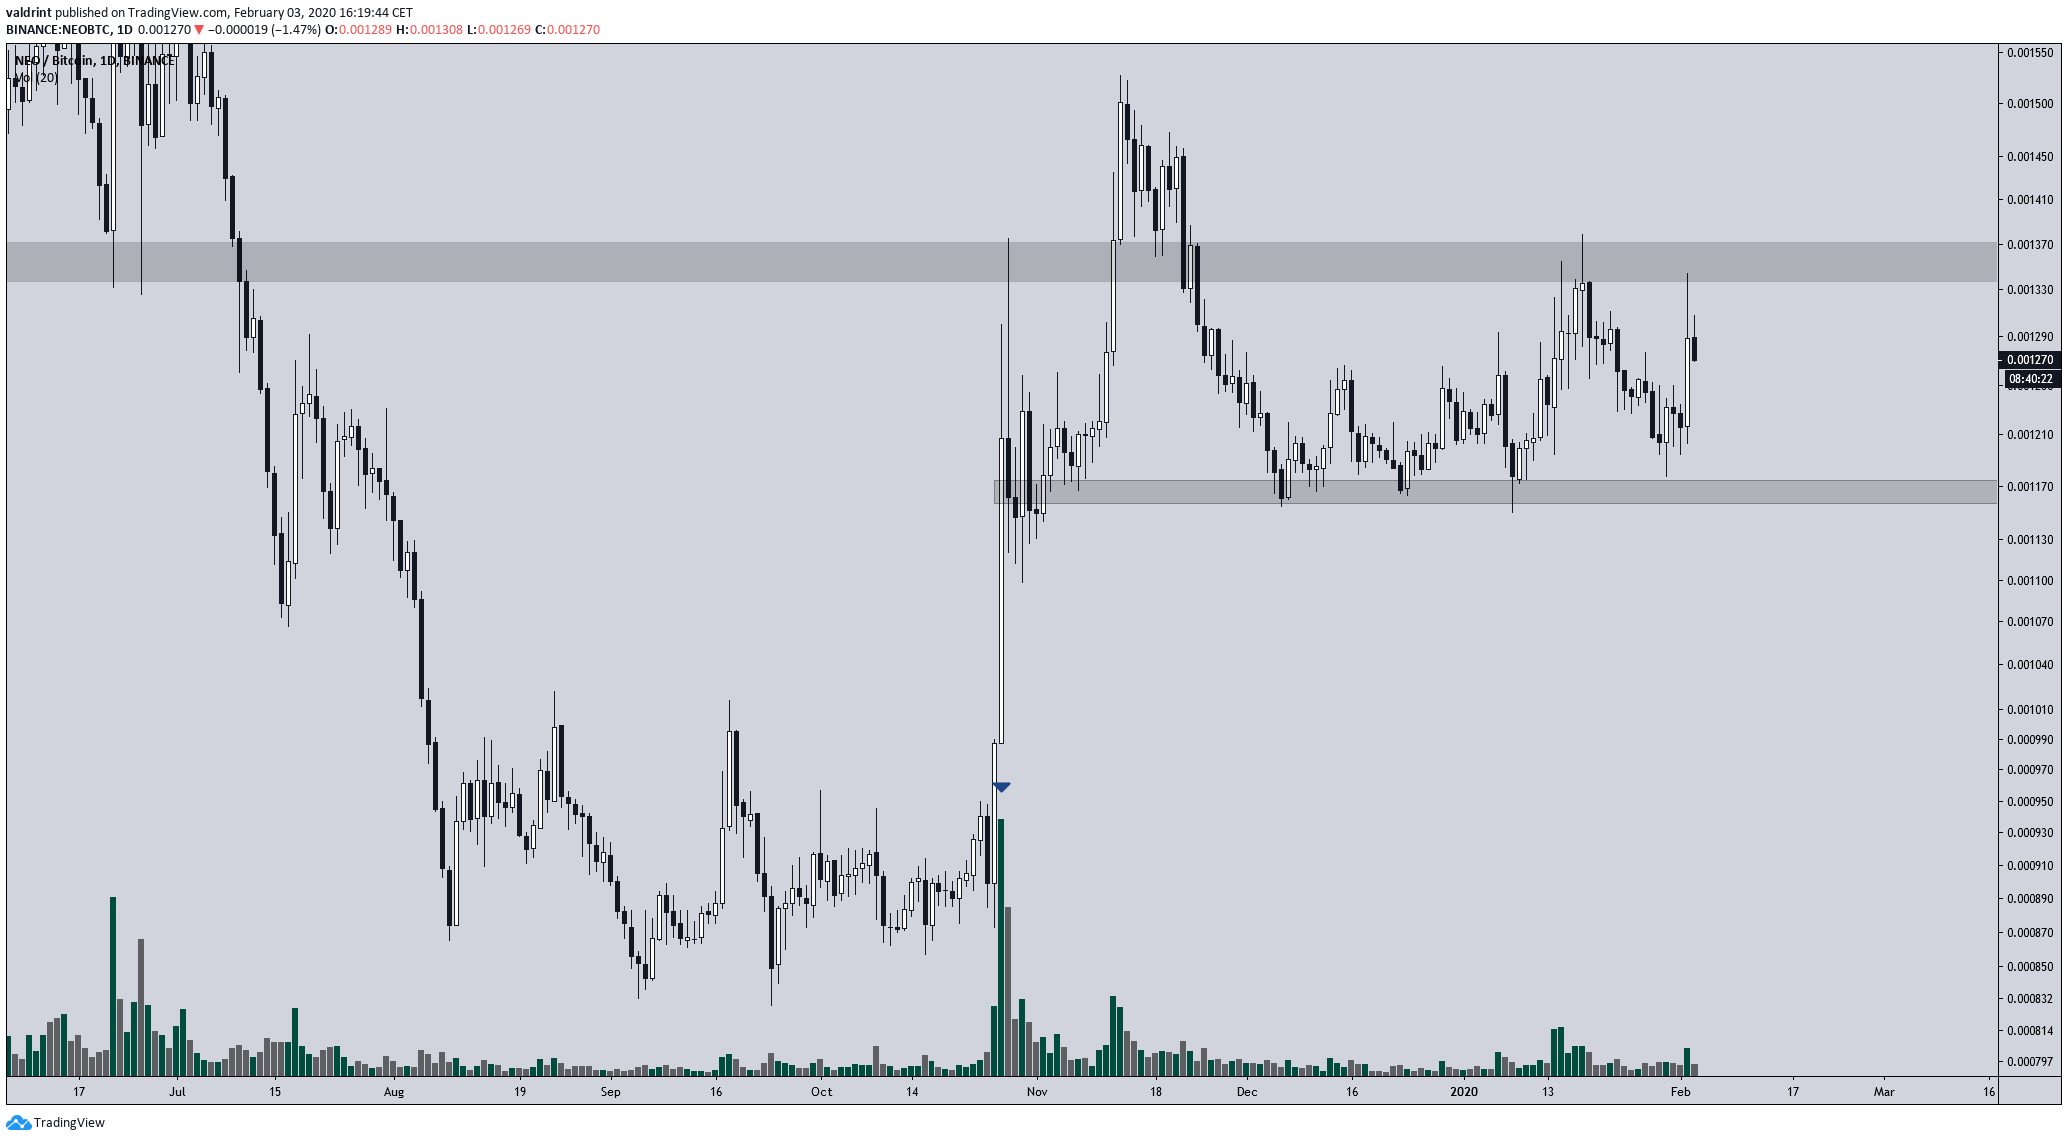
- The NEO price is trading inside a range between 1160 and 1360 satoshis.
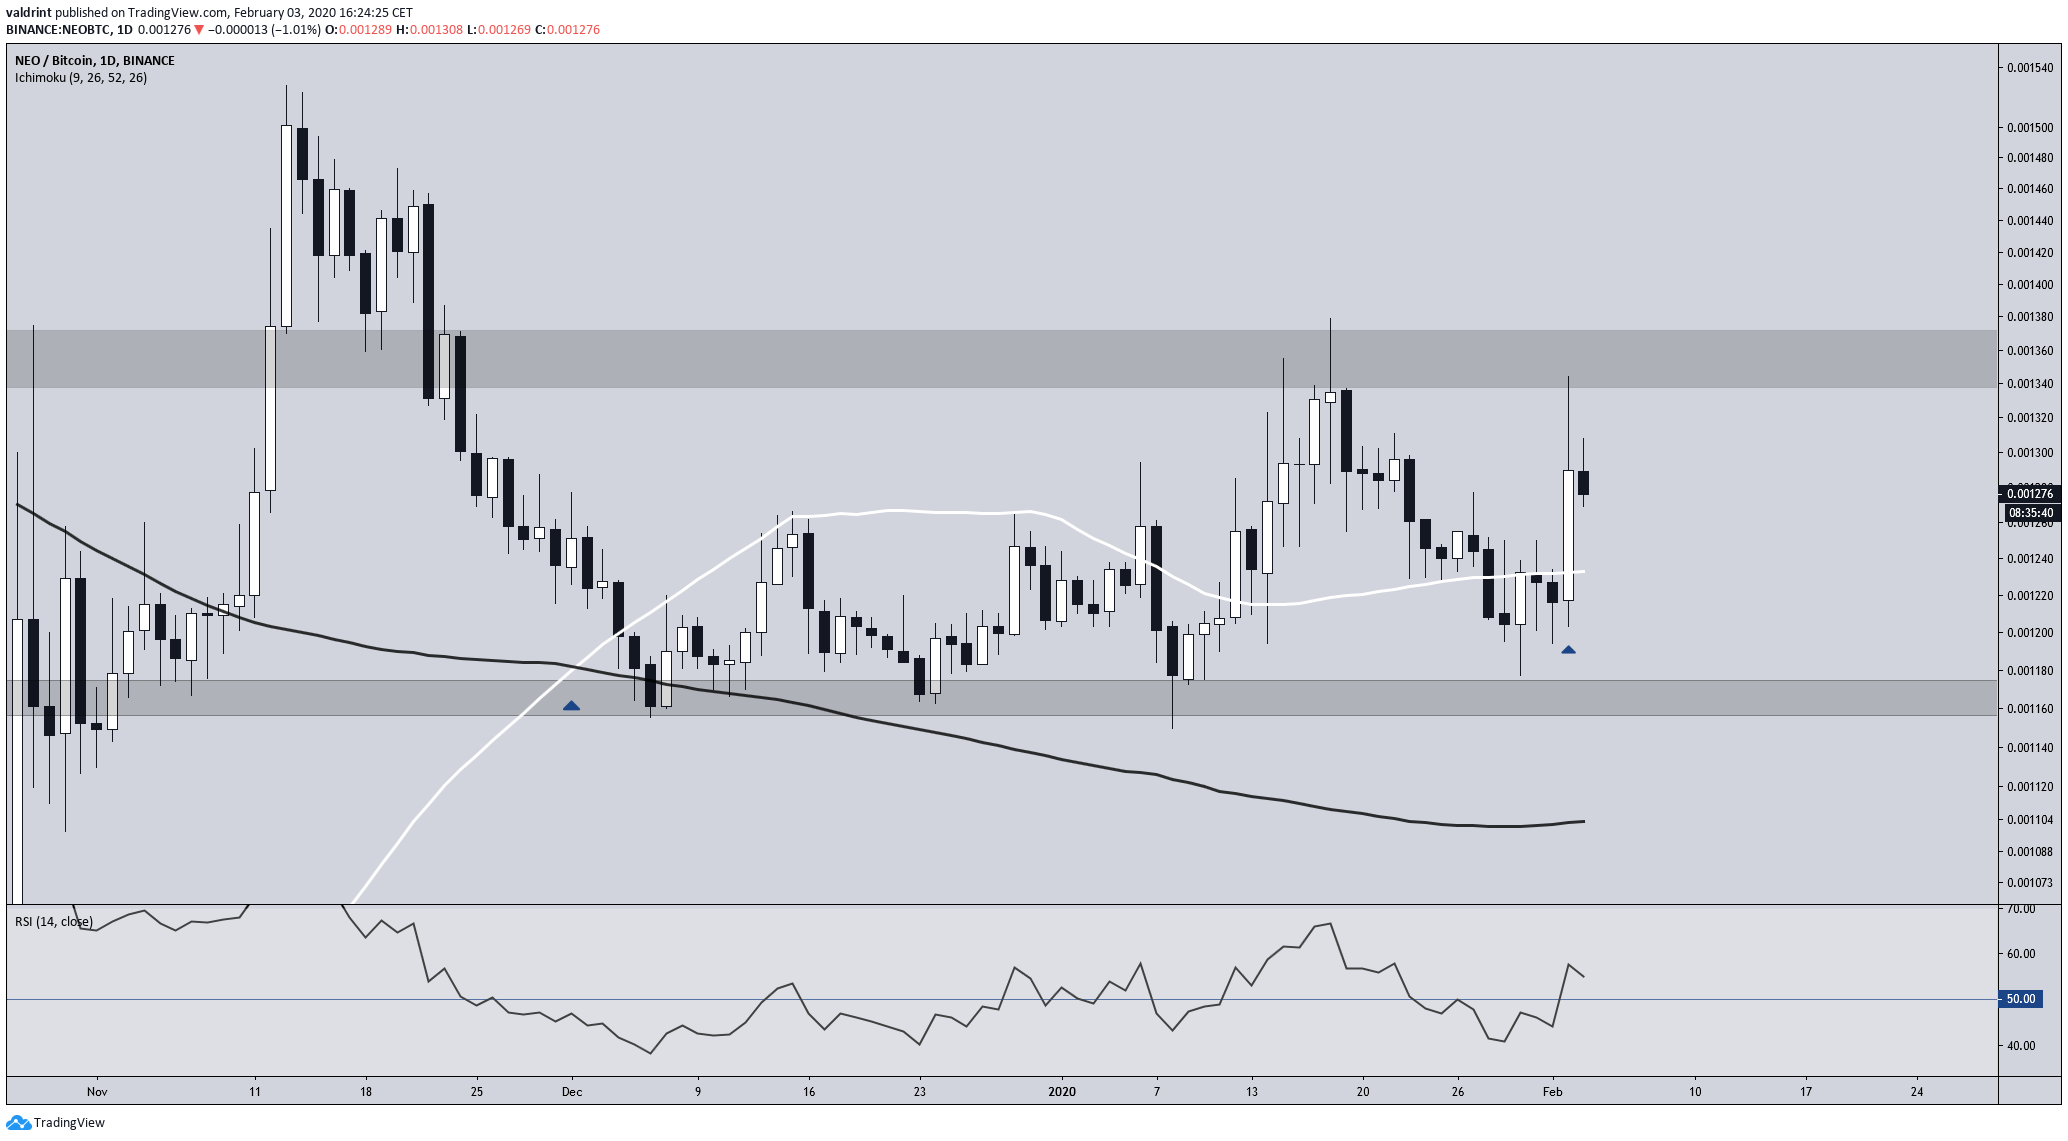
- It is trading above its important daily moving averages.
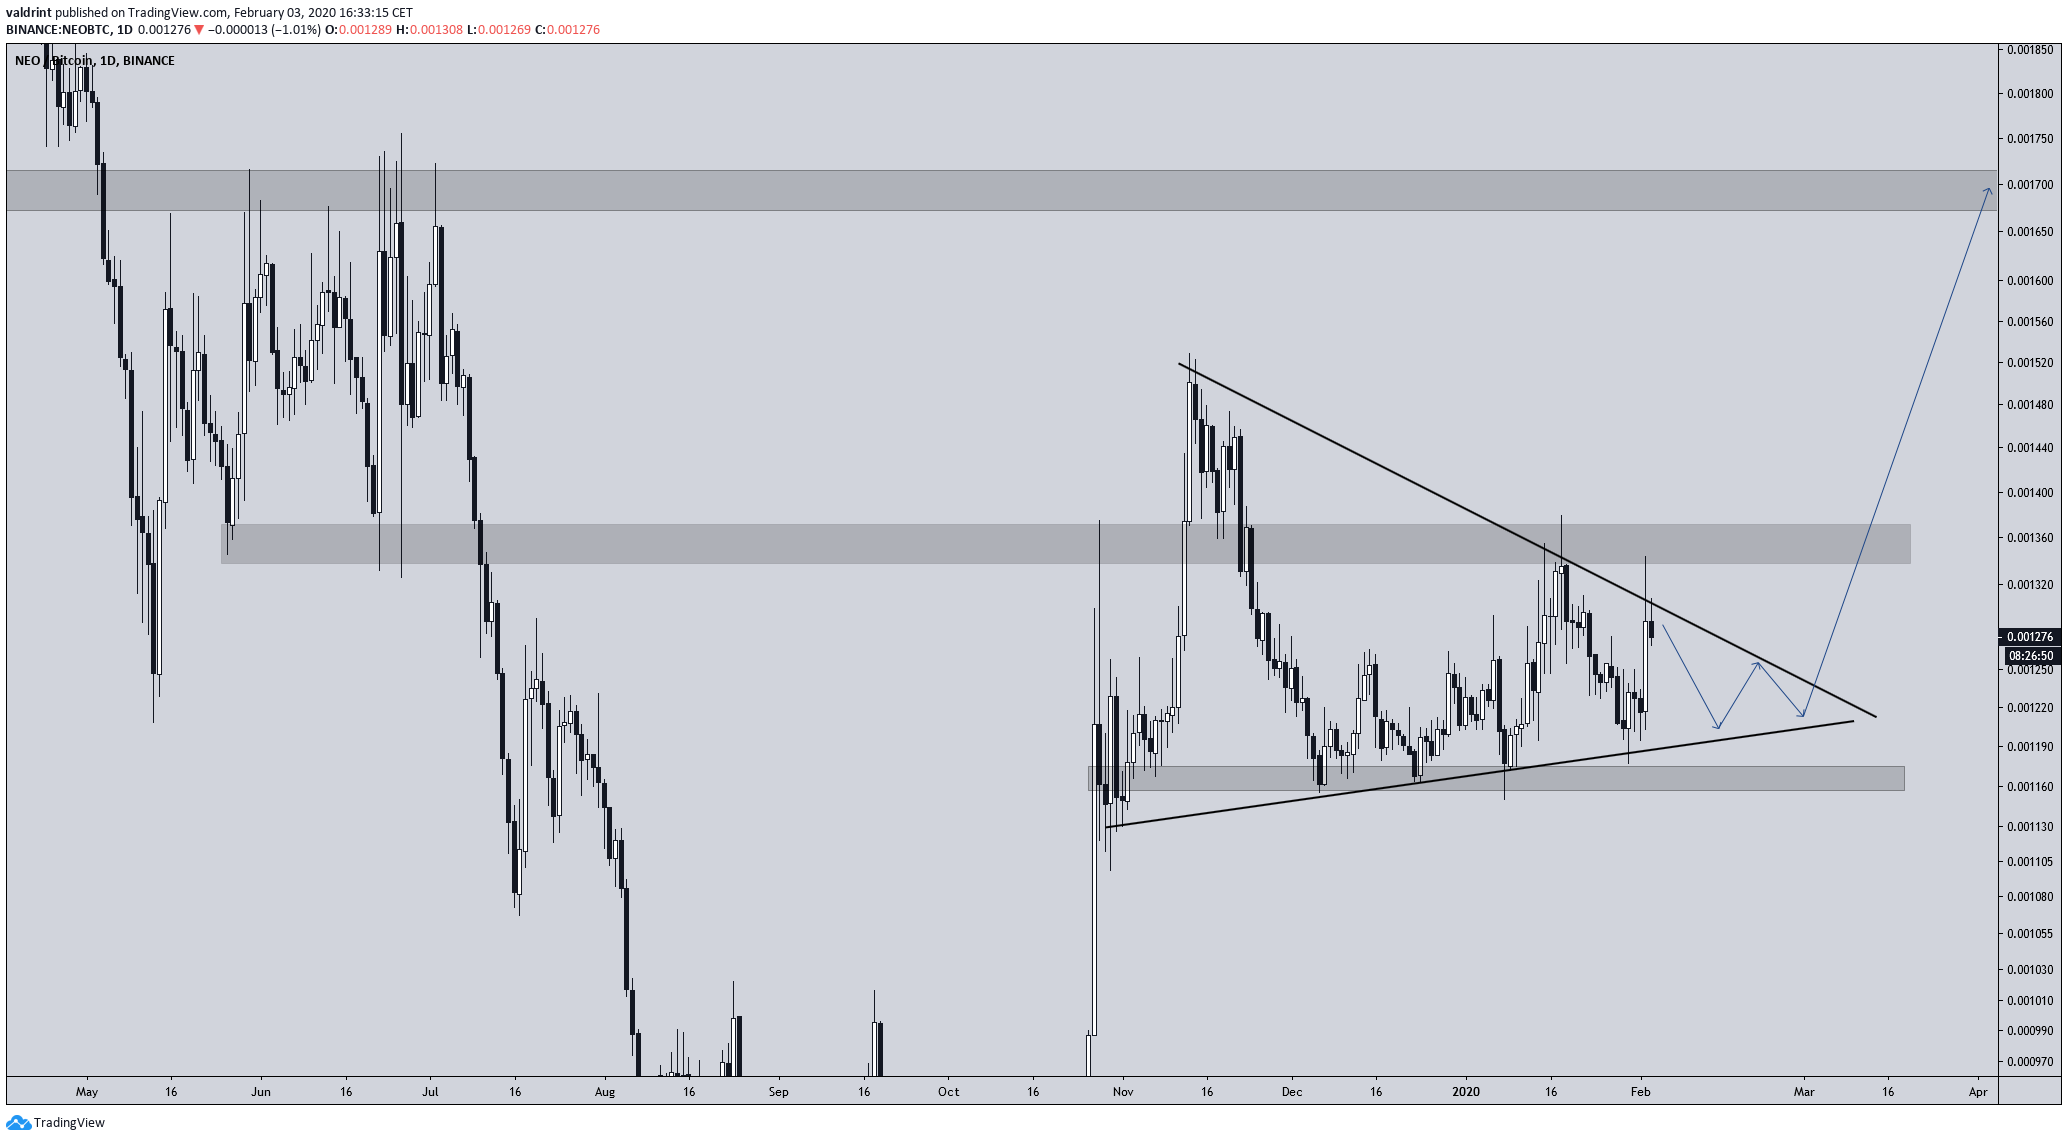
- The price has possibly created a symmetrical triangle.
- The next target is found at 1700 satoshis.
Trader @CryptoLeee outlined the NEO price chart with the caption “It’s alive” since NEO has finally made some gains after a long period of virtually no movement.
ITS ALIVE! $NEO pic.twitter.com/PpcXjUHOX7
— cryptolee (@CryptoLeee) February 2, 2020
Is this the continuation of the bullish market cycle for NEO, or will the price fall back to consolidating? Keep reading below if you want to find out.
Trading Range
On October 27, 2019, the NEO price created a bullish engulfing candlestick, which was the catalyst of the upward movement that followed. Since this move was combined with massive volume, it gained considerable legitimacy.
The price reached a high of 1528 satoshis on November 13 but began to decrease afterward.
Since then, NEO has created a trading range between 1160 and 1360 satoshis.
As for the technical indicators, a bullish cross between the 50- and 200-day moving averages (MAs) transpired on December 1 but did not have much effect on the price. In addition, the daily RSI has freely crossed above and below the 50 numerous times, suggesting that the price is in a period of consolidation.
The bullish engulfing candlestick that led to the tweet transpired on February 2, 2020, causing the price to move above its 50-day MA. However, once it reached the upper limit of its range, the price created a long upper wick and decreased.
Symmetrical Triangle
While the trading range is confirmed, there is a possible symmetrical triangle developing. The presence of this pattern increases the chances of a breakout since the symmetrical triangle is considered a continuation pattern and has been created after an upward move.
However, the pattern is not projected to end until March — indicating that the period of consolidation could linger on and the NEO price is not “alive” yet.
A price breakout would likely cause NEO to move above its trading range, due to the close proximity between the resistance line of the triangle and the range. If a breakout transpired, which looks likely, the next target for the price would be given at 1700 satoshis.
This setup would be invalidated by a breakdown below the support of the range at 1160 satoshis.
To conclude, the NEO price has been decreasing since the rapid upward movement of October/November 2019. We believe the correction will end by the beginning of March at the latest and the price will head towards 1700 satoshis.


