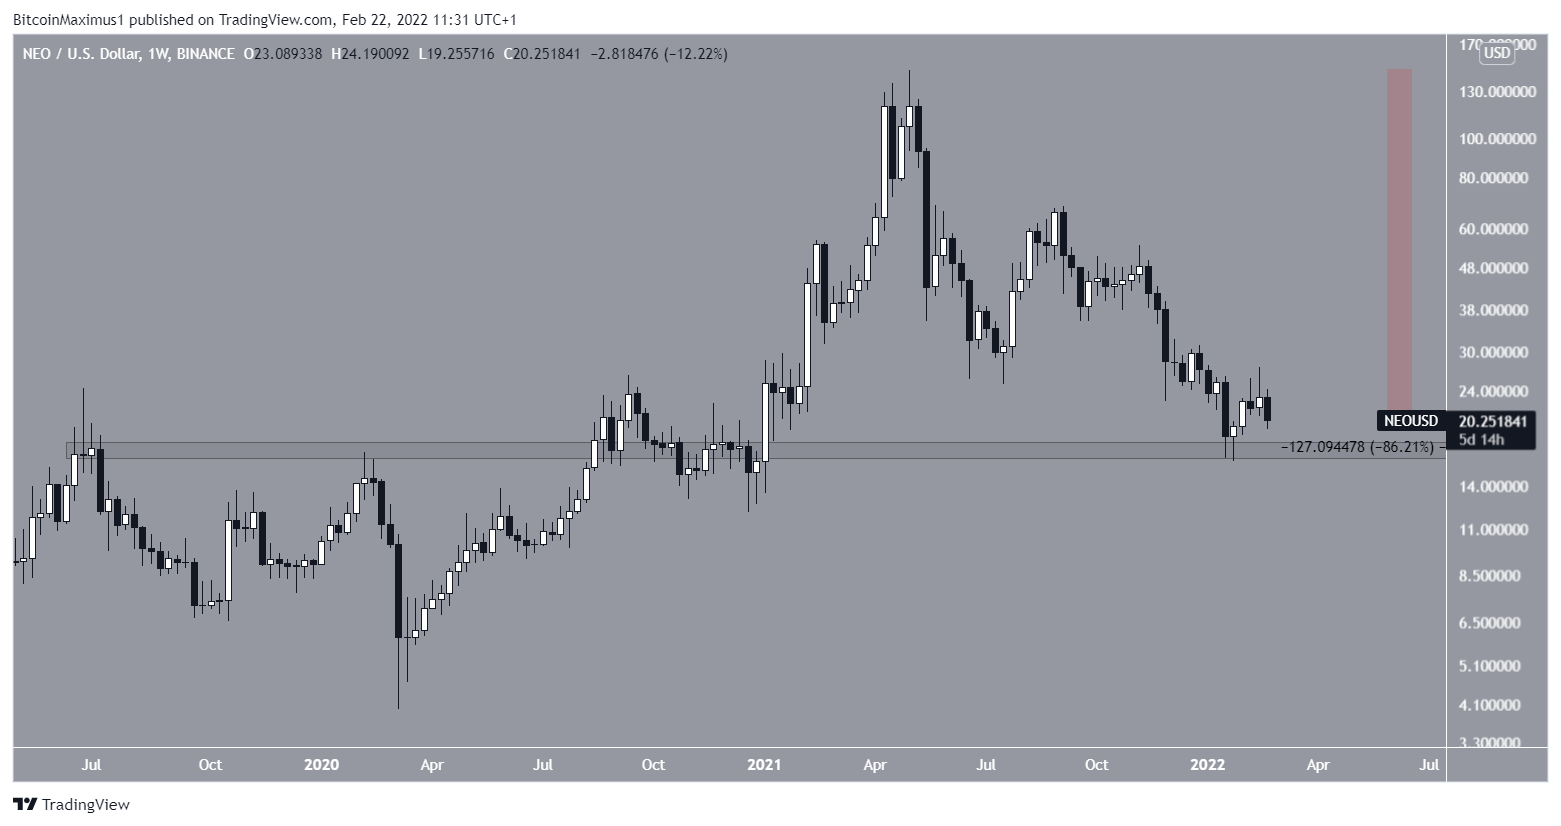
NEO has managed to hold on above a long-term horizontal support level but has broken down from both a diagonal and horizontal short-term level.
NEO has been falling since May 7, 2021, when it reached a high of $246. The decrease continued until a local low of $16.13 was reached on Jan 24.
During the week of Jan 24-31, the price bounced at the $17.20 horizontal support area. Previously, this level had acted as resistance since April 2019, prior to a breakout in January 2021.
However, the upward movement was short-lived and NEO is approaching the $17.20 area once again.
So far, it has decreased by 86% measuring from the aforementioned all-time high.
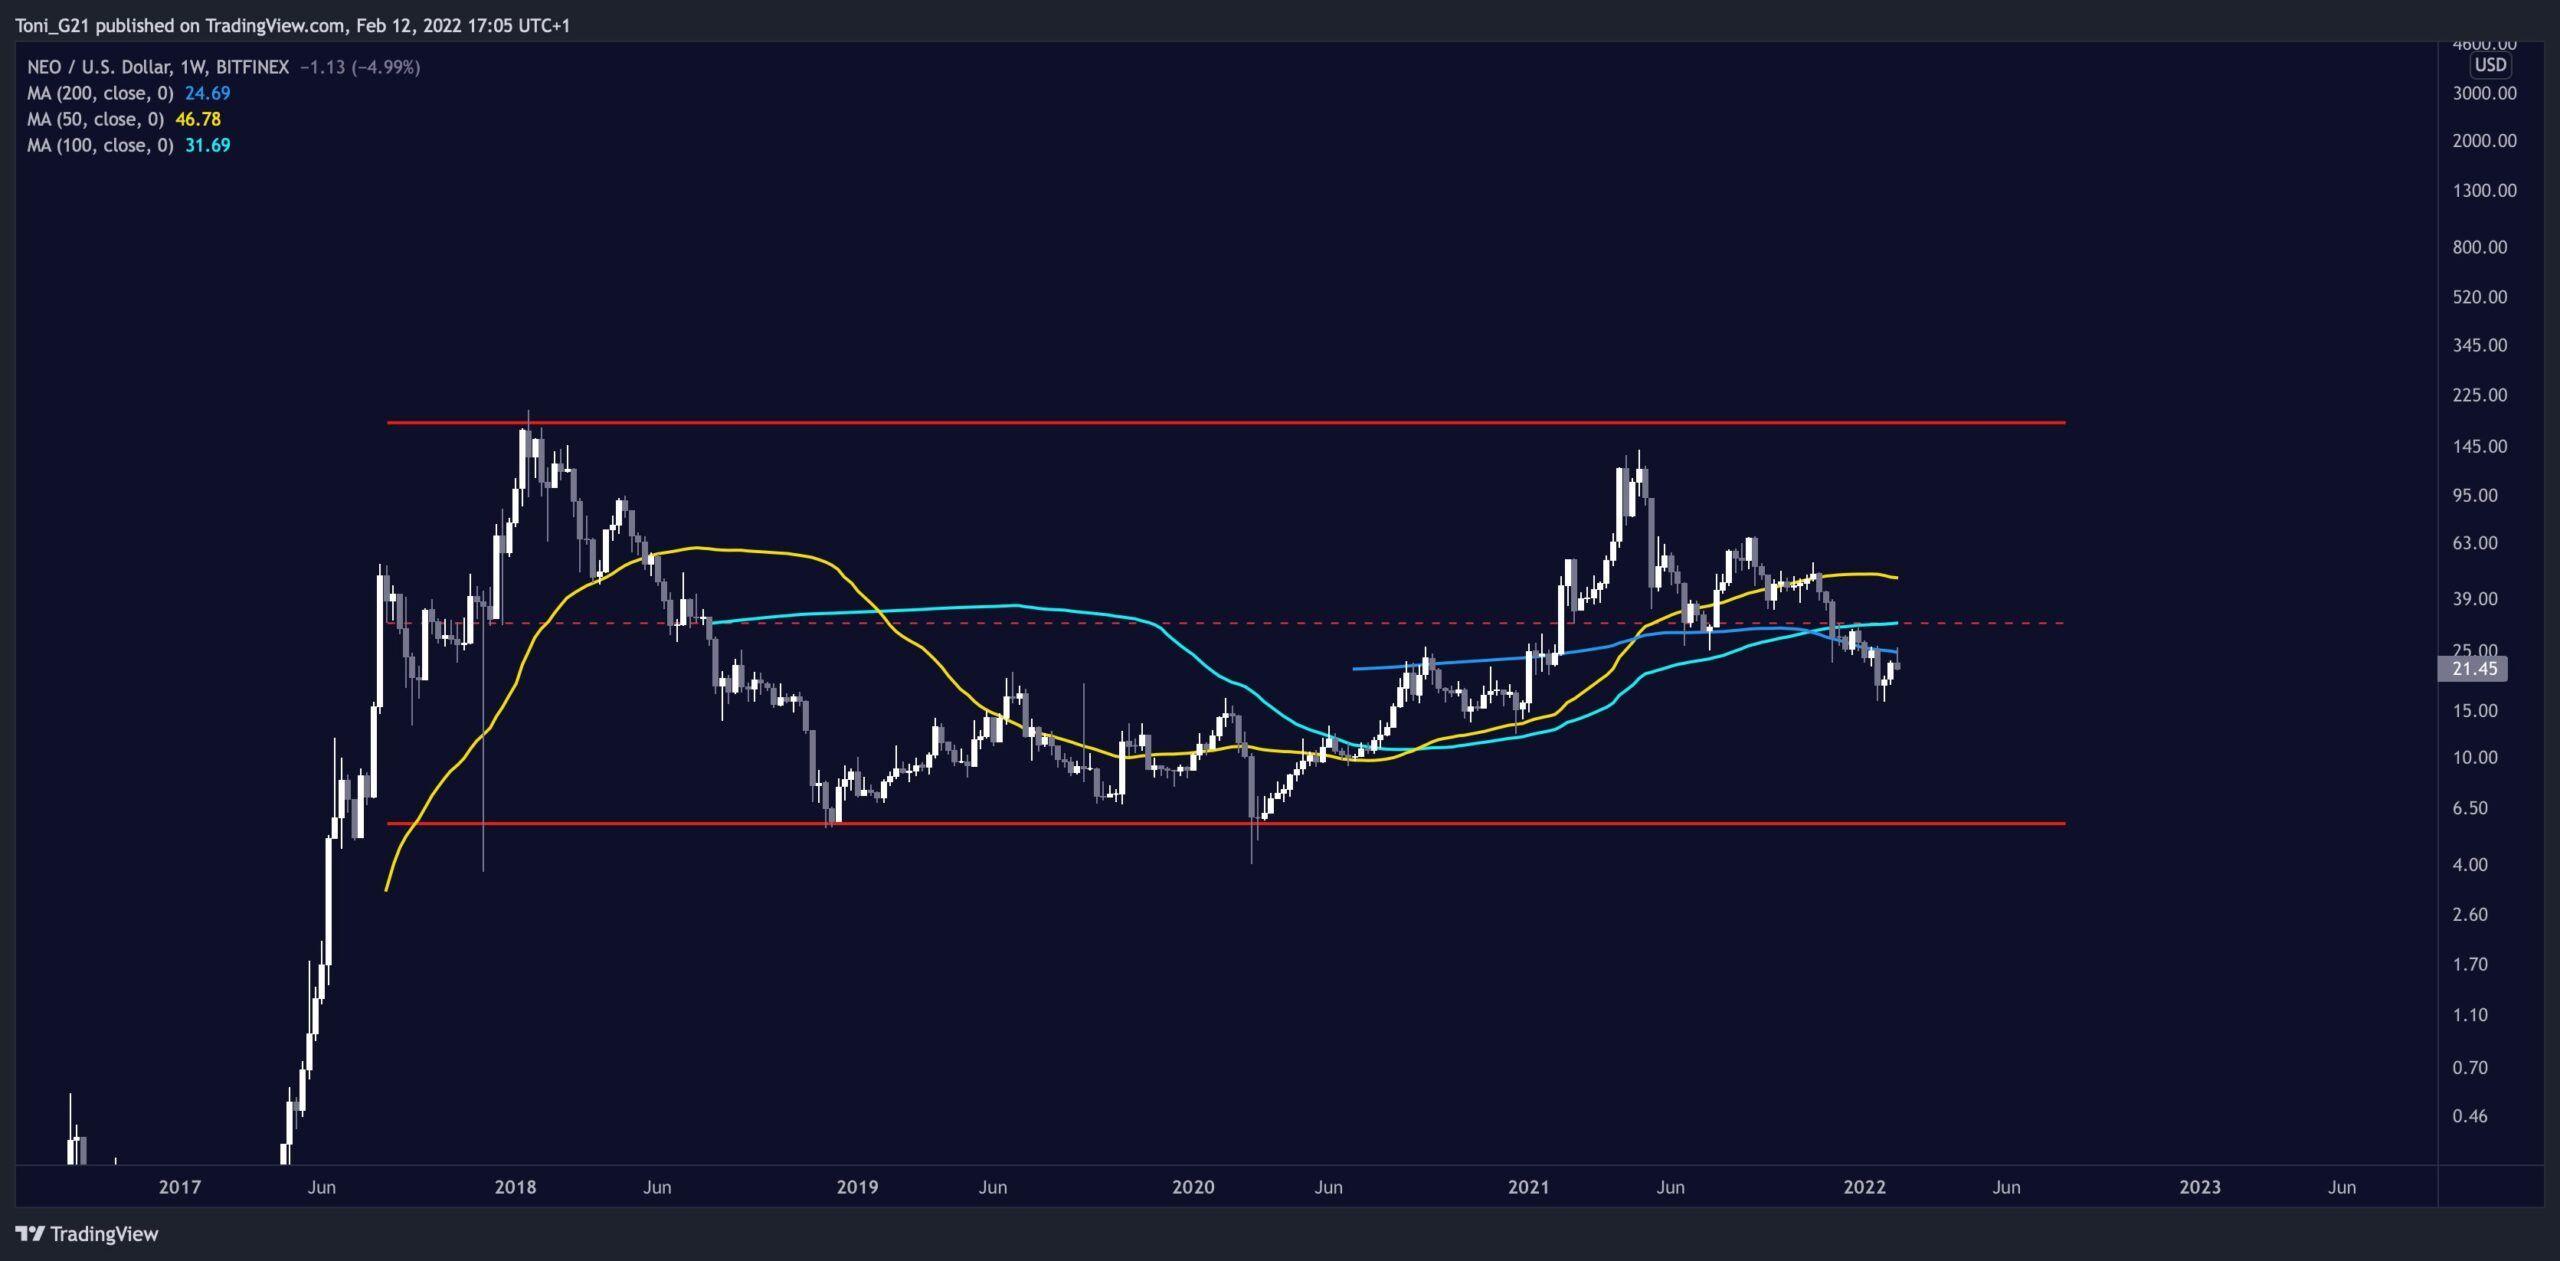
Cryptocurrency trader @ToniGhinea tweeted a NEO chart, stating that the price has been accumulating over the past two years. If it decreases below the long-term support level, it could fall all the way to the 2020 lows below $6.
Ongoing decrease
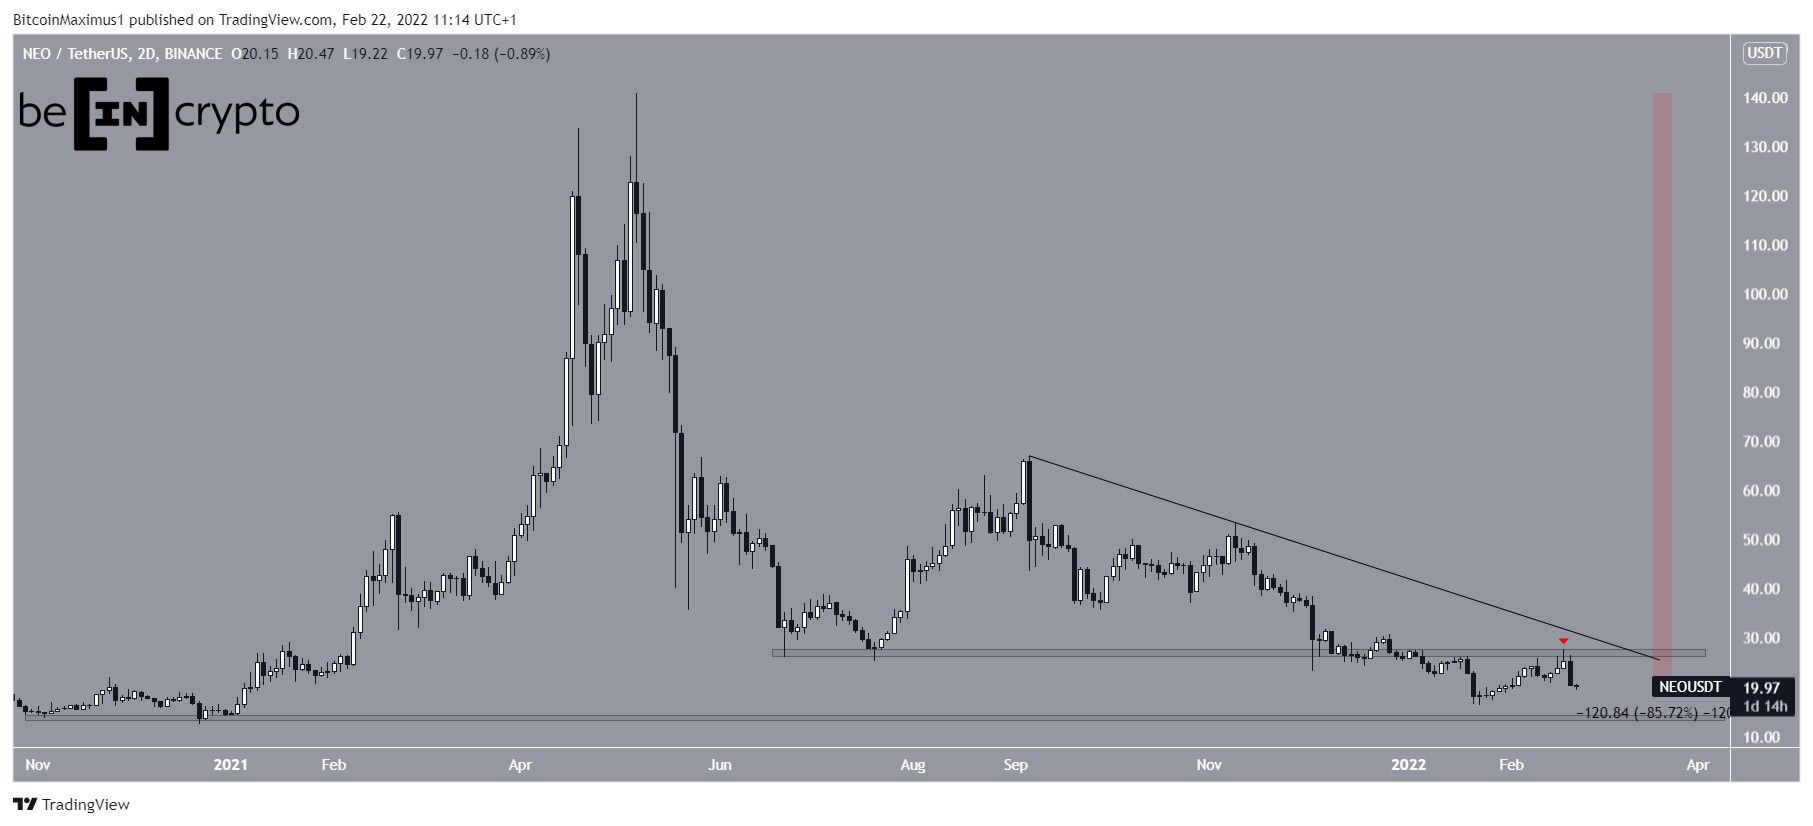
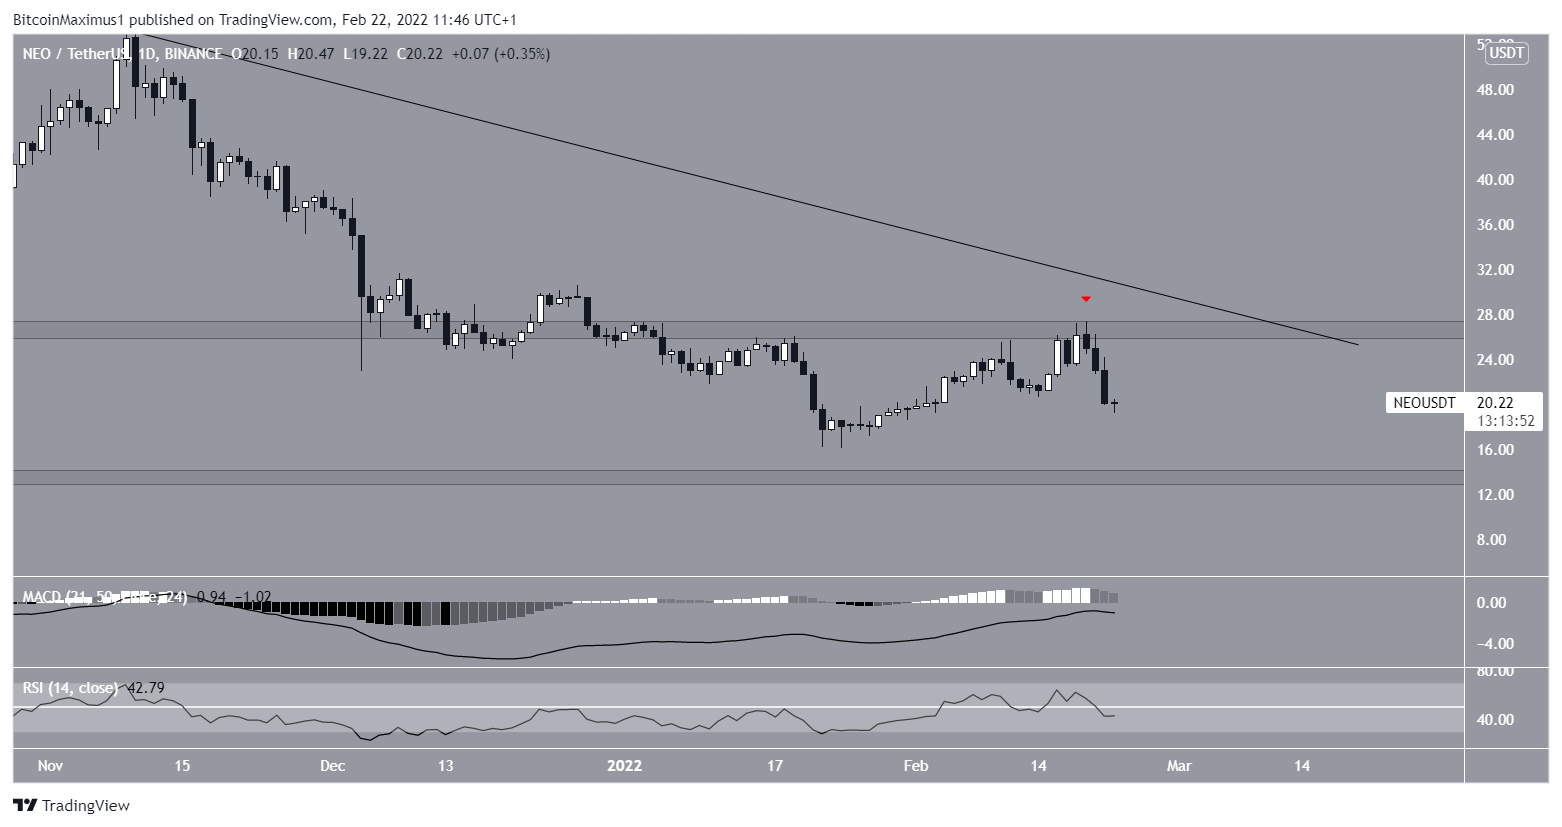
The daily chart shows that NEO has been following underneath a descending resistance line since Sept 1. While following this pattern, it broke down from the $26.50 horizontal support area on Jan 5 and validated it as resistance on Feb 18 (red icon).
If the downward movement continues, the next closest support area would be found at $13.50.
Technical indicators in the daily time frame are leaning on bearish.
This is evident by the decreasing MACD and RSI.
The MACD, which is created by short and long-term moving averages (MA), is negative and falling. This means that the short-term MA is slower than the long-term average and is a sign of bearish trends.
The RSI, which is a momentum indicator, is below 50. This is also a sign of a bearish trend.
Therefore, readings from the daily time frame indicate that a decrease toward $13.50 is likely.
Short-term NEO movement
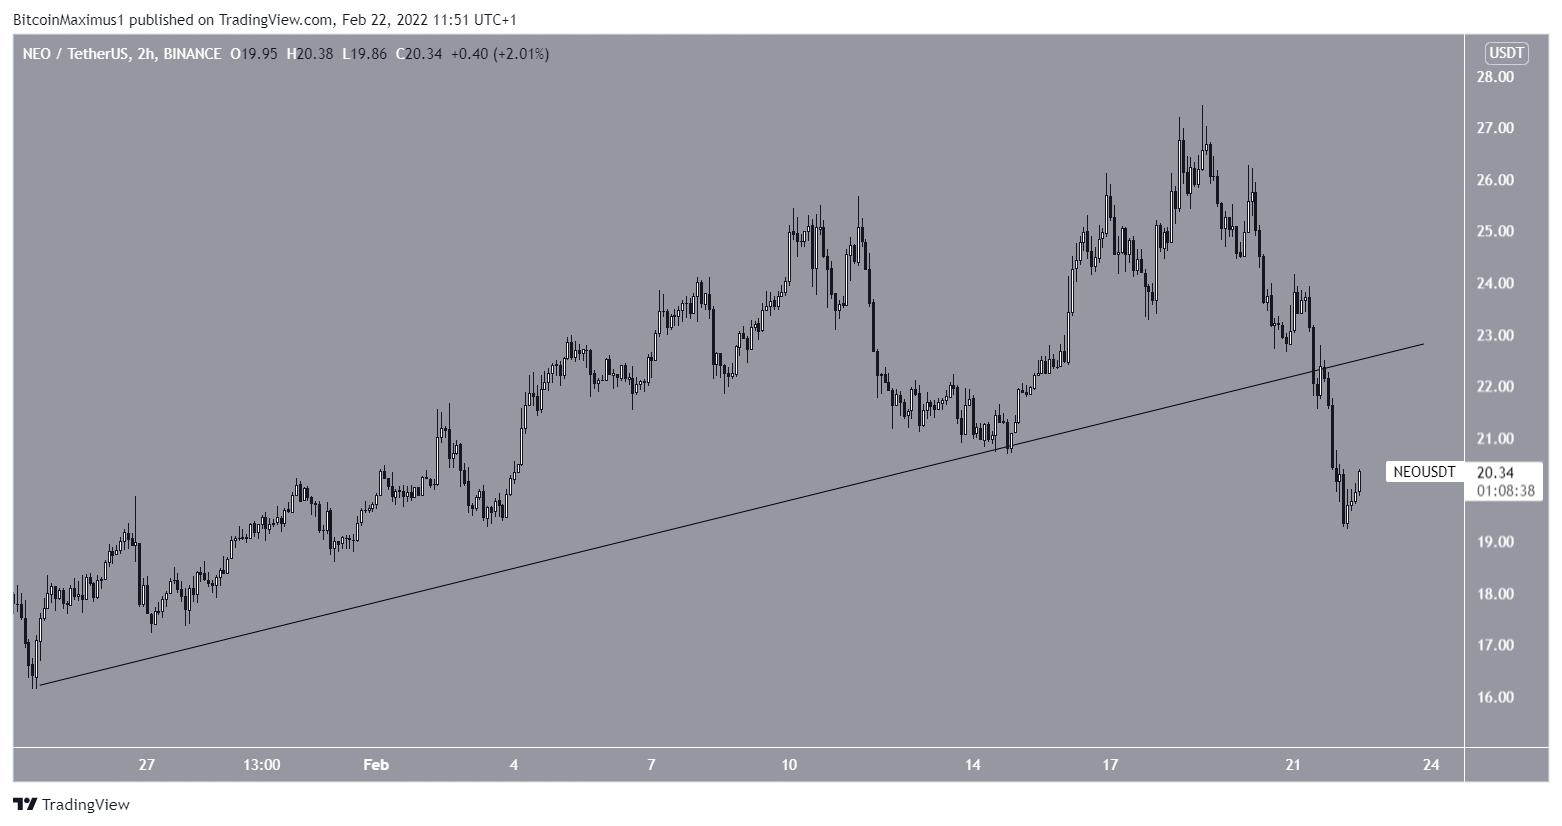
The two-hour chart shows that NEO has broken down from an ascending support line.
While an upward movement that would cause validation of this line is possible, the trend remains bearish until this line is reclaimed.