


The Neo (NEO) price has been increasing since Nov 5 but was rejected by a horizontal resistance area yesterday.
The price created a higher low afterward and is expected to continue moving upwards.
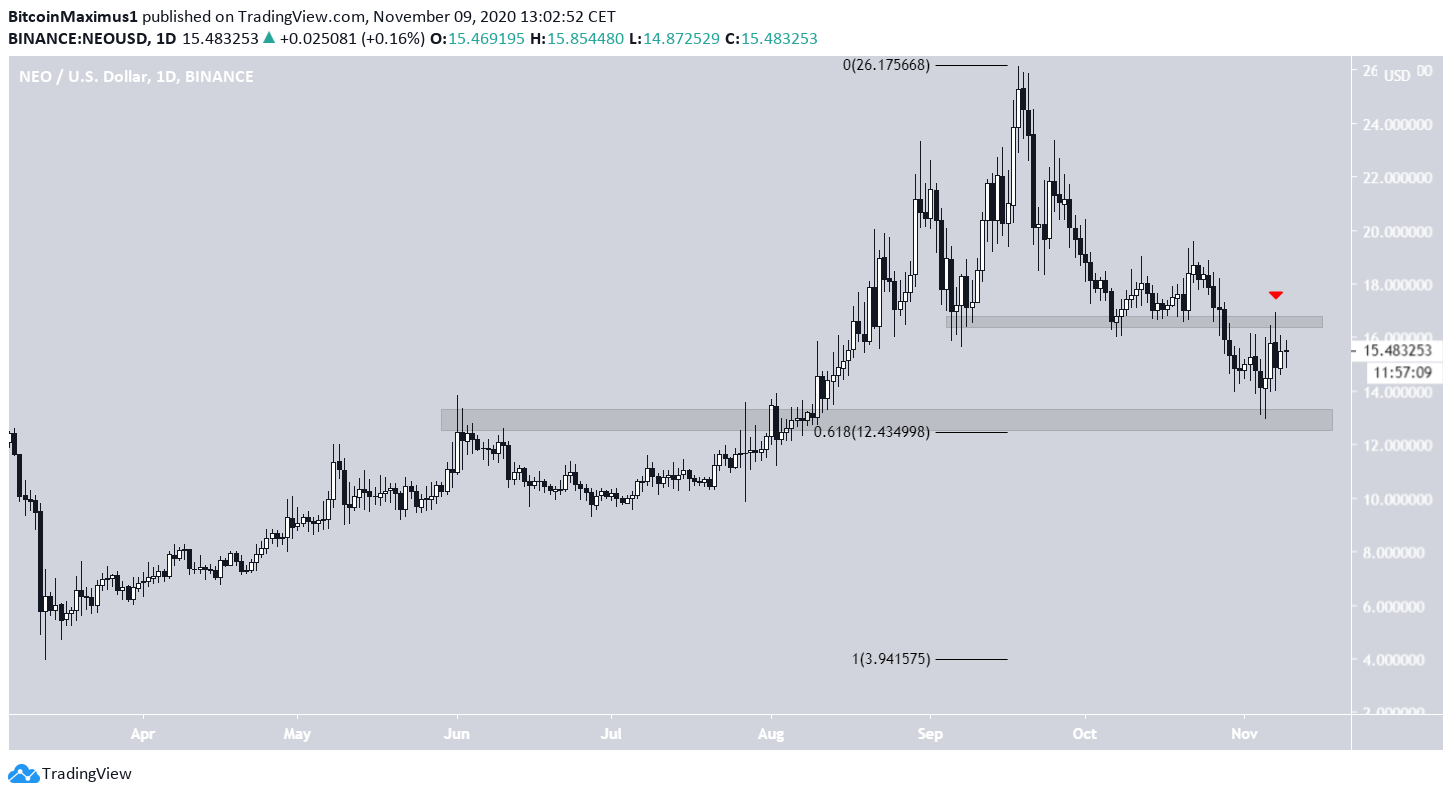
NEO Trading Range
The NEO price has been increasing since it reached a low of $12.94 on Nov 5. The low coincided with a horizontal support level near $12.50 and the 0.618 Fib level of the entire upward move, measuring from March.
Despite the increase, the price was rejected once it reached the previous support area at $16.70. This validated the $16.60 area as resistance before NEO closed a long upper wick and fell back to the $15 level.
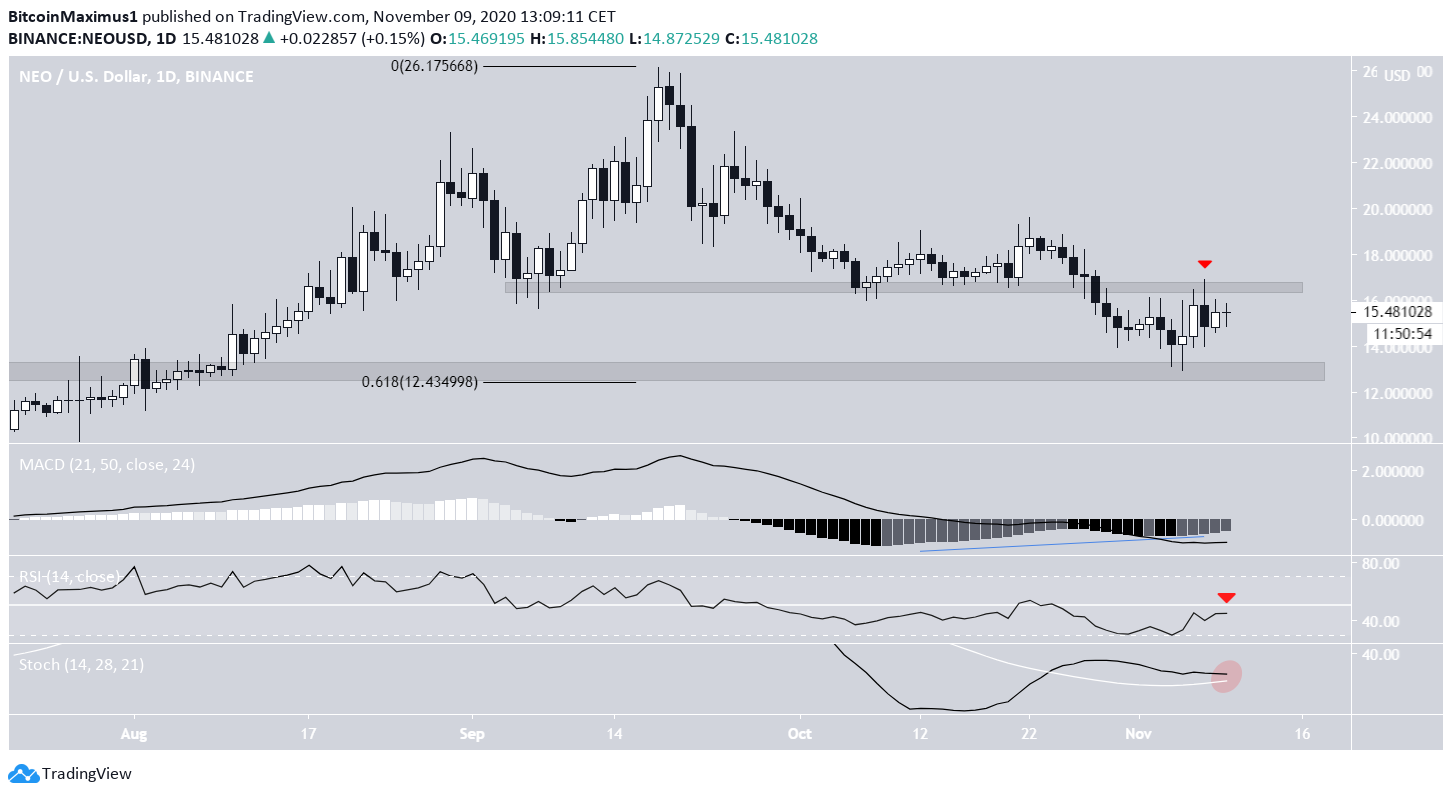
Technical indicators in the daily time-frame are undecided. While the Stochastic oscillator has made a bullish cross and the MACD histogram has generated bullish divergence, the RSI is below 0 as is the MACD signal line.
Therefore, a look at a lower time-frame is required in order to better determine if the price will likely be successful in breaking out.
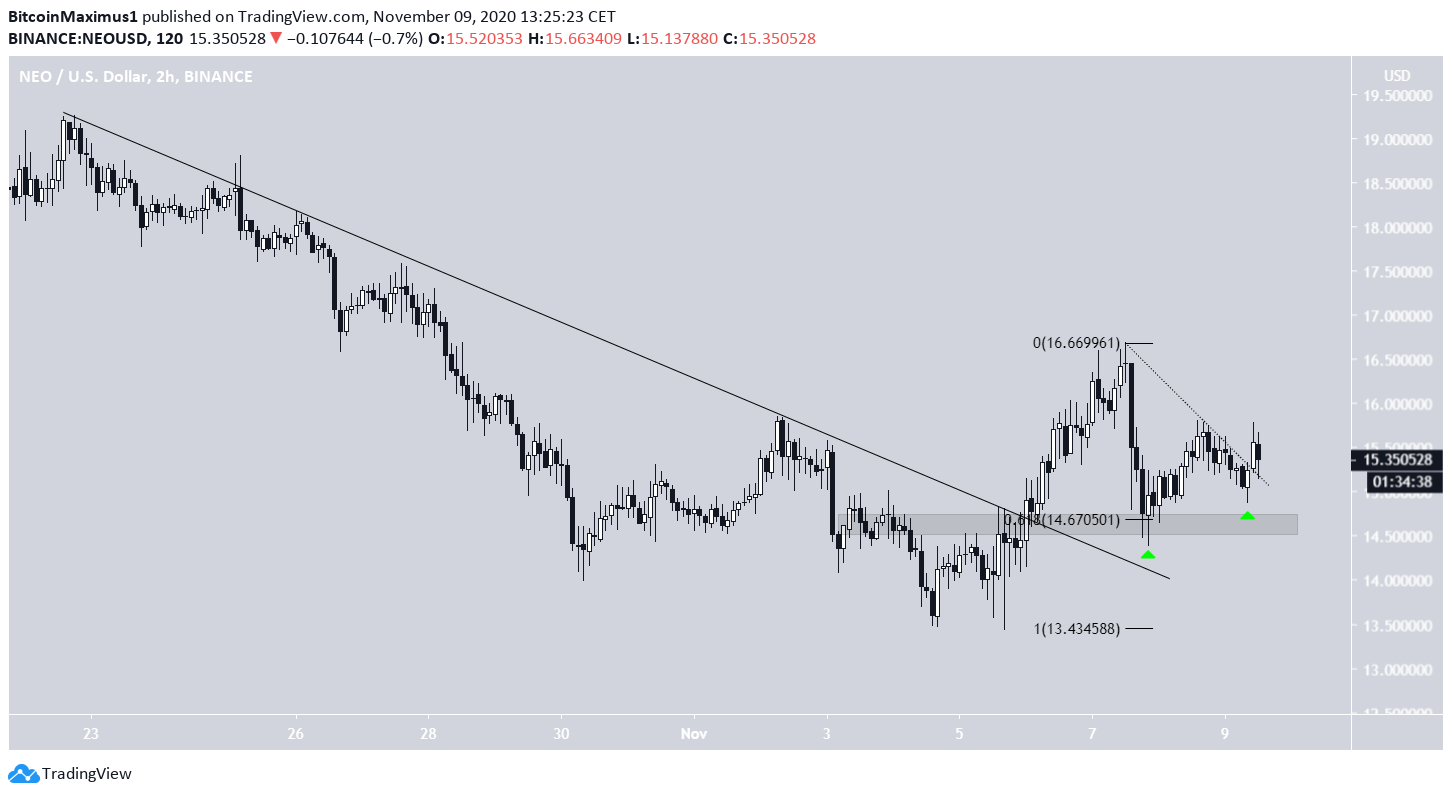
Current Status
The shorter-term two-hour chart shows that the price has broken out from a descending resistance line (solid line in the image below), validated it as support, and has begun to move upwards.
The low also coincided with the 0.618 Fib level of the entire upward move, increasing its significance.
The price has already created a higher low and broken out from an even shorter-term resistance line, so it may continue moving upwards towards the previously mentioned resistance area.
Long-Term Movement
Cryptocurrency trader @wowitstony92 tweeted a NEO weekly chart, stating that the price could increase all the way to $29, which is an important Fib resistance level measuring from the all-time high price.
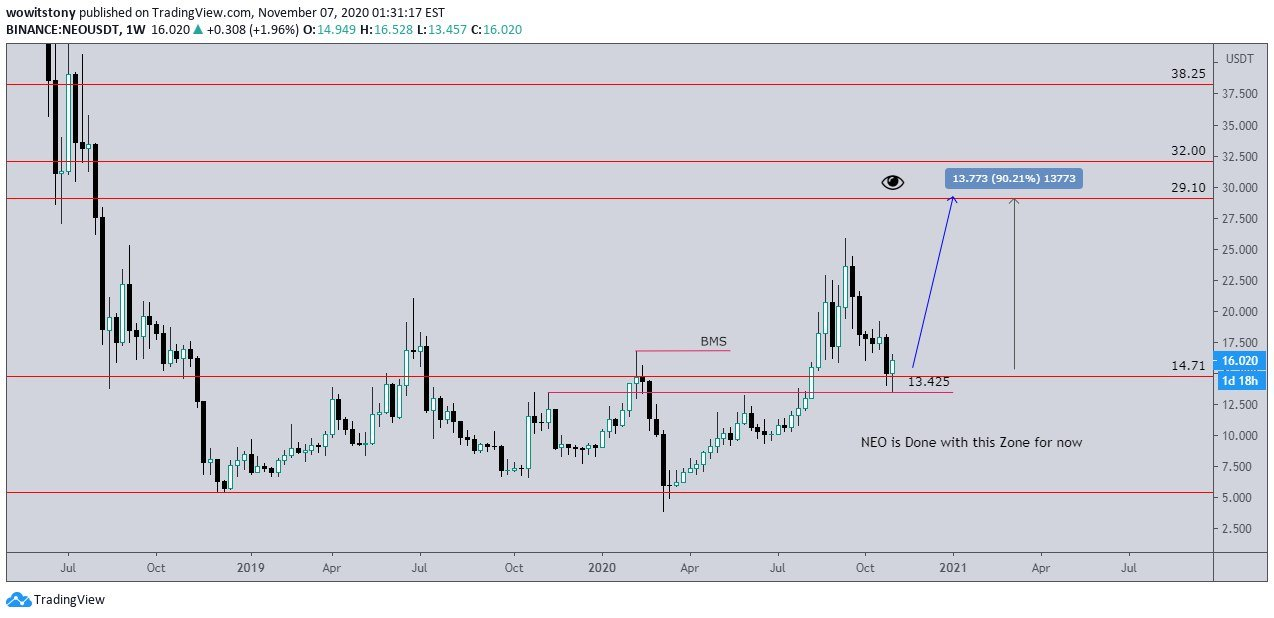
While such an increase is possible, at the current time there are no definite signs that suggest it will happen anytime soon.
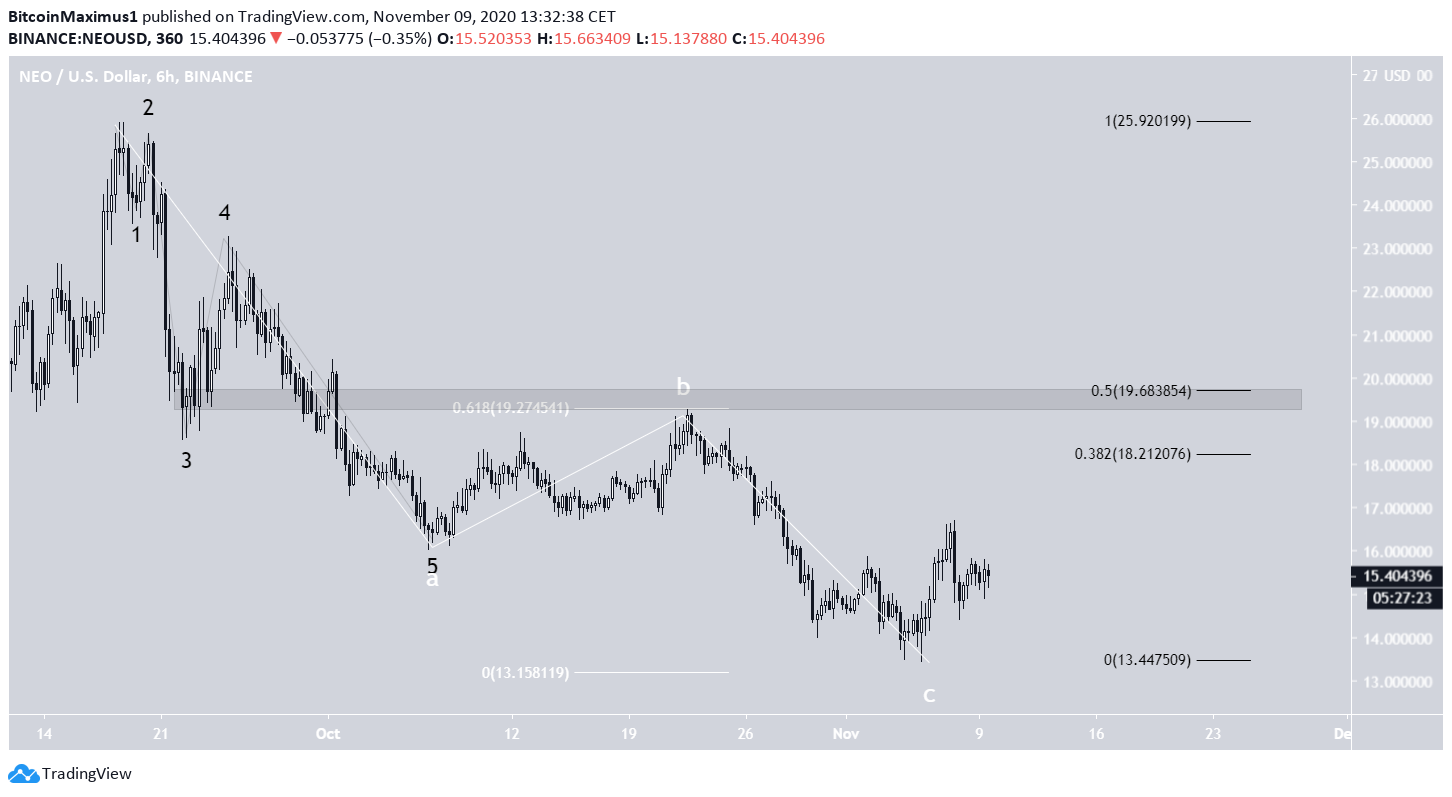
NEO has likely completed an A-B-C corrective structure (shown in white below), in which the A:C waves had a 1:0.618 ratio (white fib), a common occurrence in such corrections.
It is not yet certain whether the ensuing move is an impulse or a correction. While the former could take the price to the targets outlined in the tweet, the latter would likely cause NEO to increase towards the closest resistance levels at $18.21 and $19.68.
For BeInCrypto’s latest Bitcoin analysis, click here!
Disclaimer: Cryptocurrency trading carries a high level of risk and may not be suitable for all investors. The views expressed in this article do not reflect those of BeInCrypto.


