


NEO has broken out from a descending resistance line and is in the process of reclaiming a long-term resistance area.
It’s likely that the trend is bullish and will allow NEO to continue increasing in the near future.
Long-Term NEO Levels
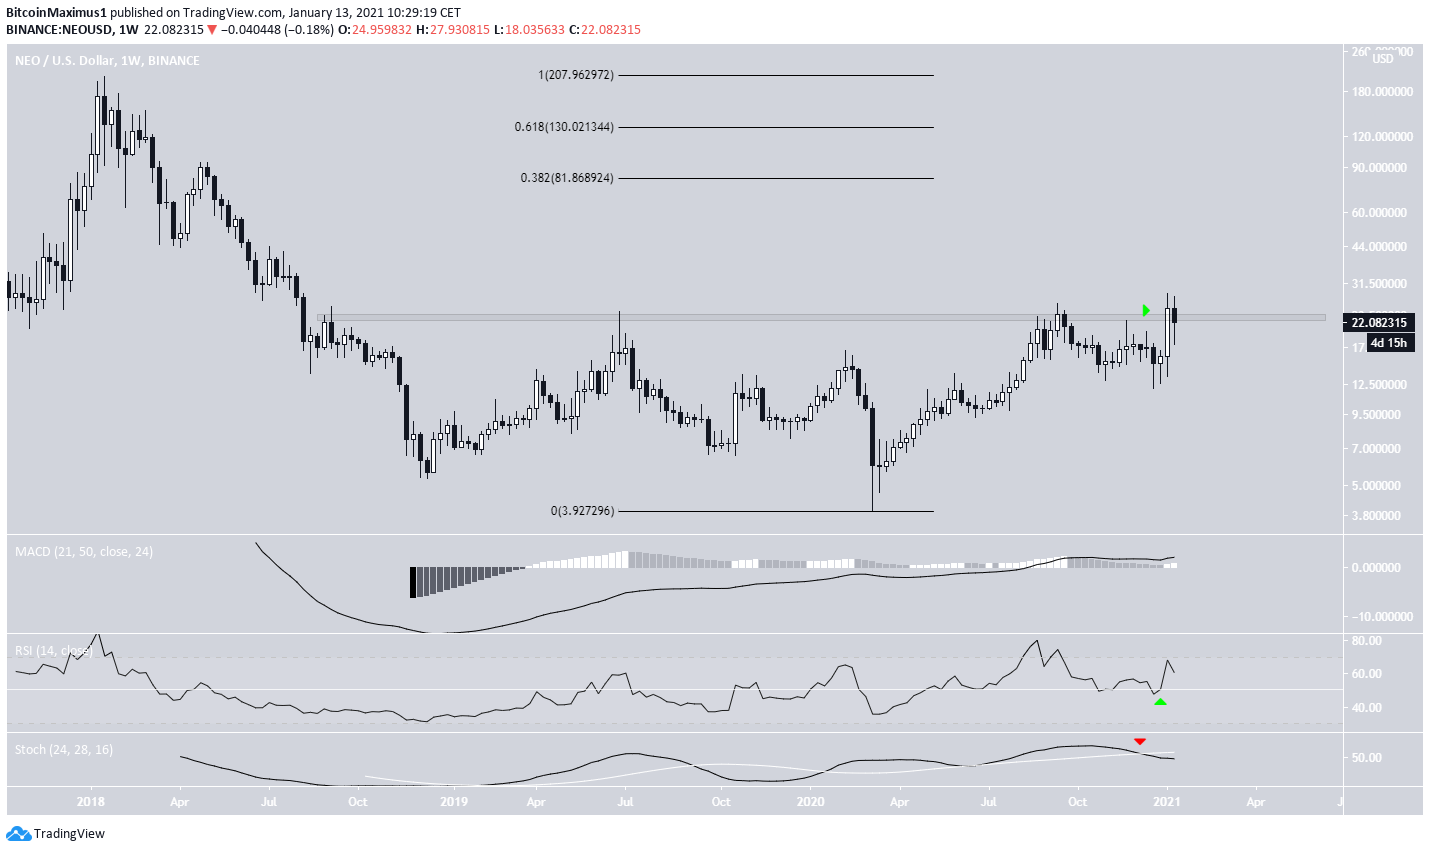
The weekly chart shows that NEO is trading at the $23 area, which had been acting as resistance since July 2018.
Despite being at resistance, it’s possible that the price is in the process of flipping this area into support. This is due to the fact that there is a long lower wick on this week’s candlestick and the close of the previous weekly candlestick was the highest weekly close since June 2018.
If NEO manages to close the week above $23, it would likely confirm that it has broken out.
Technical indicators are relatively bullish. Both the RSI and MACD are increasing, but the Stochastic oscillator has made a bearish cross.
If NEO breaks out, the next closest resistance area would be found at $81.86. This target is the 0.382 Fib retracement level of the entire downward movement measuring from the all-time high price of $207.
Breakout From Descending Resistance
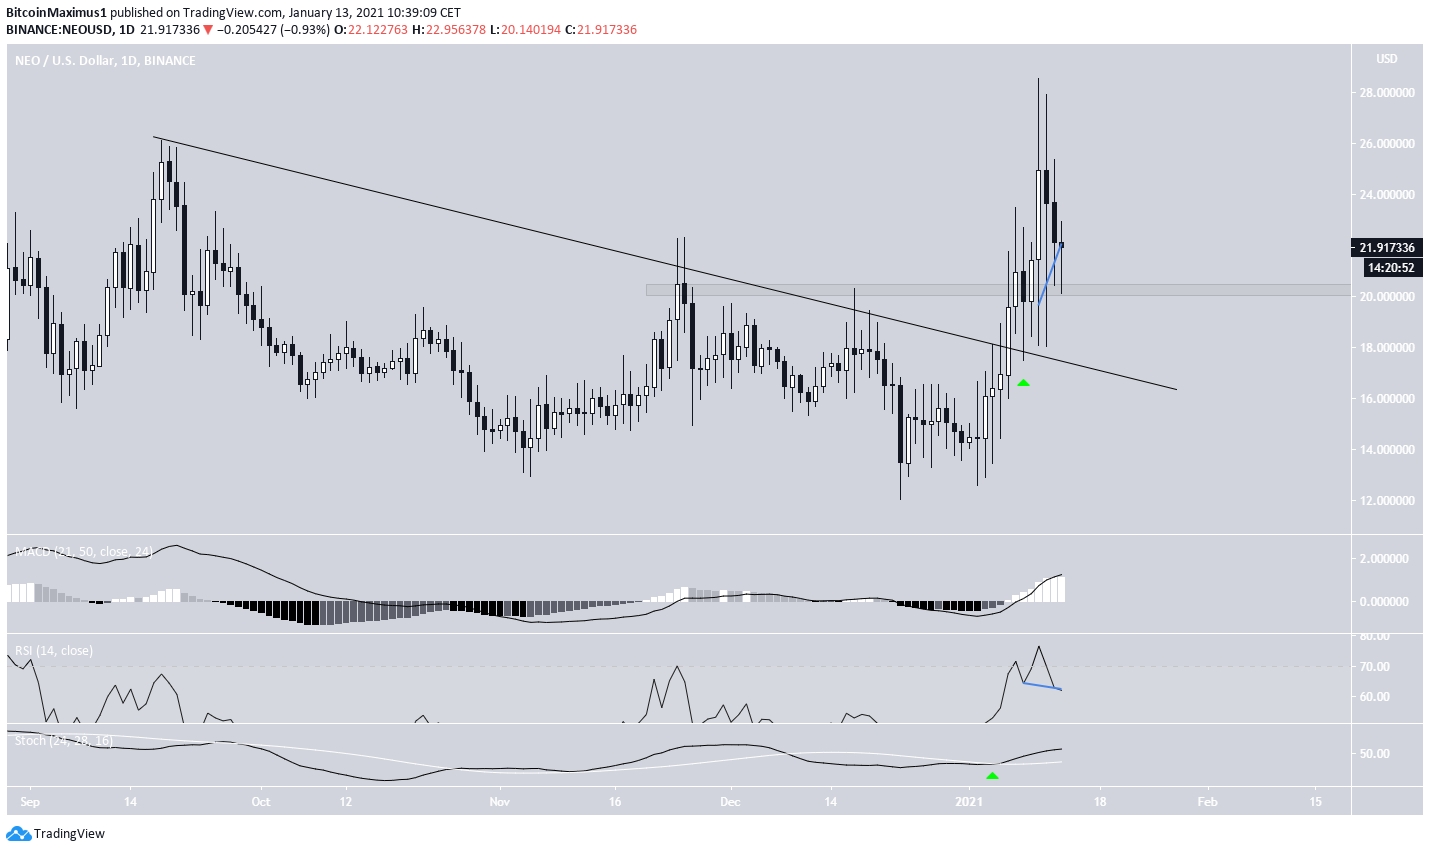
The daily chart shows that the price has broken out from a descending resistance line and validated it as support after (green arrow).
It has been moving upwards since and has also reclaimed the $20.30 area, which is now expected to act as support.
Technical indicators are firmly bullish. The MACD and Stochastic oscillator are increasing and the RSI has generated a hidden bullish divergence.
Wave Count
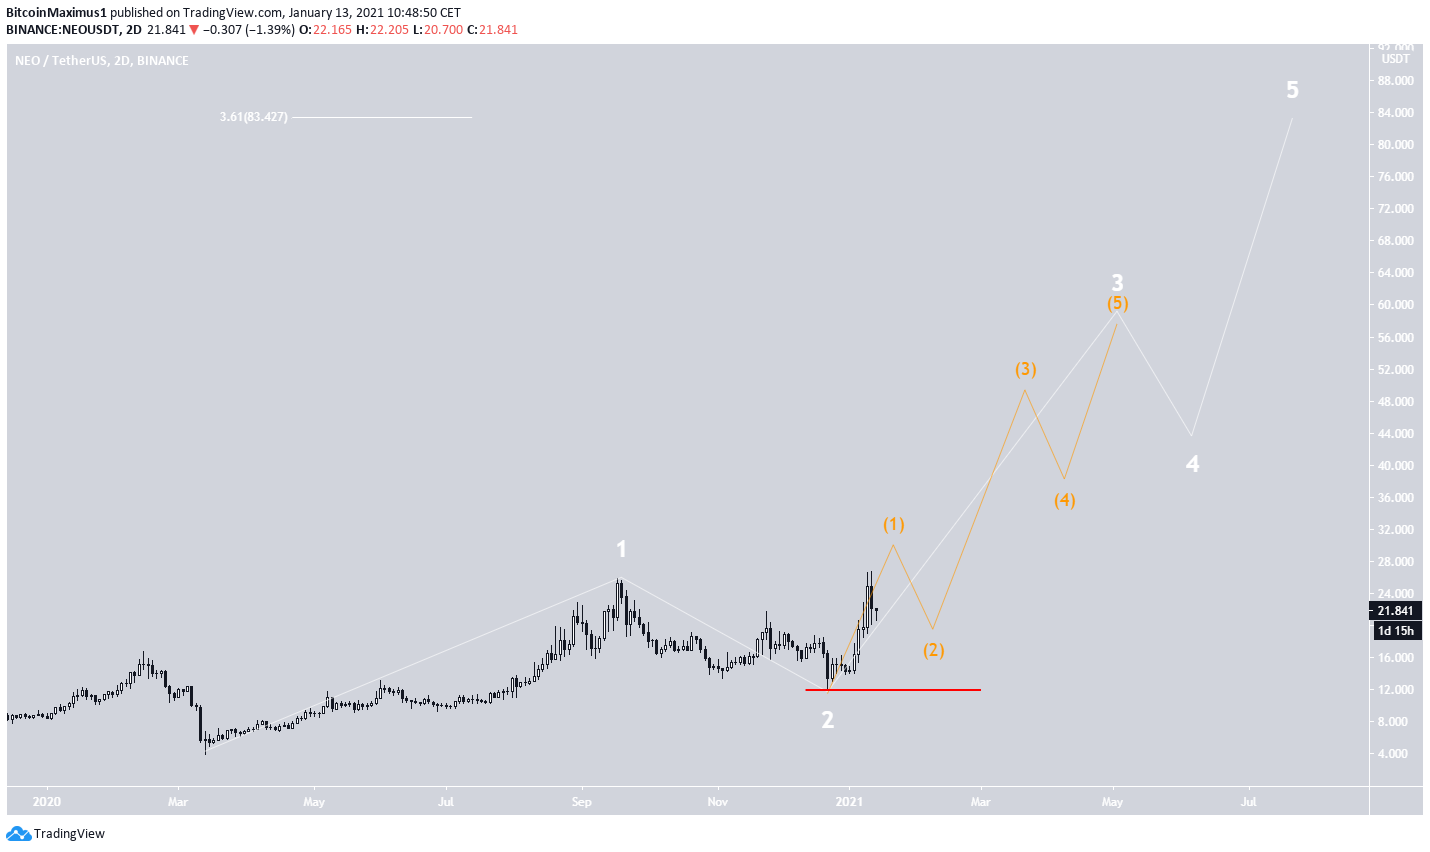
The wave count suggests that NEO is in a long-term bullish impulse. It appears to be in wave 3 (shown in white below) and in sub-wave 1 (orange).
A likely target for the top of the entire bullish impulse is found at $83. This target is a combination of the 3.61 Fib extension of wave 1 and the previously outlined long-term resistance area.
A drop below the wave 2 low at $12.21 would invalidate this long-term count.
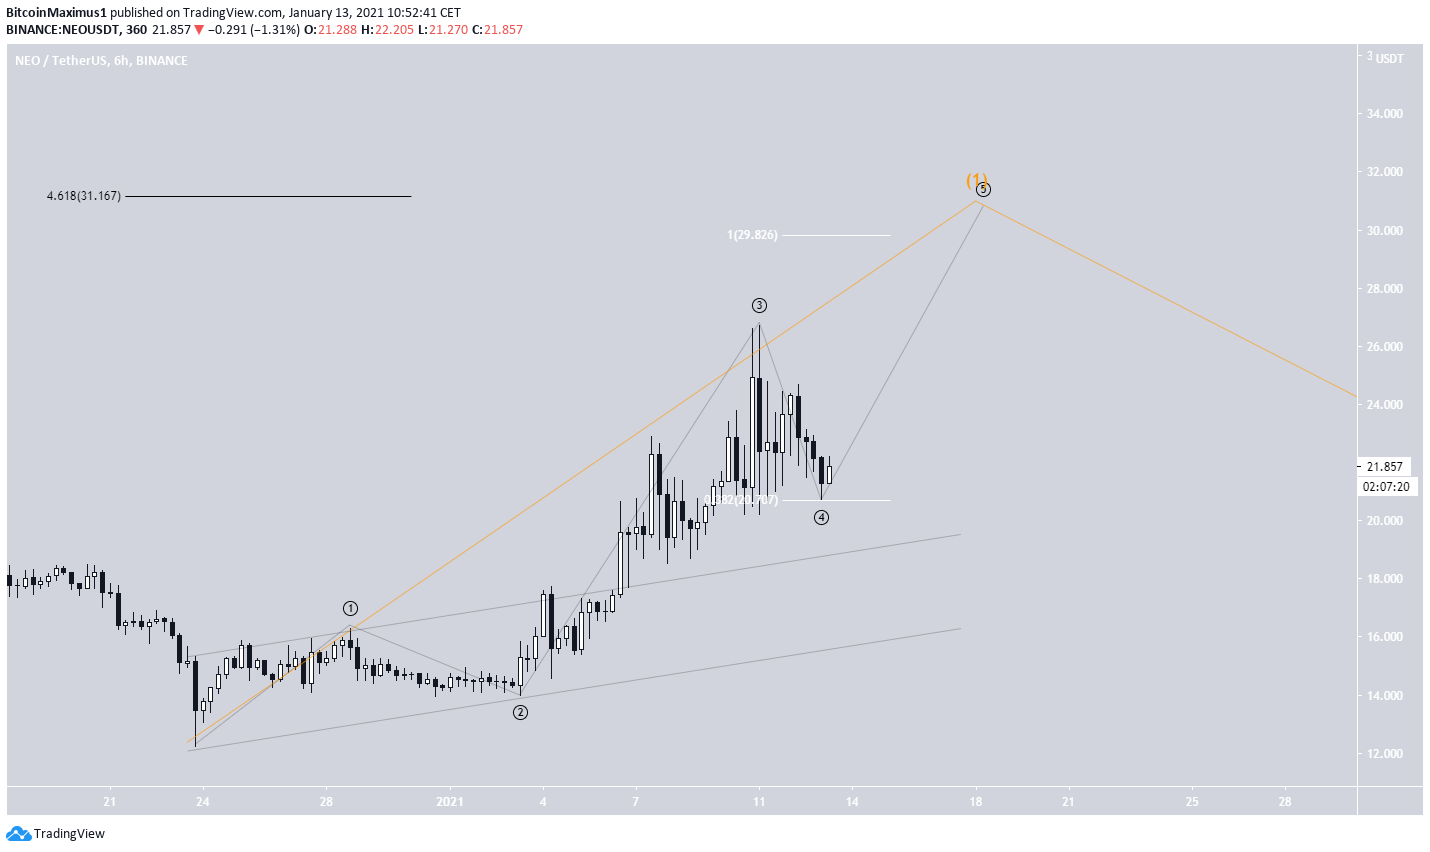
A closer look at the movement reveals that the price is approaching the top of sub-wave 1 and is possibly in minor sub-wave 5 (black).
A potential target for the top of sub-wave 1 is found between $29.82-$31.167, found by using a combination of Fib projections and extensions.
NEO/BTC
Cryptocurrency trader @CryptoNewton outlined a NEO/BTC chart, stating that it will likely increase to ₿0.0011
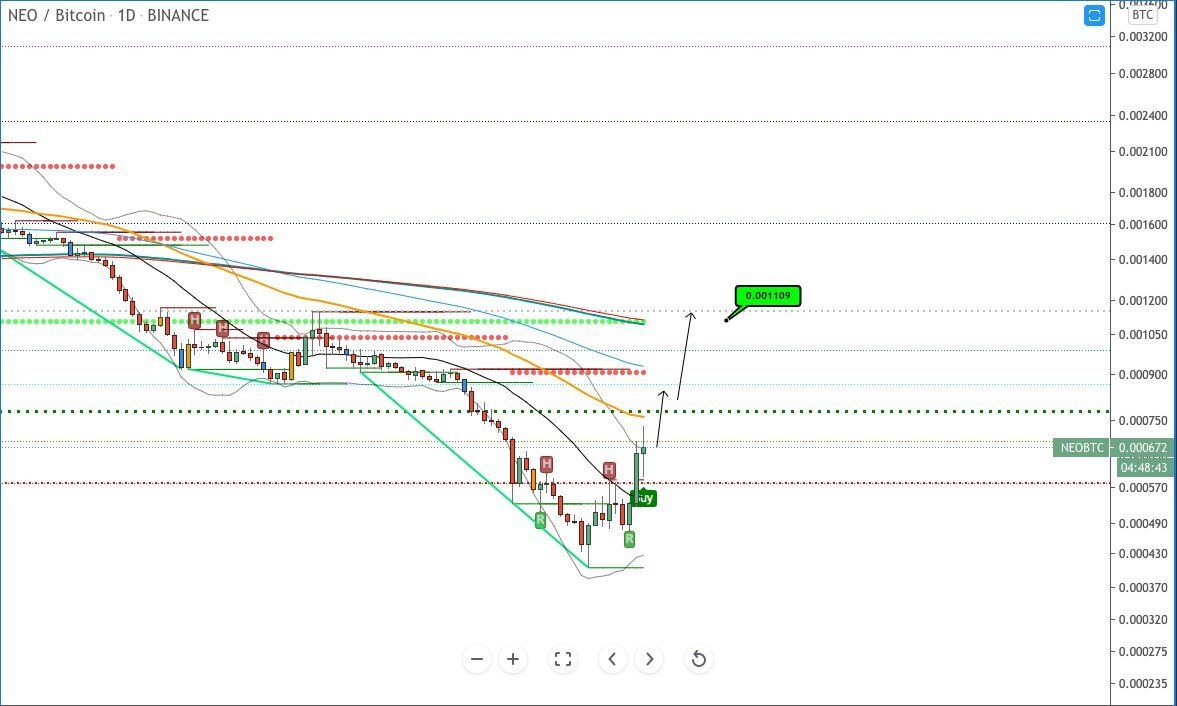
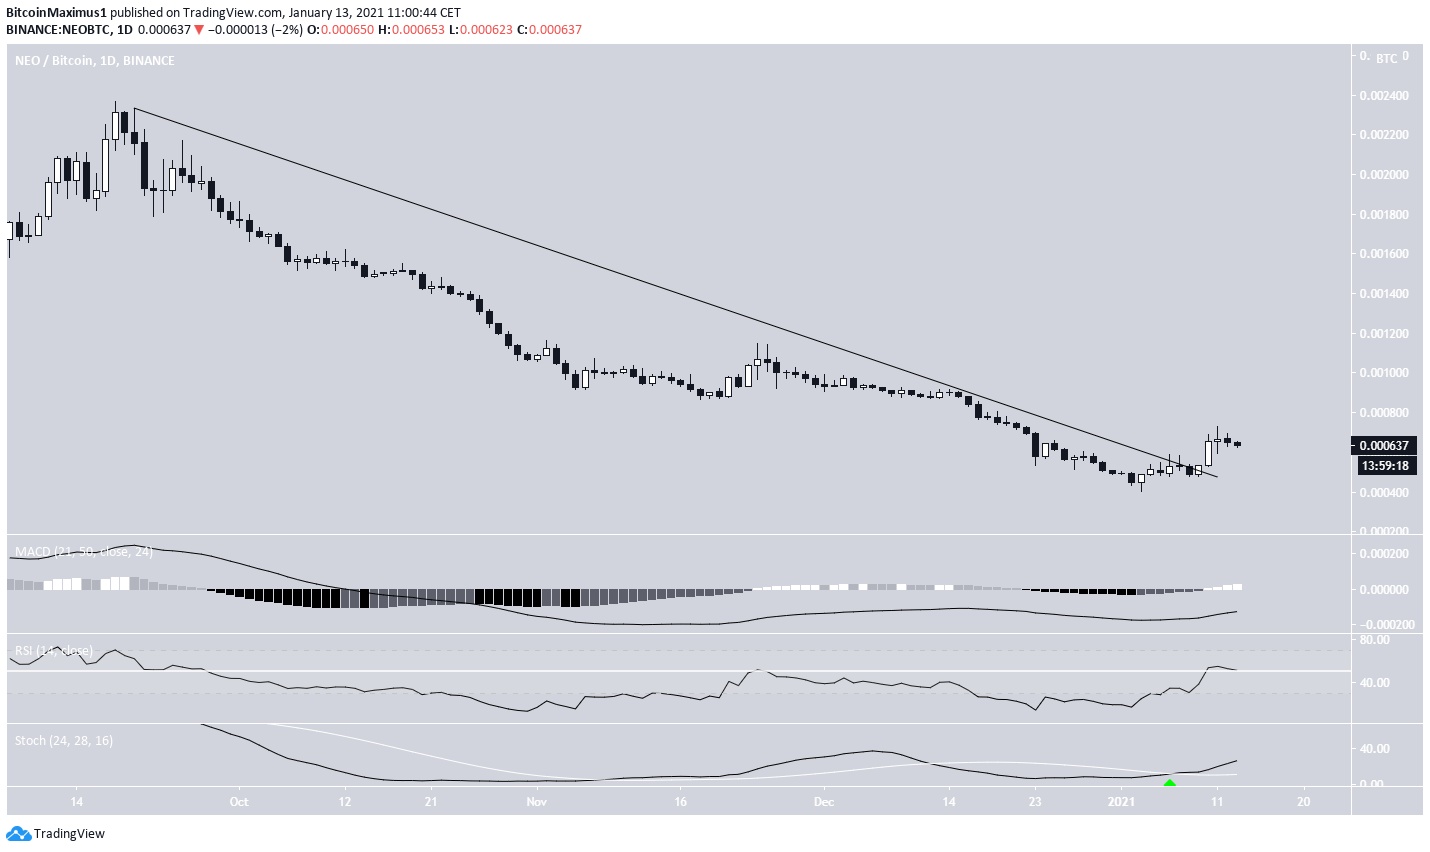
The NEO/BTC pair has also broken out from a descending resistance line and is in the process of retracing.
Nevertheless, technical indicators are bullish and support the continuation of the upward movement.
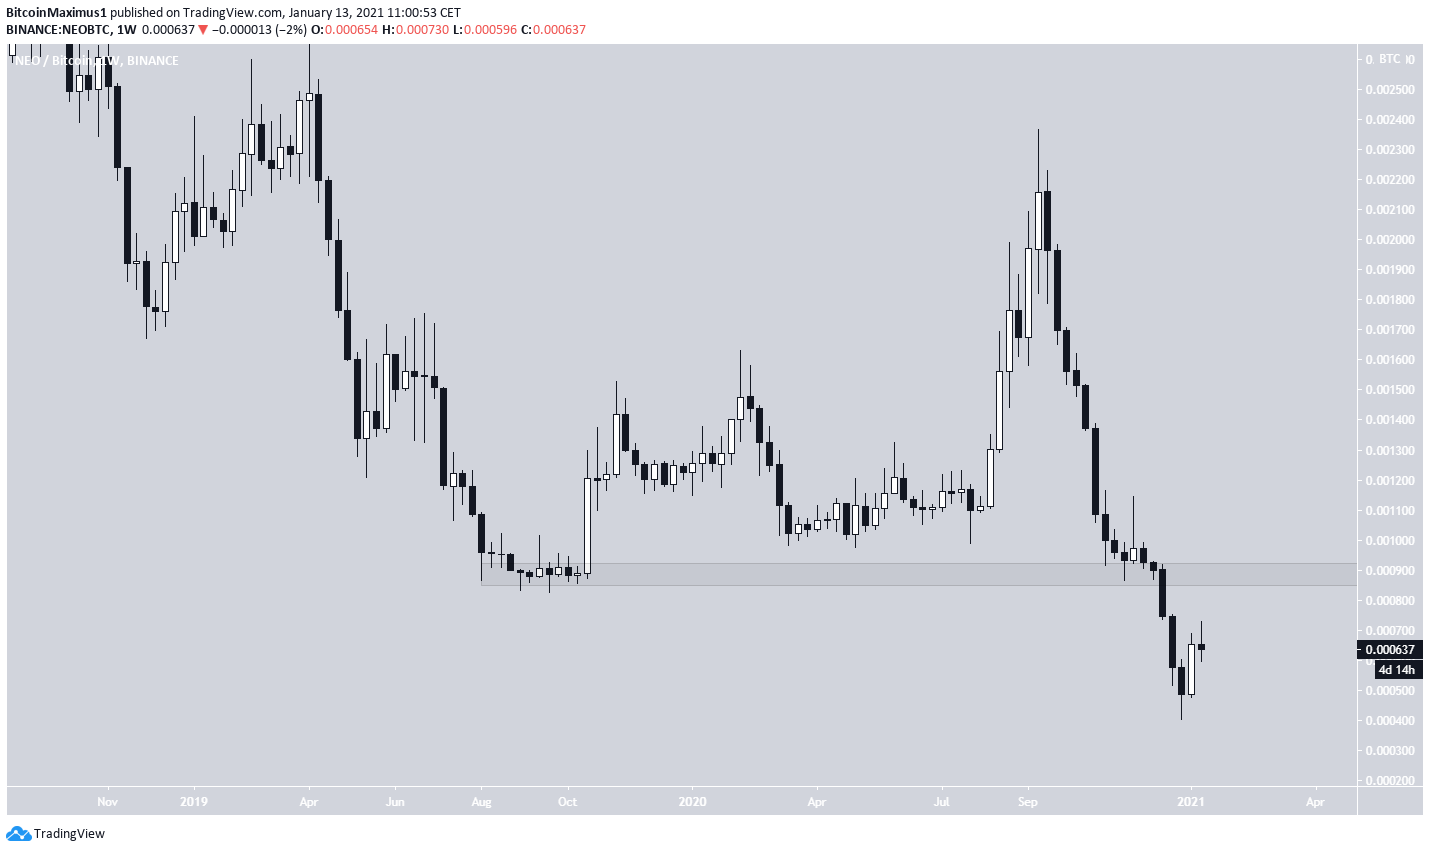
However, the weekly chart shows that NEO is trading at an all-time low after breaking down from ₿0.0009.
Until it can reclaim the breakdown level at ₿0.0009, we cannot consider the long-term trend to be bullish.
Conclusion
NEO/USD is expected to increase towards $30, while a long-term target is found at $83.
NEO/BTC is expected to continue increasing towards ₿0.0009.
For BeInCrypto’s latest Bitcoin (BTC) analysis, click here!
Disclaimer: Cryptocurrency trading carries a high level of risk and may not be suitable for all investors. The views expressed in this article do not reflect those of BeInCrypto.


