


The NEAR price is showing promising signs of recovery, with transaction numbers climbing again from a recent dip on March 20. This uptick in activity is complemented by an RSI value of 73, hinting at a strong potential for further increases in price.
Additionally, the emergence of a golden cross on the price chart reinforces this optimistic outlook, often seen as a harbinger of a forthcoming bullish trend. Together, these indicators suggest that NEAR might be gearing up for a significant upward movement in the market.
NEAR Transactions Climbing Again
After a significant drop to 3.1 million daily transactions on March 20, the NEAR protocol’s transaction count has shown signs of recovery, steadily increasing after a notable slump observed between March 12 and 20. During this period, the NEAR price experienced minimal movement, essentially moving sideways as the daily transaction volume gradually declined.
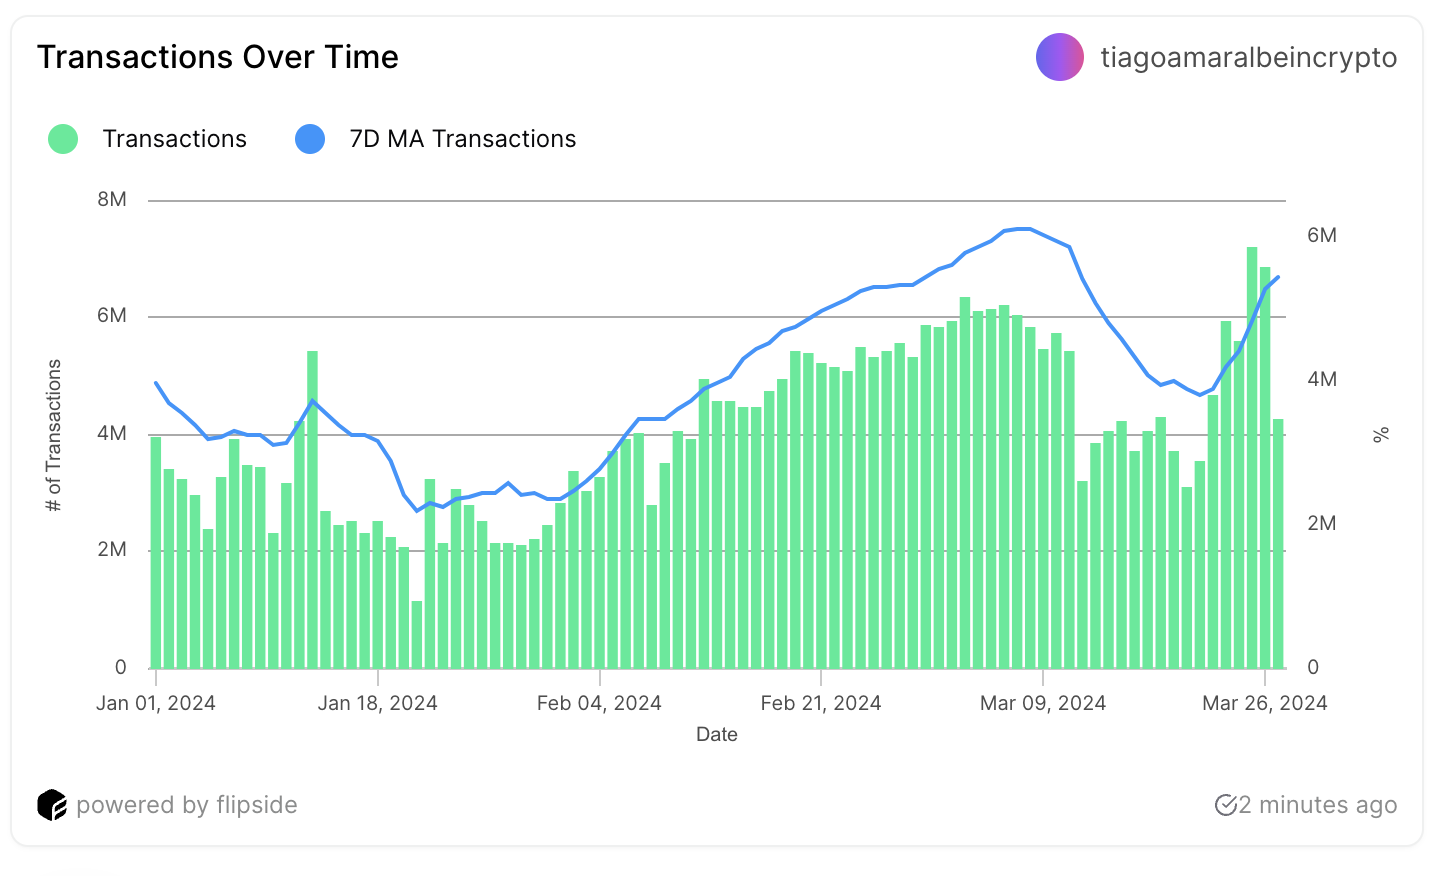
This phase saw the NEAR price shift from $5.96 to $6.44, indicating a mild upward trend amidst fluctuating transaction volumes. Remarkably, post-March 20, the transaction count witnessed a substantial surge. Reaching 6.8 million on March 26, marking its highest point since December 2023.
This recent trend where the NEAR price seems to echo the trajectory of its transaction volume suggests that the uptick in daily transactions could signal the onset of a new bullish phase. Given the close correlation between transaction activity and price dynamics, the increasing transaction volume could indeed point towards a potential rally in the NEAR market.
Read More: Near Protocol (NEAR) Price Prediction for 2024
NEAR RSI Is Currently At 73
During the surge from February 29 to March 13, when NEAR’s price notably increased, its Relative Strength Index (RSI) remained above 80. Following this period, a correction ensued, with NEAR’s price adjusting from $8.84 to $6.6 within just four days.
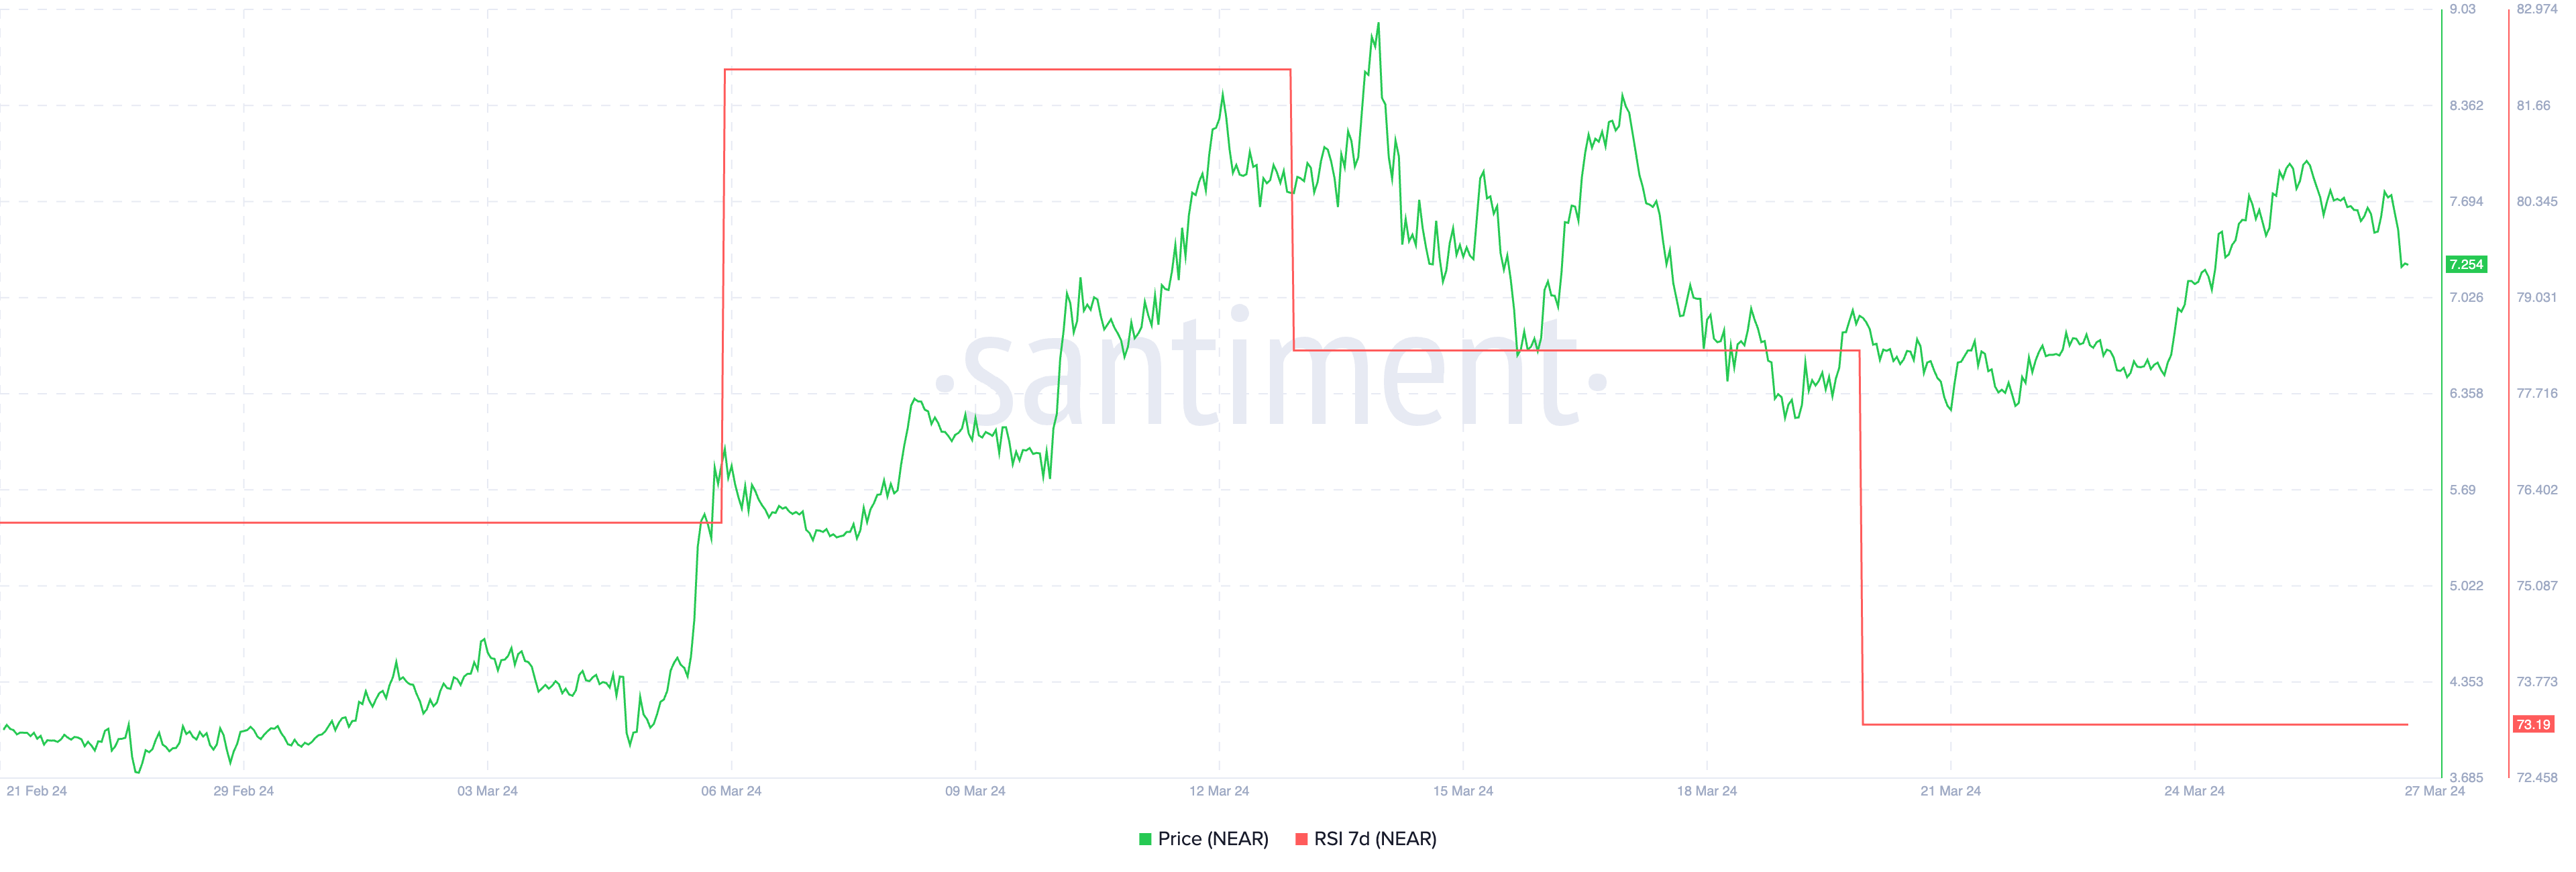
The RSI, a key momentum indicator in technical analysis, assesses the velocity of price movements to determine if an asset is in overbought or oversold territory. With a scale ranging from 0 to 100, an RSI above 70 typically suggests an overbought condition, offering a precursor to potential price stabilization or retracement, whereas values below 30 indicate an oversold state.
Currently, the NEAR RSI stands at 73, having moderated from a peak of 78. This shift from 78 to 73 in RSI signifies a modest relaxation in the rate of price appreciation, yet it remains in a healthy range, indicating potential for further growth. Despite the recent drop, an RSI of 73 for NEAR still denotes a strong market with room for price expansion, underscoring a sustained positive momentum.
NEAR Price Prediction: EMA Lines Just Formed A Golden Cross
Analyzing the NEAR 4H price chart, the short-term EMA lines just crossed above the more long-term lines. That forms a pattern called “golden cross,” which is a bullish signal.
EMA lines, or Exponential Moving Averages, are pivotal trend indicators that prioritize recent price data more heavily. They are employed to streamline price movements and ascertain the trend’s direction over a given timeframe. This suggests that the current trend could be shifting from bearish to bullish, mirroring the prospective price movements discussed.
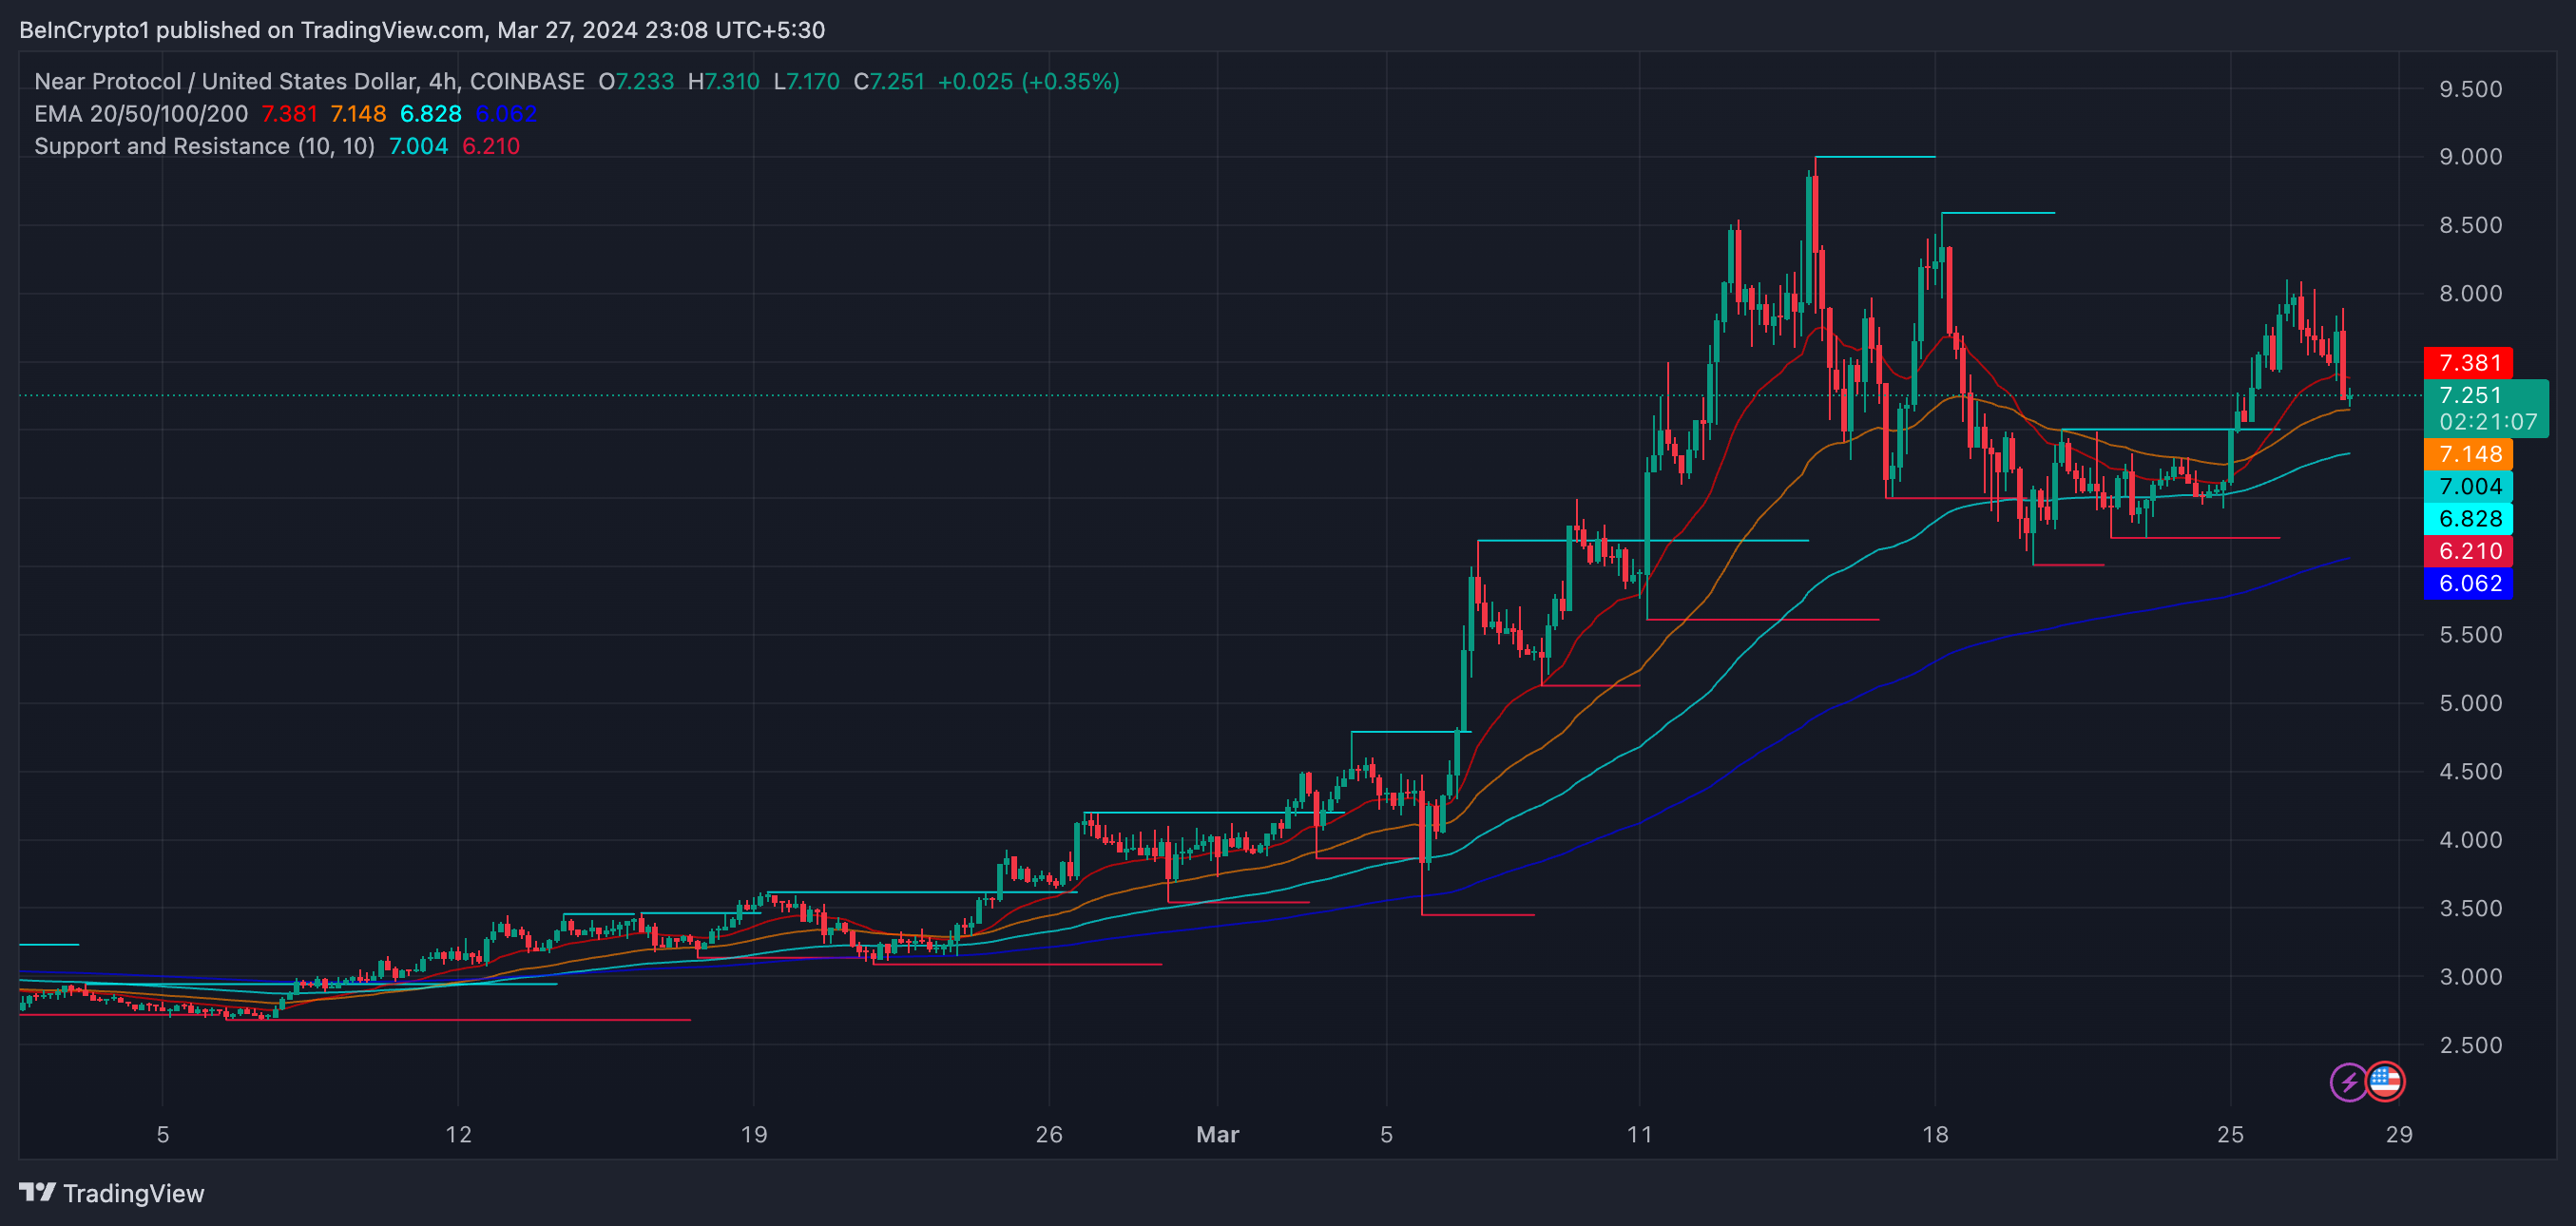
For the NEAR price, the $8.57 level is identified as a critical resistance area. Should NEAR successfully uphold this resistance, it might pave the way for an ascent toward the $9 threshold. This would mark a potential increase of about 25% from its current price.
Read More: Top 7 NEAR Wallets in 2024
Failure to maintain the support level at $6.2 could make NEAR enter a downtrend and go as down as $5.6. This would be a potential 22% decrease from the current price.


