
Near (NEAR) has witnessed a relative balance between buying and selling pressures since June 17, preventing its price from trending strongly in either direction.
This has led to the forming of a horizontal channel, which the altcoin seeks to break out of.
Near Bulls Attempt an Uptrend
At press time, NEAR trades at $5.31. Having witnessed a minor uptick in accumulation in the past few days, its price is trending towards the upper line of its horizontal channel.
A horizontal channel is formed when the price of an asset consolidates within a range for an extended period. The upper line of this channel forms resistance, while the lower line forms support.
In NEAR’s case, it has faced resistance at $5.66 since June 17 and has found support at $6.63.
Some of NEAR’s technical indicators observed on a one-day chart confirm the possibility of a crossover above the resistance level. For example, it’s Moving average convergence/divergence (MACD) saw a bullish crossover on June 25 and has since maintained that trend.
Read More: What Is NEAR Protocol (NEAR)?
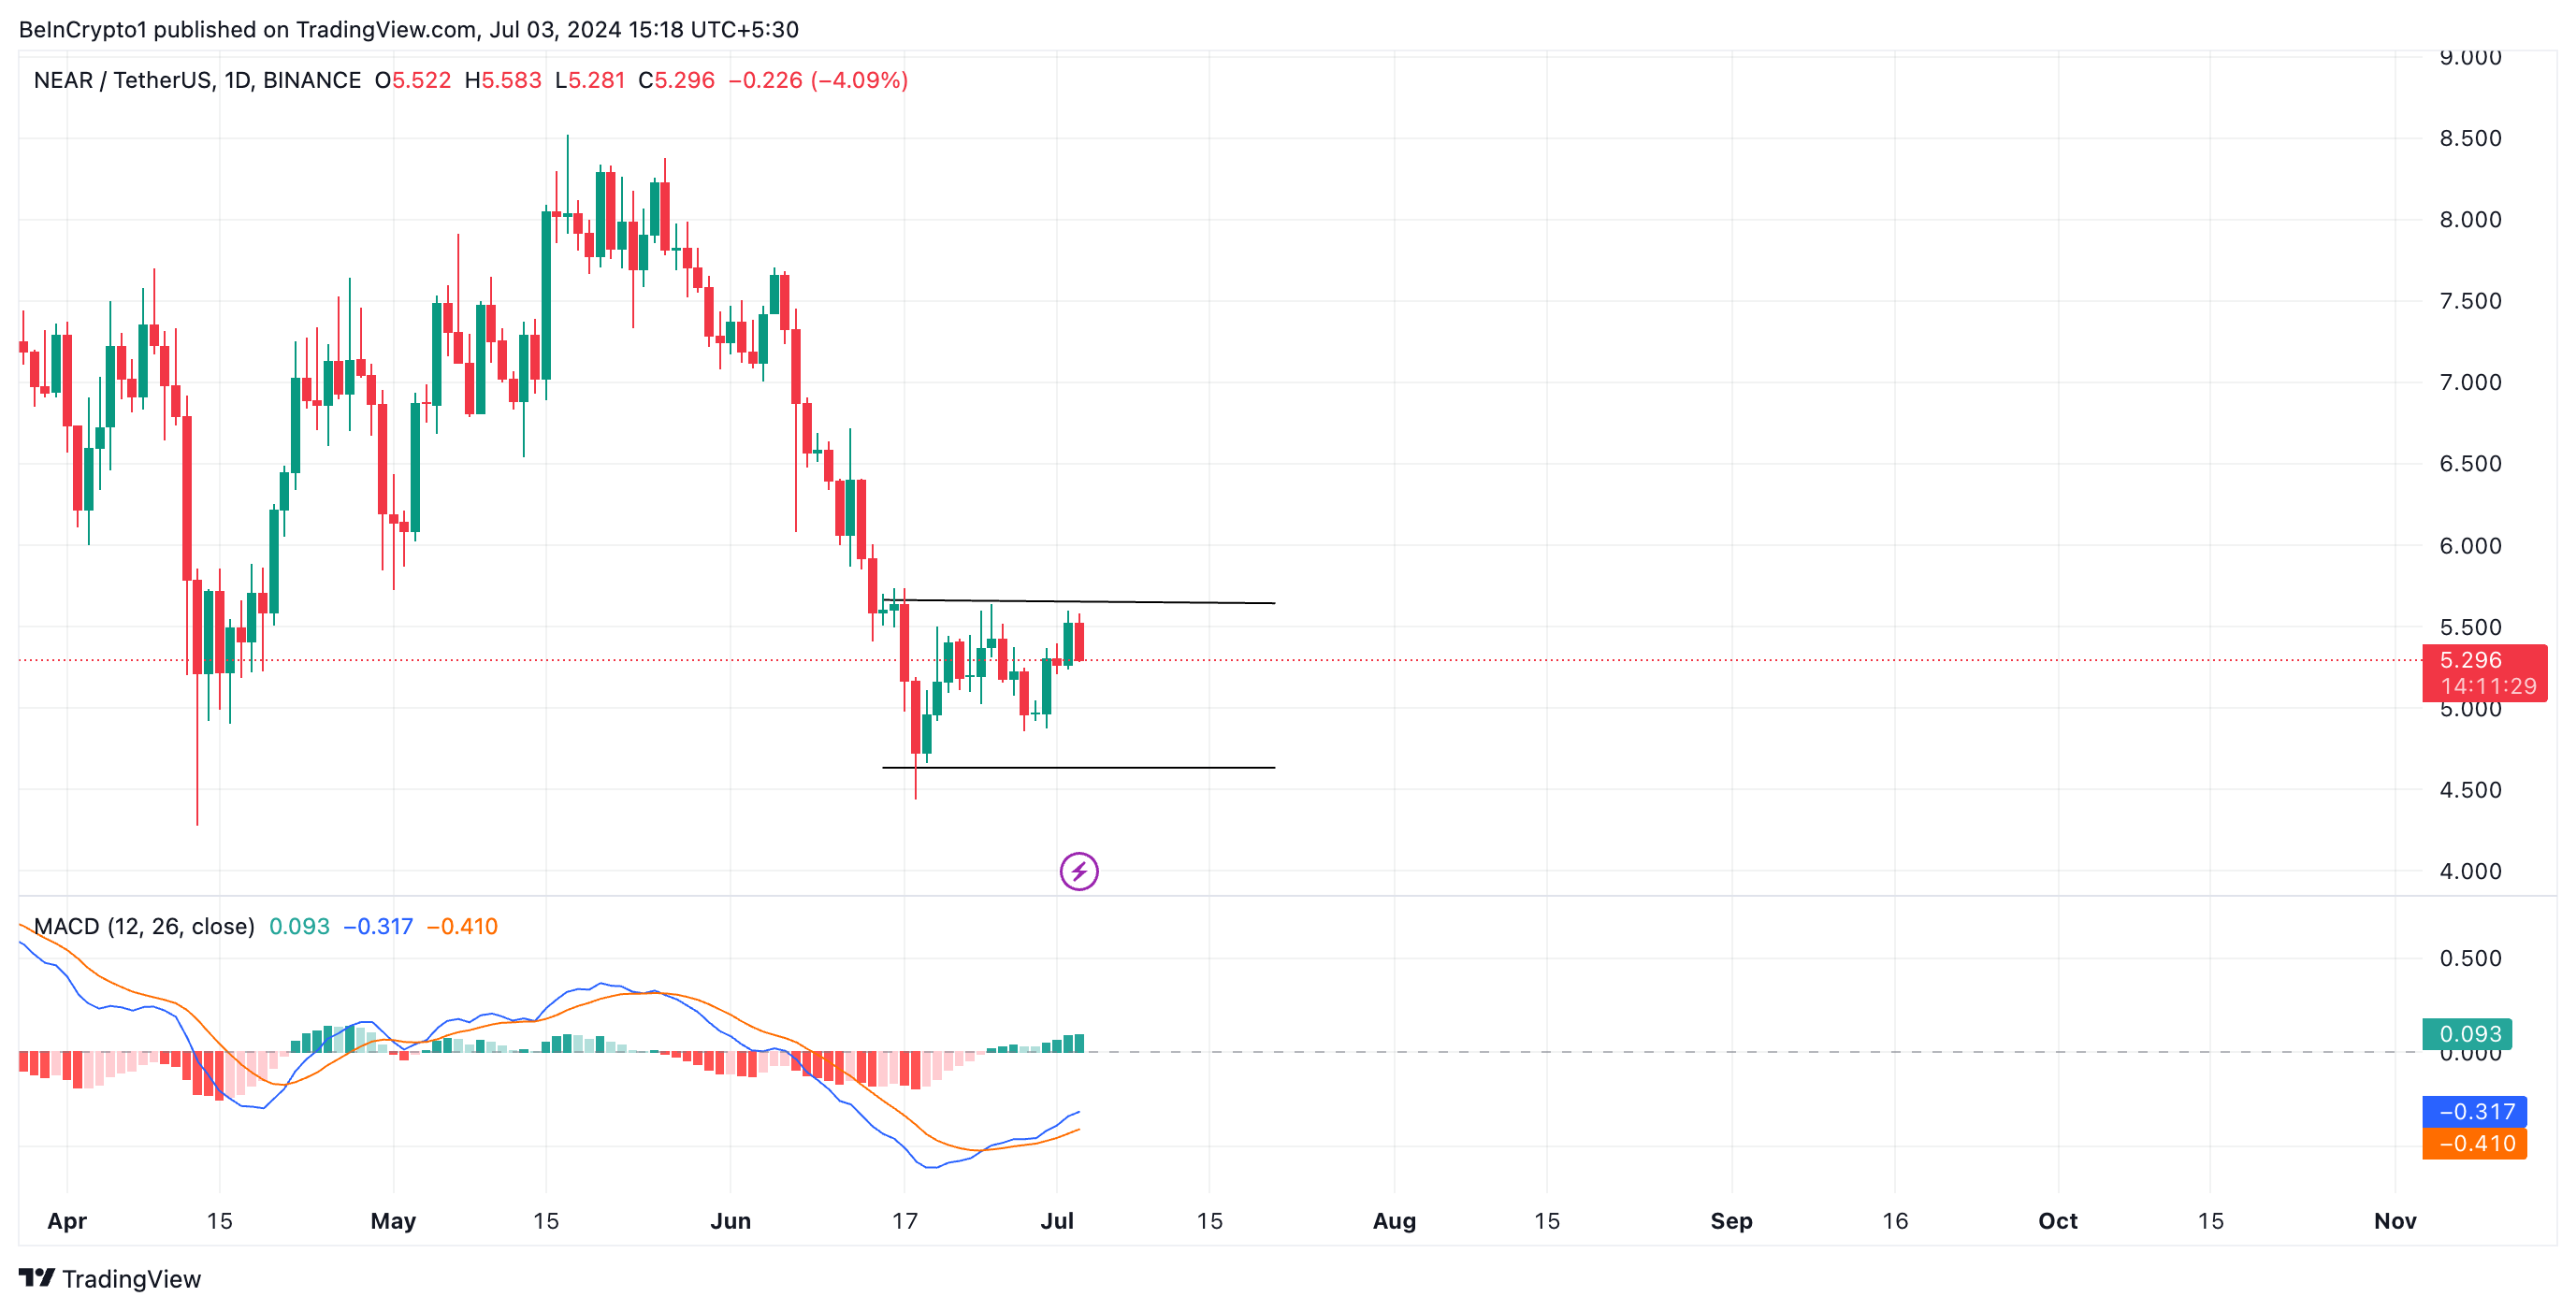
An asset’s MACD indicator tracks the strength and direction of its price trend and potential reversal points. When the MACD line (blue) crosses above the signal line (orange), it is bullish, indicating it might be a good time to buy.
This is because it indicates that the asset’s short-term momentum is stronger than its long-term momentum, suggesting that the price may increase.
Further, for the first time since June 7, NEAR’s Elder-Ray Index has returned a positive value. As of this writing, the indicator’s value is 0.22.
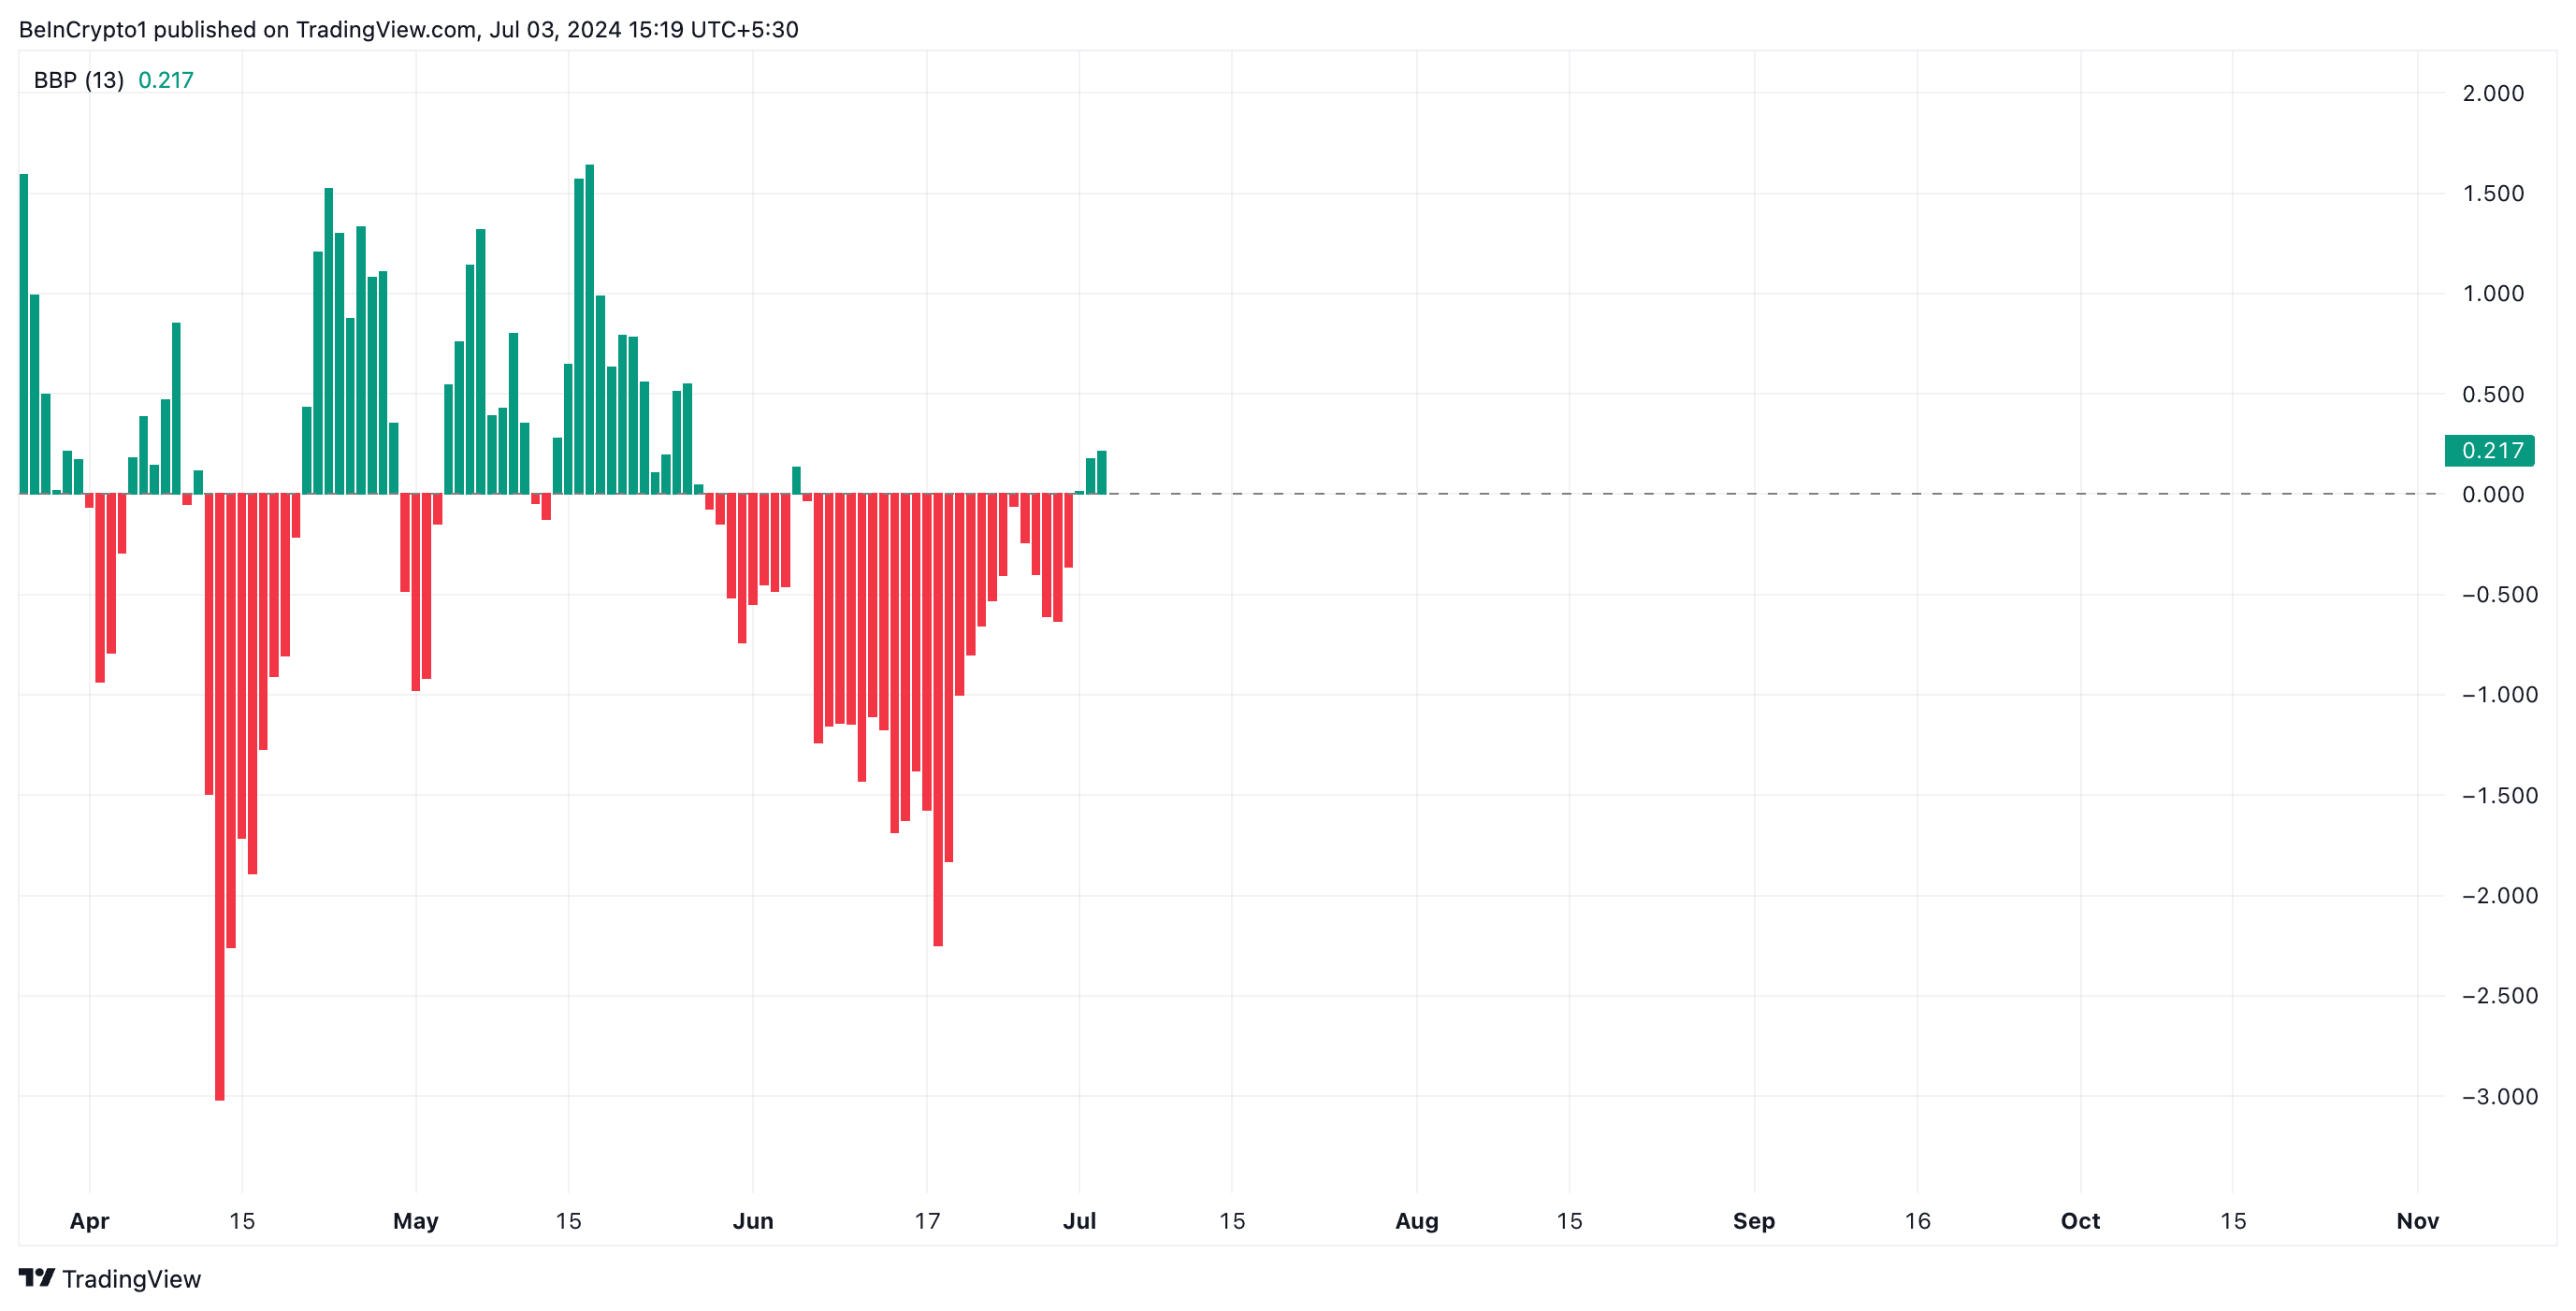
This indicator measures the relationship between the strength of buyers and sellers in the market. When its value is positive, bull power is dominant in the market.
NEAR Price Prediction: Sentiment is Still Significantly Poor
Although NEAR has witnessed a minor spike in accumulation in the past few days, on-chain data show that the bearish sentiment trailing it is still significant.
At press time, NEAR’s weighted sentiment is -0.41. This metric tracks the overall mood of the market regarding an asset. It considers the sentiment trailing the asset and the volume of social media discussions.
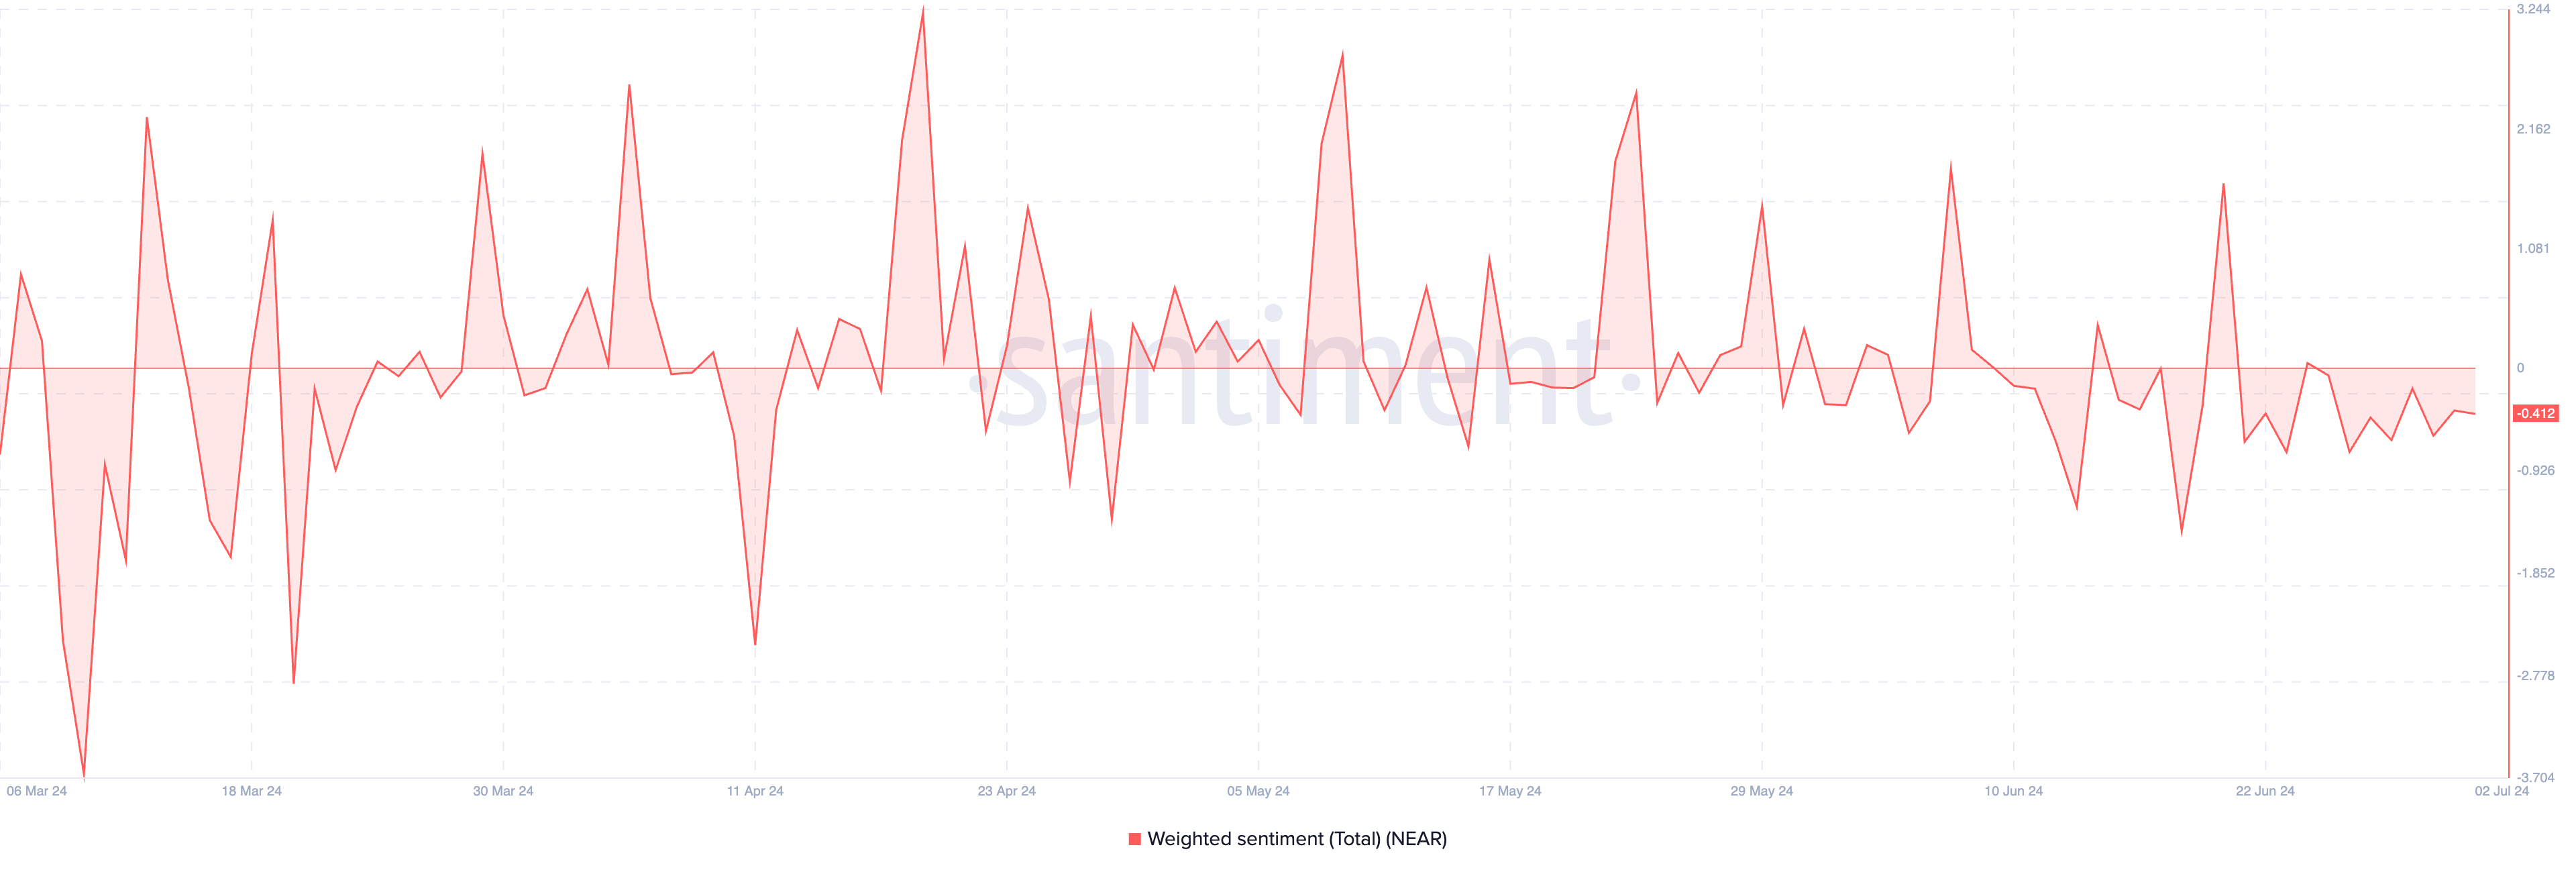
When an asset’s weighted sentiment value is below zero, most discussions on social media platforms are fueled by negative emotions like fear, uncertainty, and doubt.
If this trend continues, NEAR’s price uptrend towards resistance may become challenging. It may even decline to trade at $5.22.
Read More: Top 8 NEAR Wallets in 2024
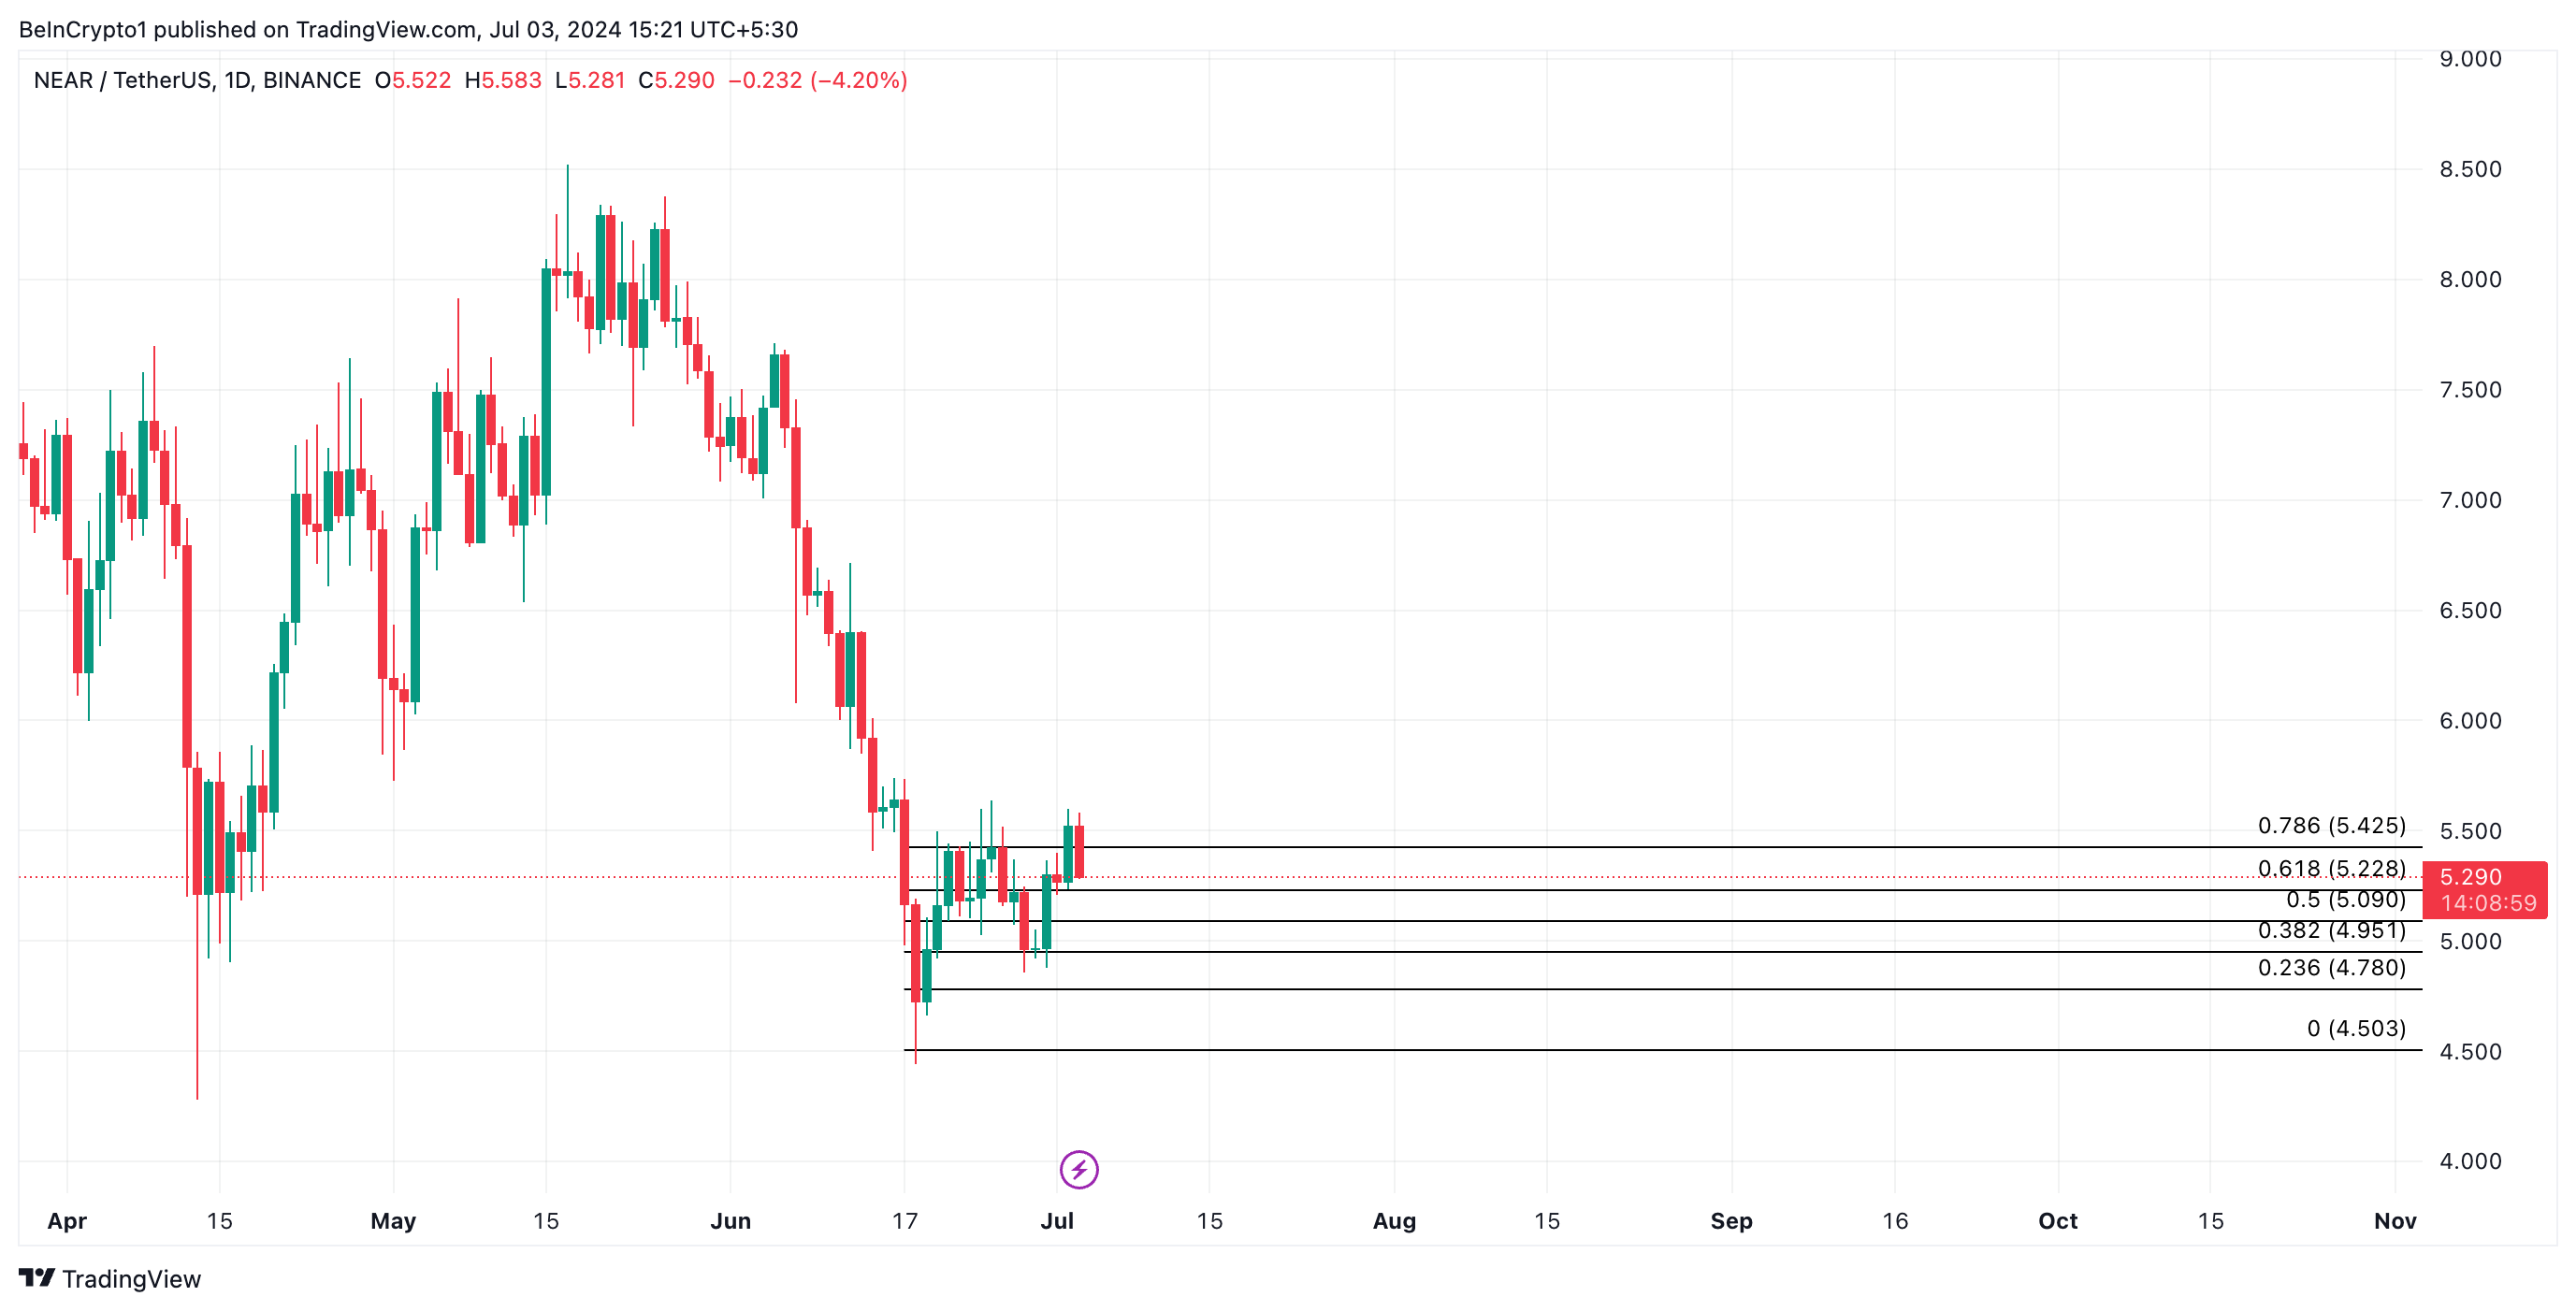
However, if the bulls can sustain the price rally, NEAR may breach resistance and trade above the $5.6 price level.
