


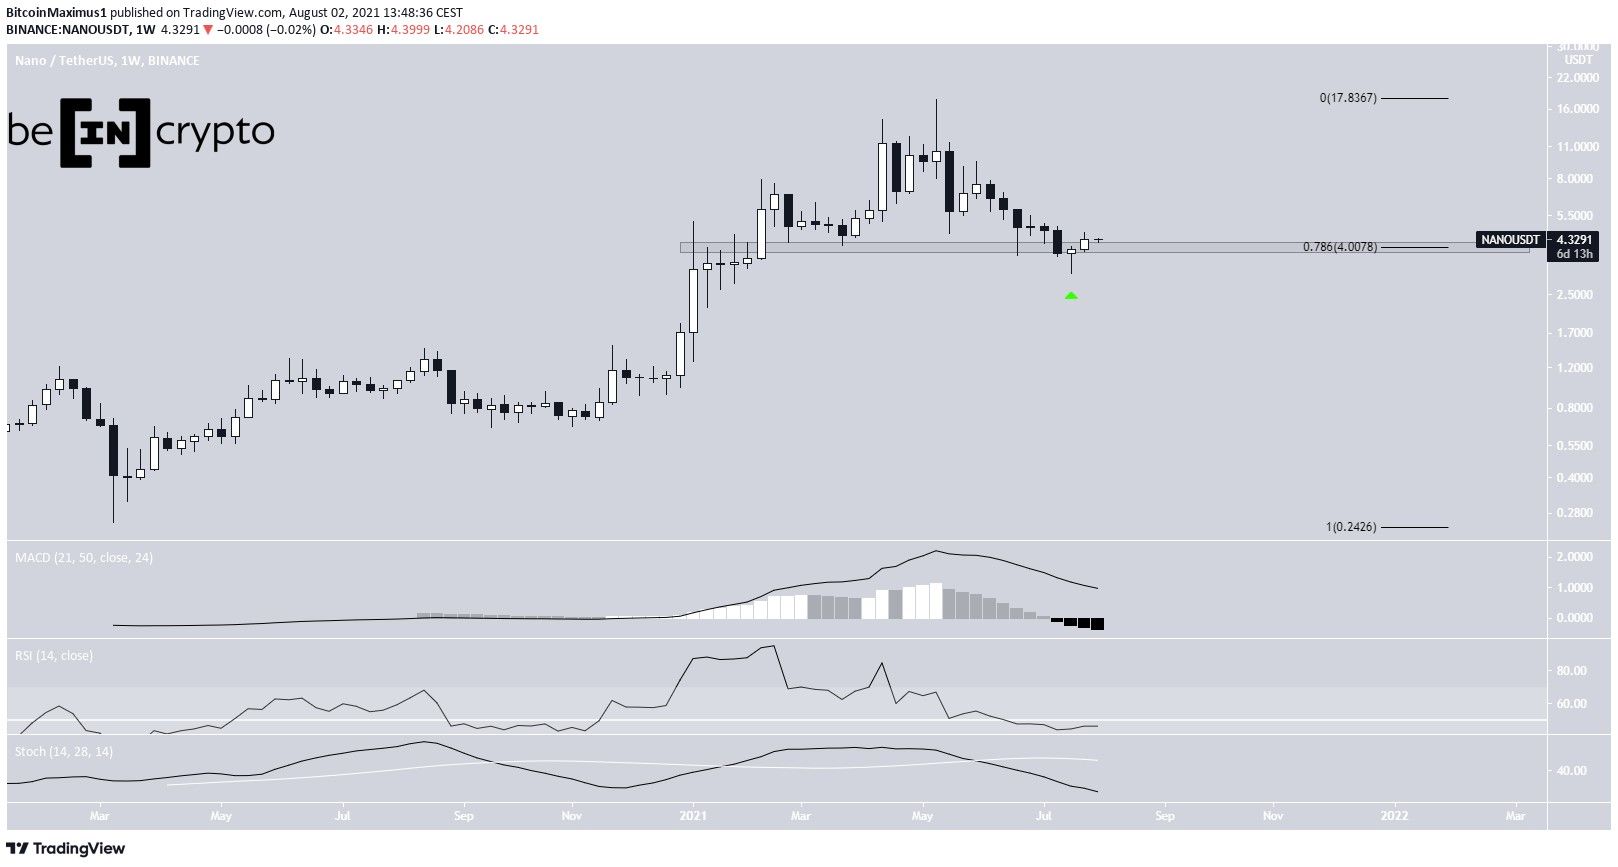
Nano (NANO) has been moving downwards since May 13, but bounced once it reached the $4 horizontal support area.
It has broken out from a descending wedge, potentially beginning a corrective retracement phase.
NANO bounces at long-term support
NANO has been moving downwards since May 13, when it reached a high of $17.70. So far, it has reached a low of $3.10, doing so on July 20.
However, NANO has been moving upwards since the June 22 low and has reclaimed the $4 area. This is important since the $4 area is both a horizontal support area and the 0.786 Fib retracement support level.
Despite the bounce, technical indicators in the weekly time-frame are still bearish. The RSI has fallen below 50, the Stochastic oscillator has made a bearish cross and the MACD is decreasing, approaching negative territory.
Future movement
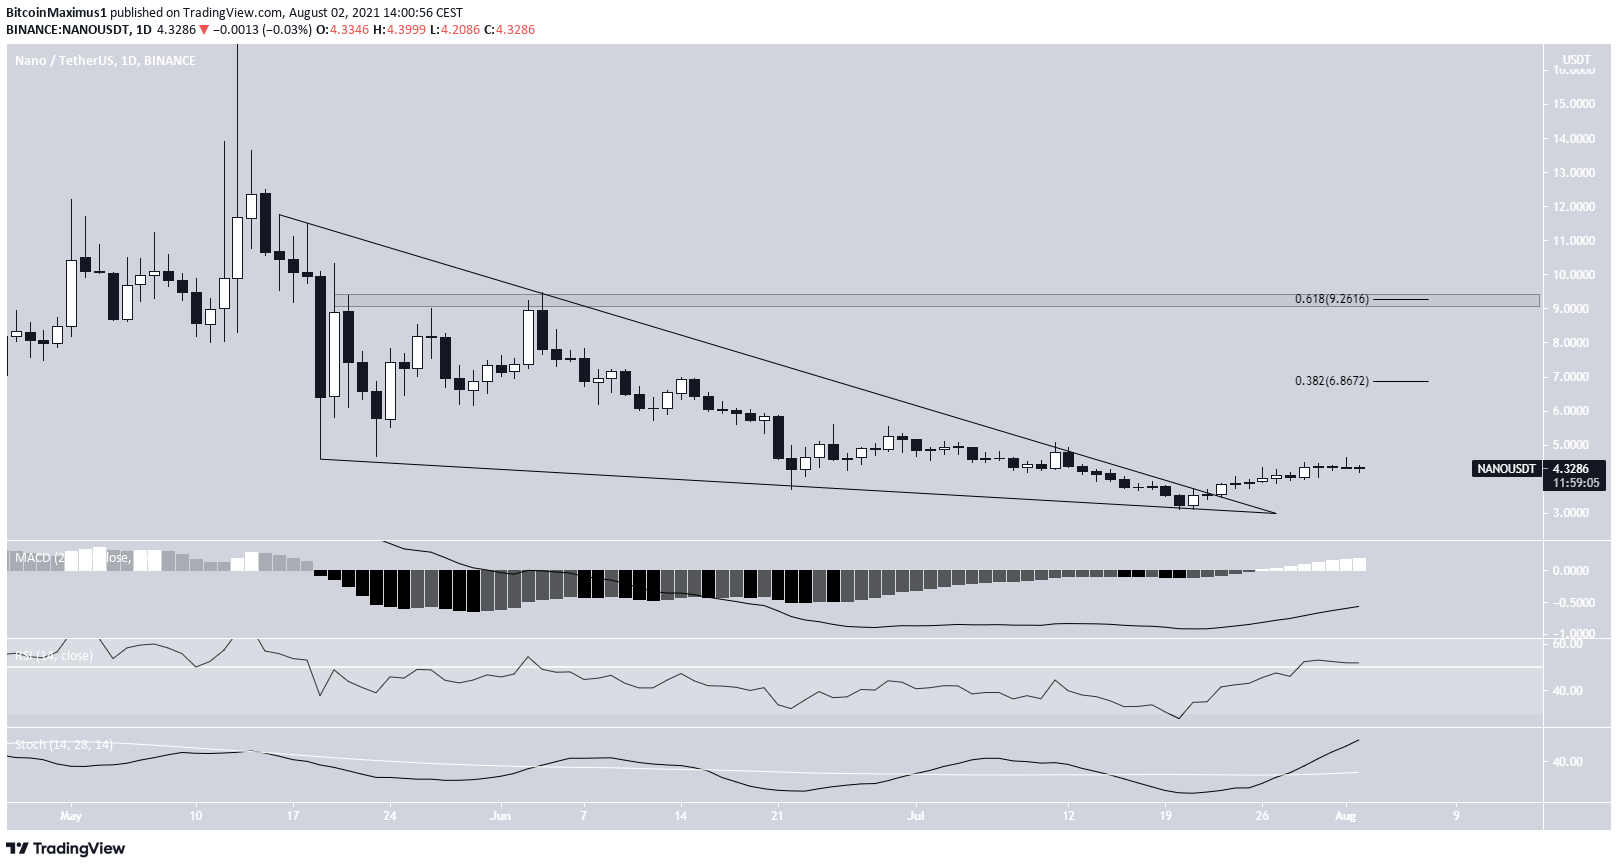
The daily chart provides a more bullish outlook.
NANO has broken out from a descending wedge, which is considered a bullish pattern. In addition to this, the RSI has moved above 50, the Stochastic oscillator has made a bullish cross and the MACD is moving upwards.
The main resistances are at $6.86 and $9.26.
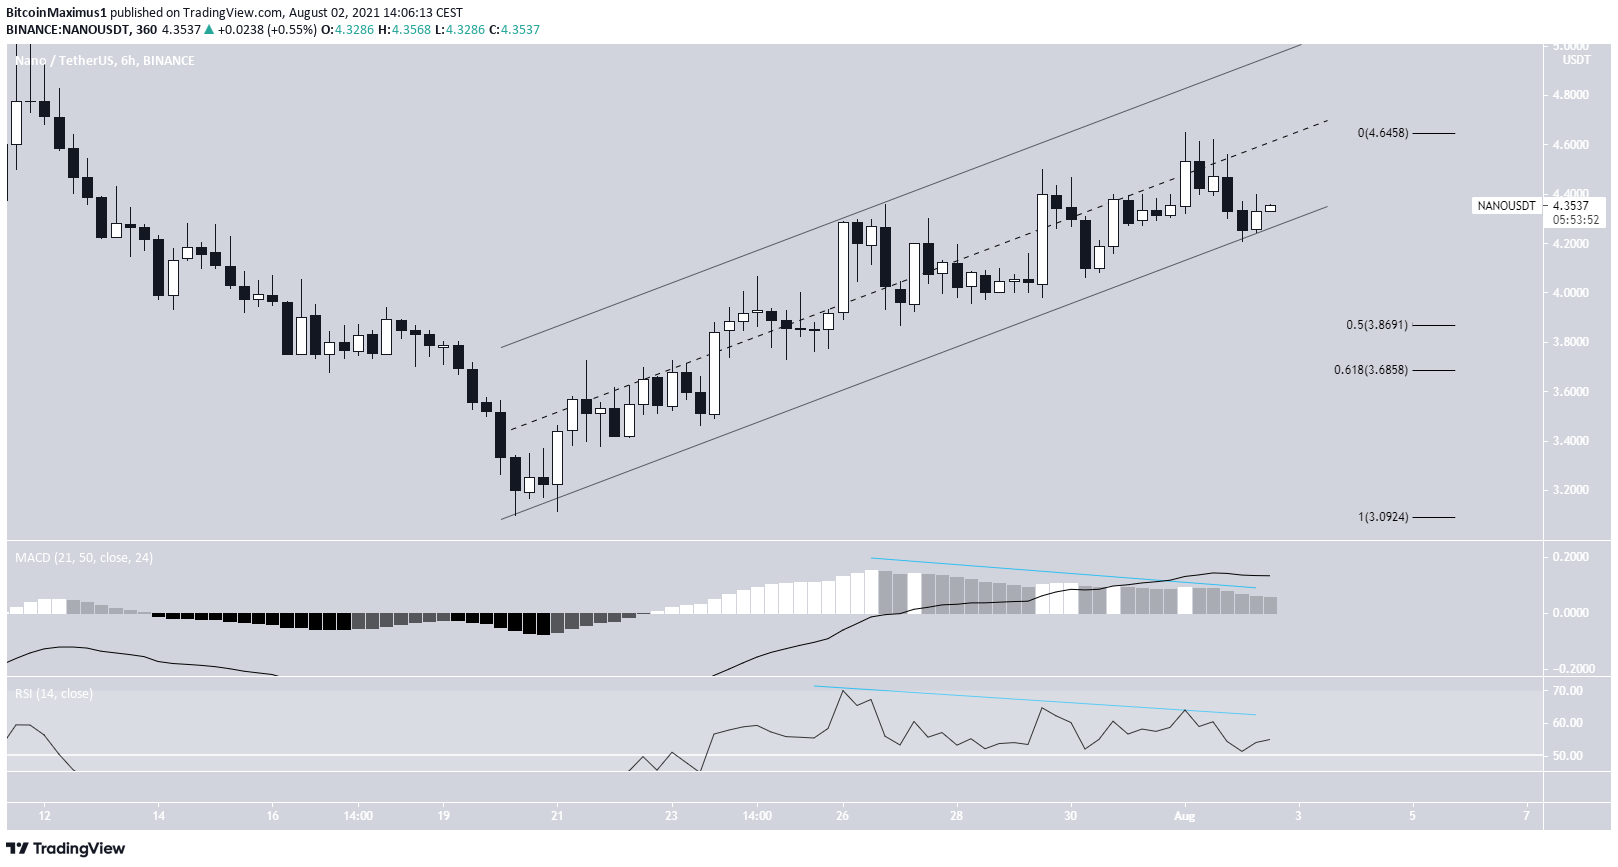
The shorter-term six-hour chart shows that NANO is trading inside an ascending parallel channel. The upward movement is gradual and choppy, thus it is likely to be corrective.
Furthermore, both the MACD & RSI have generated bearish divergences. Therefore, a breakdown from the channel is likely.
If one occurs, the main support area would be between $3.68 – $3.86, the 0.5-0.618 Fib retracement support levels.
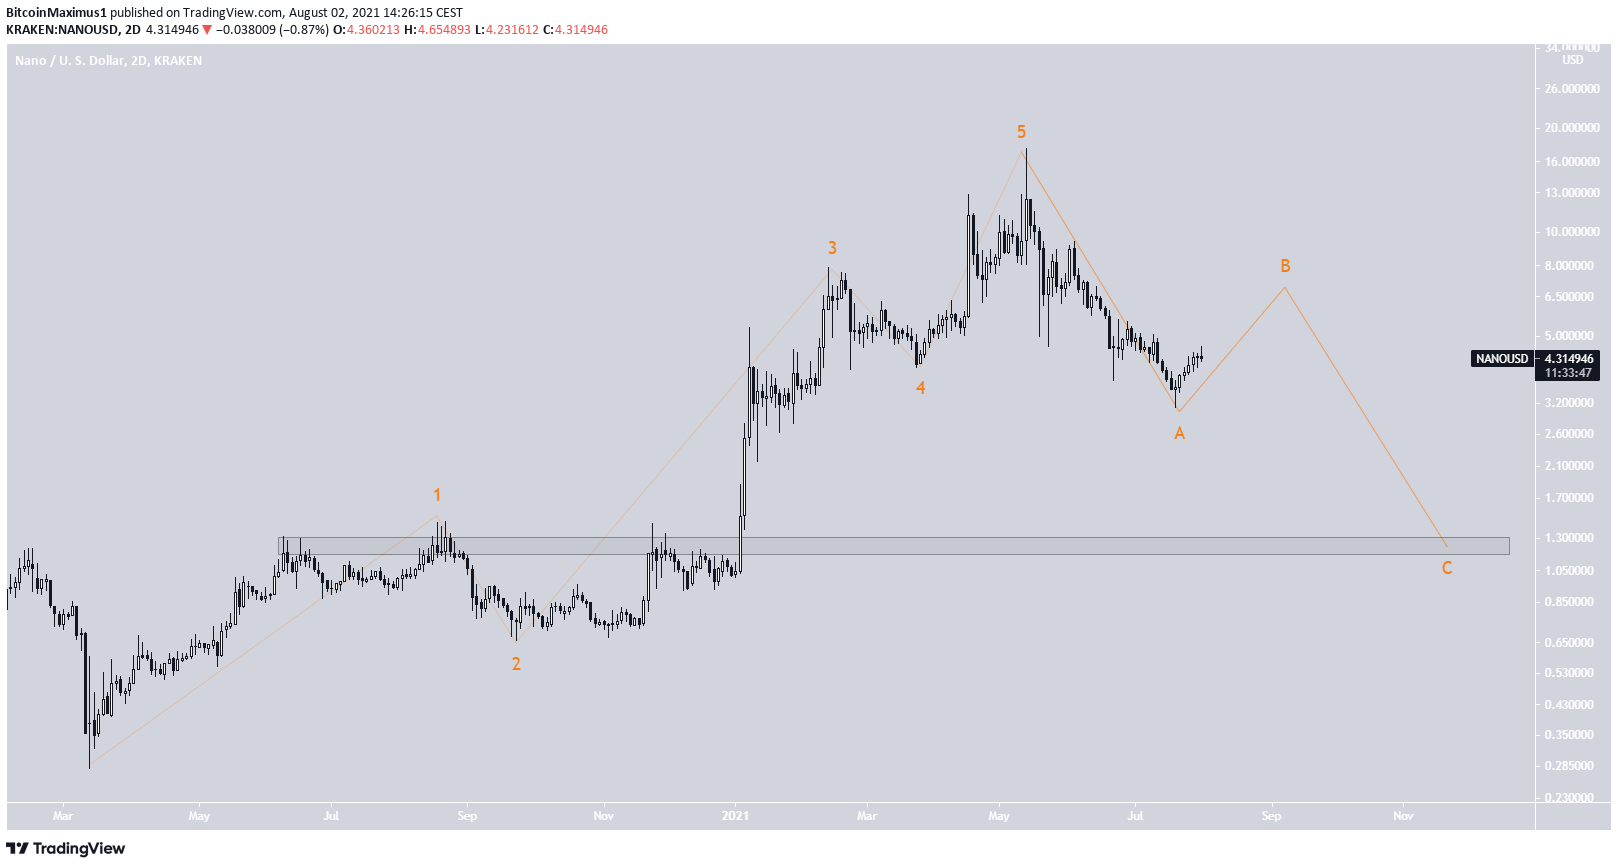
Wave count
Cryptocurrency trader @Mesawine1 outlined a NANO chart, stating that the token is completing an A-B-C corrective structure.

It is possible that NANO has completed a bullish impulse and is now in the B wave of an A-B-C corrective structure (orange).
If so, the B wave could potentially continue up until the $9.20 resistance area previously outlined.
While the bottom of the C wave depends on the length of the B one, the $1.20 area is a very strong horizontal support level, which could act as a bottom if it is reached.
For BeInCrypto’s latest bitcoin (BTC) analysis, click here.


