


Nano (NANO) has been increasing since July 20 and has reclaimed the $5.10 horizontal area in the process.
The token has yet to validate the area as support. Once it does, it could resume its upward movement towards the resistance levels provided below.
NANO reclaims resistance
NANO has been moving upwards since July 20, when it reached a low of $3.10. On Aug. 11, it managed to move above the $5.20 horizontal resistance area and proceeded to reach a high of $7.87 on Aug. 22.
However, it created a long upper wick and has been decreasing since. The drop was preceded by bearish divergences in both the RSI and MACD.
If the token continues decreasing, the $5.20 area is now expected to act as support. In addition to being a horizontal support area, it coincides with the Supertrend indicators support line (green line).
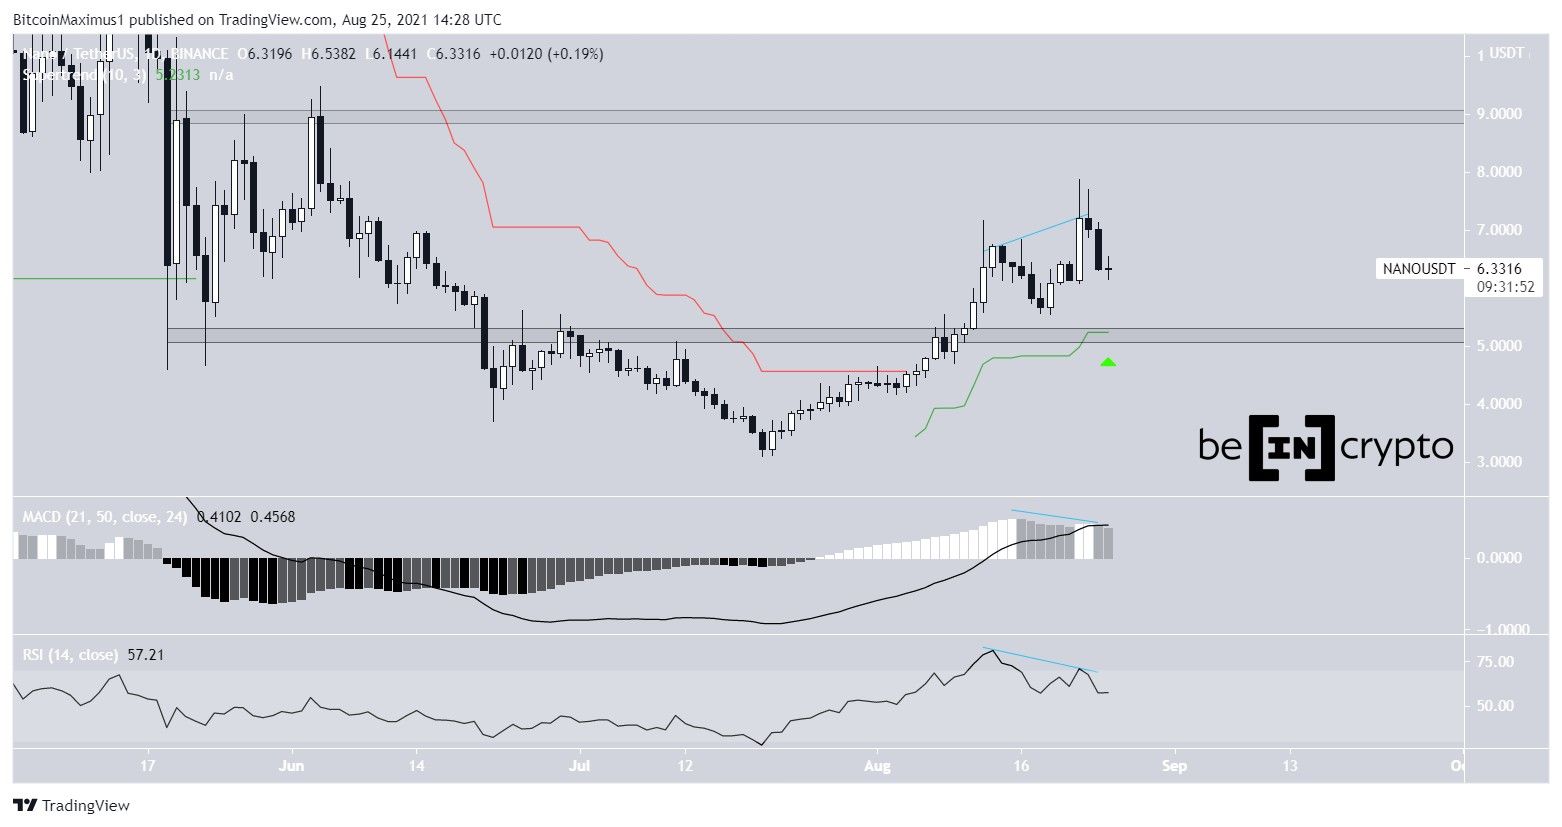
Cryptocurrency trader @IncomeSharks outlined a NANO chart, stating that there isn’t any resistance until $9. As seen above, the main resistance area is indeed found at $9.

Short-term movement
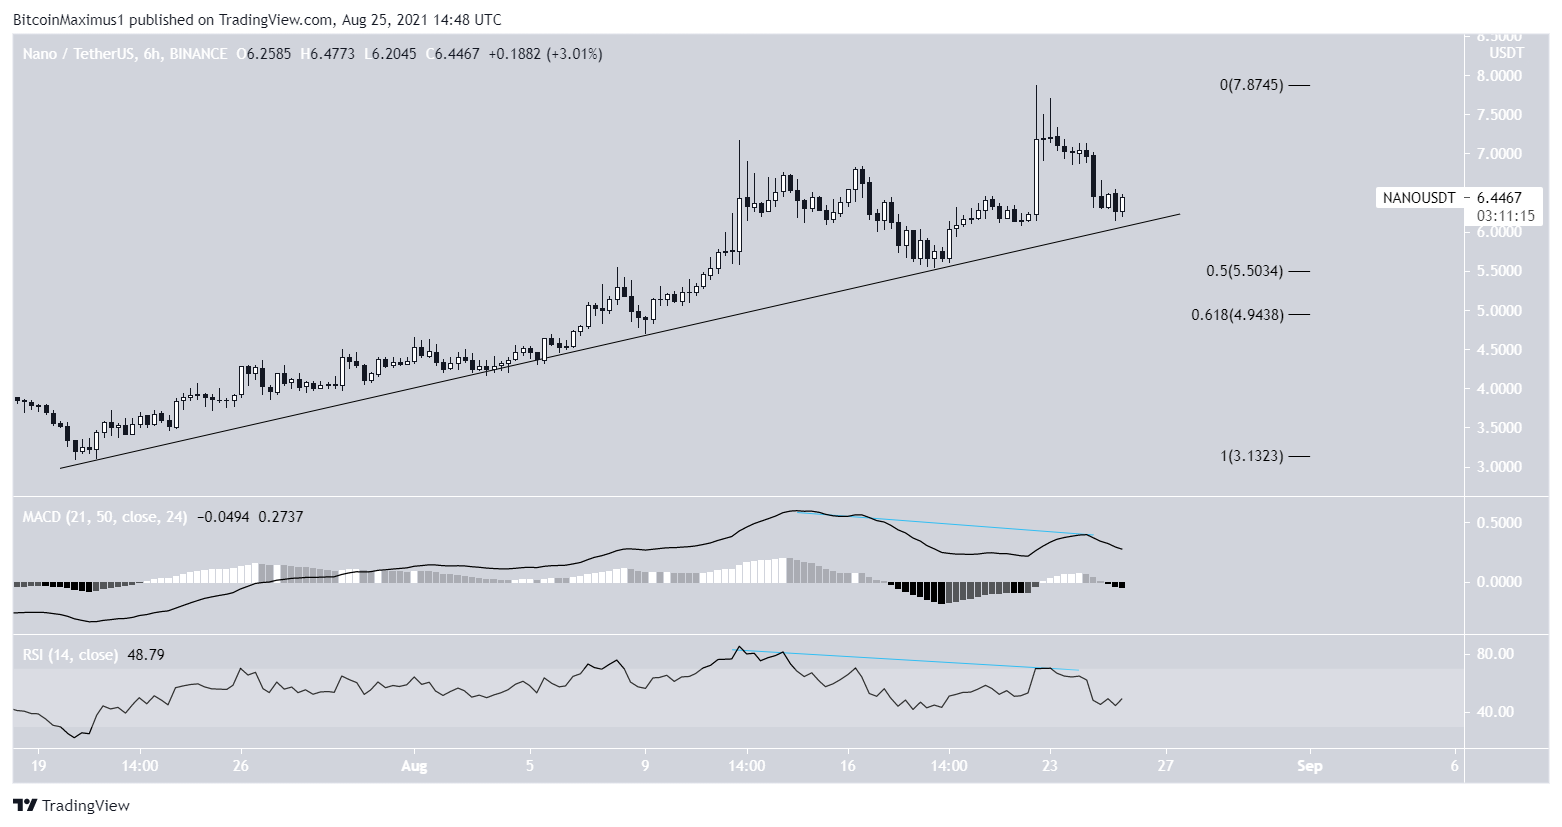
The shorter-term six-hour chart shows that NANO is still following an ascending support line.
Similarly to the daily time-frame, the drop was preceded by bearish divergences in both the MACD and RSI.
If the support line breaks, the previously outlined $5.20 horizontal support area would fall right between the 0.5 and 0.618 Fib retracement support levels.
Wave count
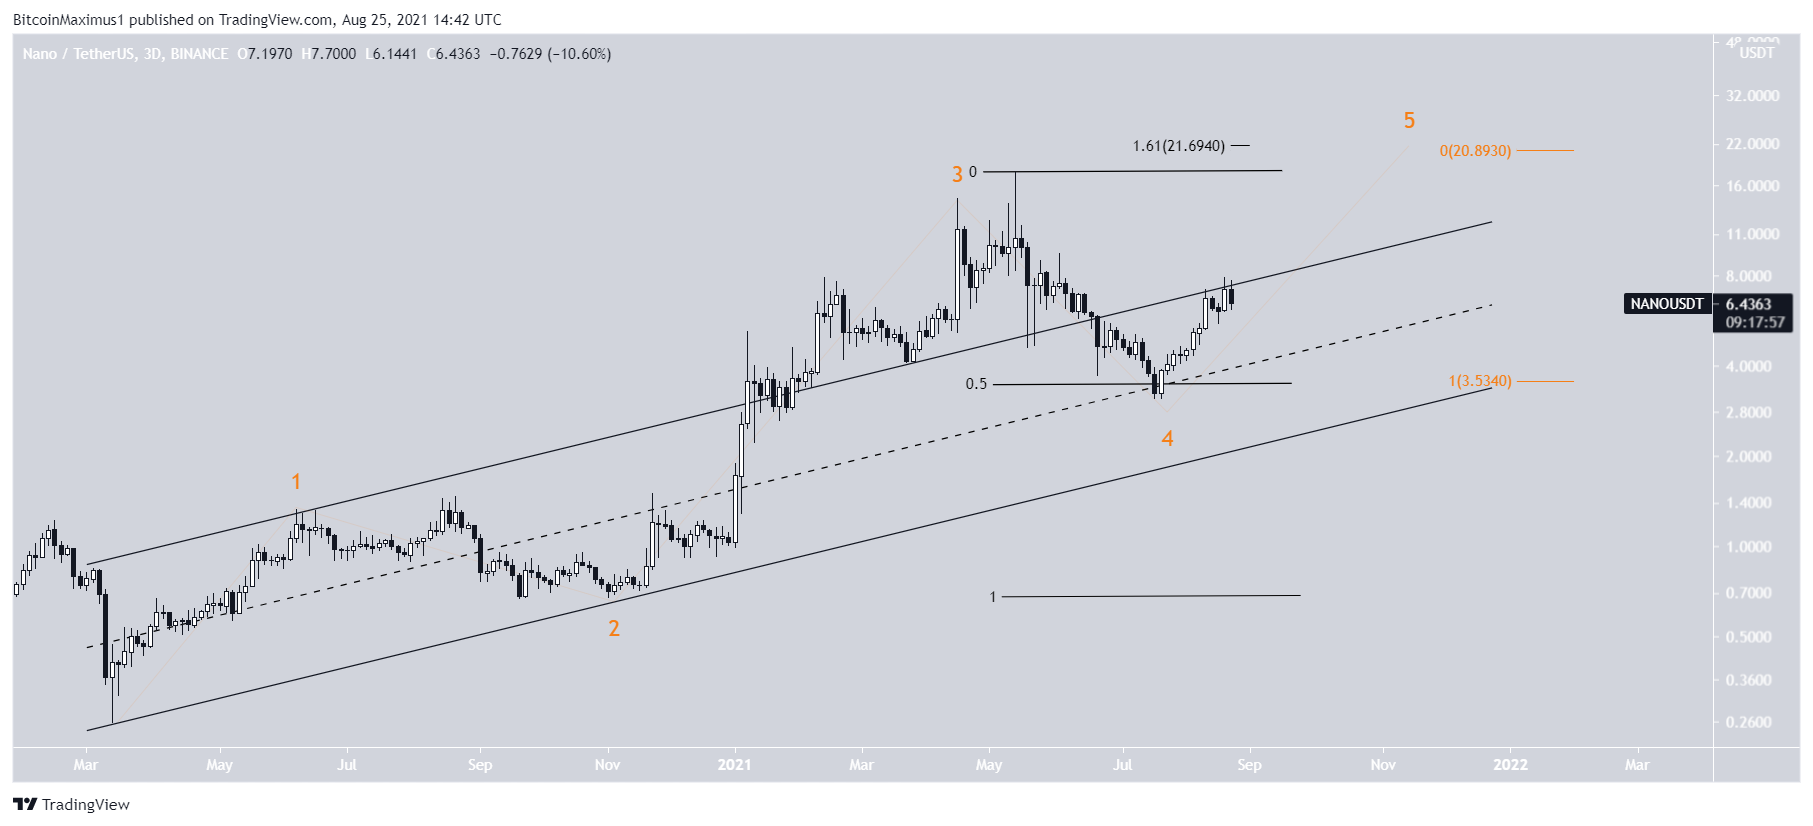
The wave count suggests that NANO might have just begun wave five (orange) of a bullish impulse that began on March 2020. It also completed a fourth wave pullback in the process, bouncing at the 0.5 Fib retracement support level.
A potential target for the top of the entire upward movement would be between $20.90-$21.70. The target is found using an external Fib retracement on wave four (black) and projecting the length of waves 1-3 (orange) to the bottom of wave four.
For BeInCrypto’s latest Bitcoin (BTC) analysis, click here.


