


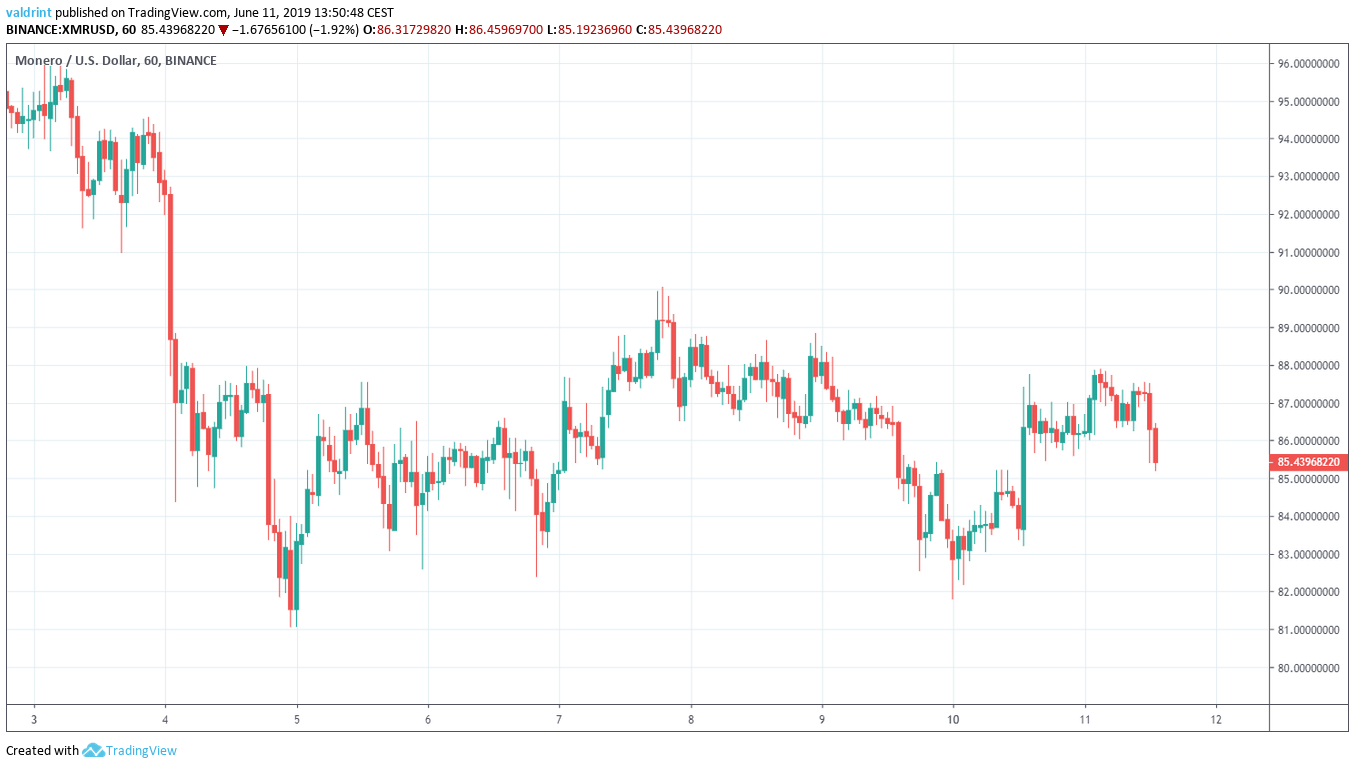
On June 3, 2019, the Monero price (XMR) reached a high of $95.92. A rapid decrease began and the price reached a low of $81.06 the next day. Since then, it has been increasing without experiencing significant fluctuations.
Below, we are going to analyze the Monero price (XMR) in different time-frames alongside technical indicators in order to try and predict its future movement. (For our previous analysis, click here)
Monero Price (XMR): Trends and Highlights for June 11
- The Monero price has been on a downtrend since June 4.
- It is trading inside a symmetrical triangle.
- It is following a long-term ascending support line.
- There is bullish divergence developing in the RSI.
- The 10- and 20-day moving averages have made a bearish cross.
- There is resistance near $90 and support near $75.
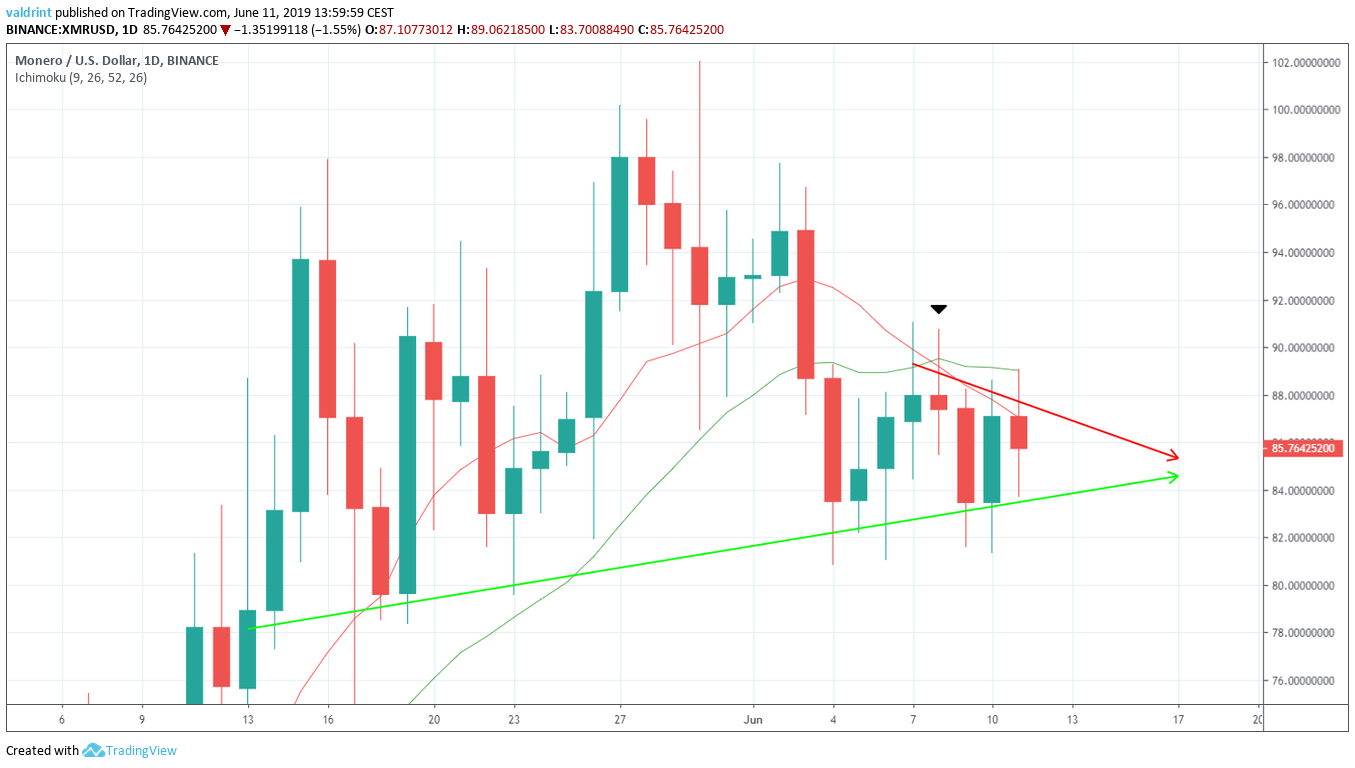
Symmetrical Triangle
On June 4, the XMR/USD reached a low of $81.06. A gradual increase ensued and the price made a high of $90.05 on June 7.
Since then, it has been decreasing, trading inside the symmetrical triangle outlined below:
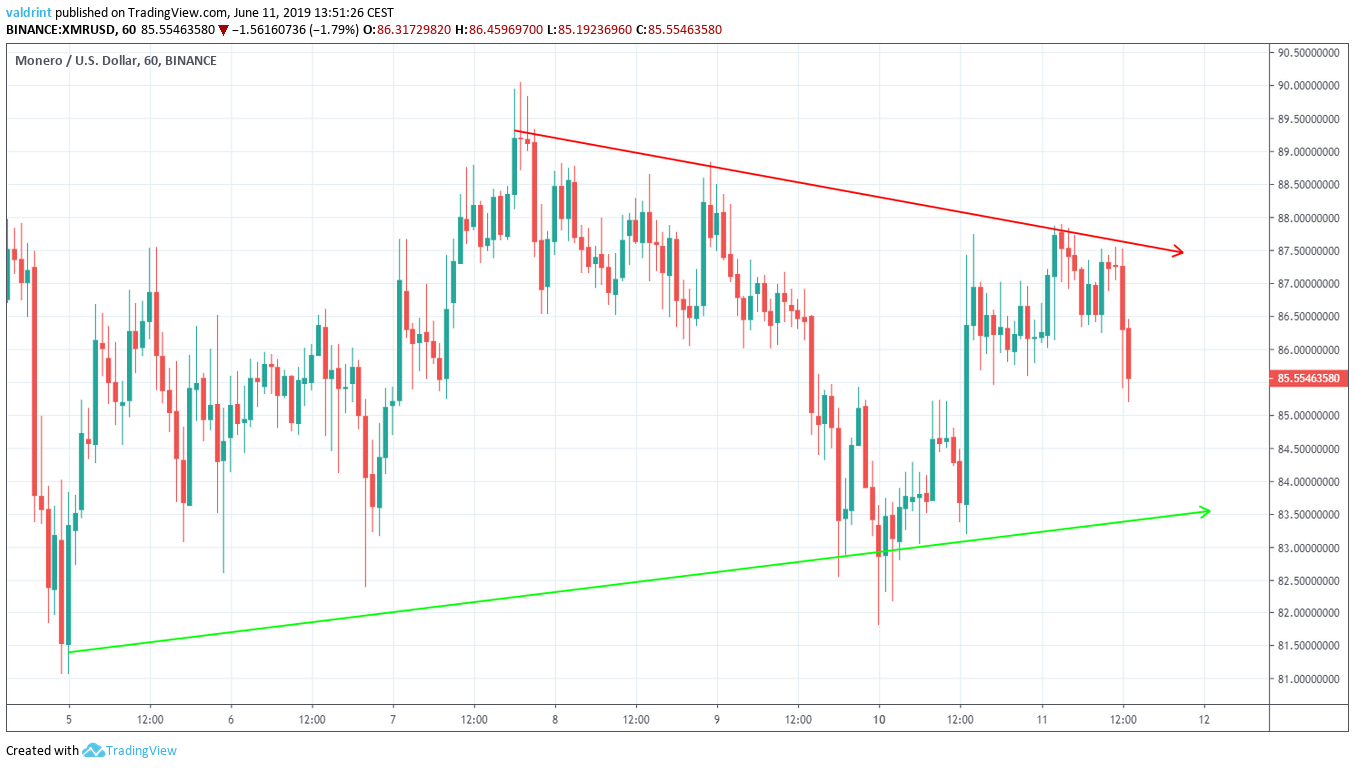
On June 11, the Monero price (XRP) got rejected by the resistance line of the channel. At the time of writing, it was decreasing, heading towards the support line.
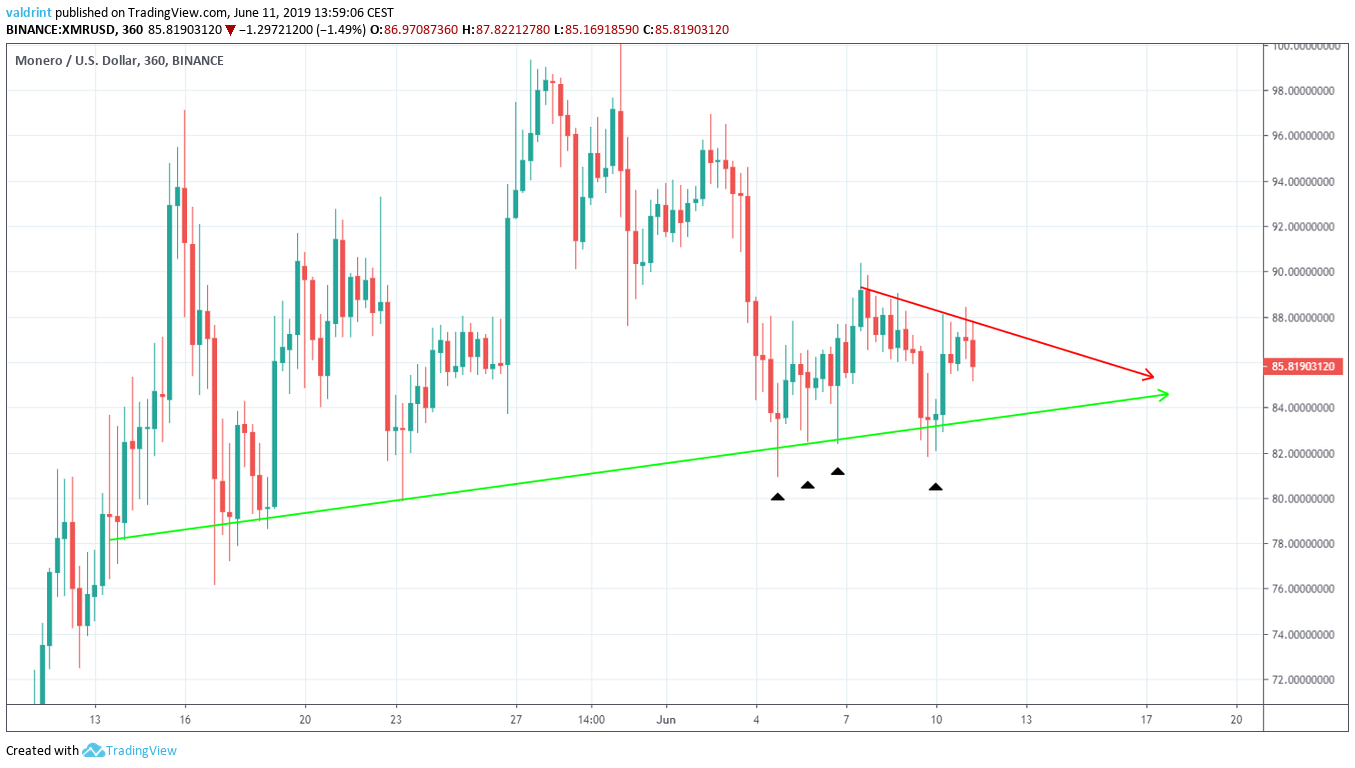
Furthermore, we can see that it has been following an ascending support line since reaching lows of $76.39 on May 13.
The support line coincides with the short-term support line of the symmetrical triangle.
The candlesticks which have had values near $82 have been characterized with long lower wicks, indicating that there is significant buying power around that area. This was especially evident on June 10, when after two doji’s, the price created a bullish engulfing candle. This is known as a morning star, and it is a bullish reversal pattern.
Will the Monero price (XMR) break out of the symmetrical triangle? A look at technical indicators is required in order to find out.
Monero Price (XMR): Technical Indicators
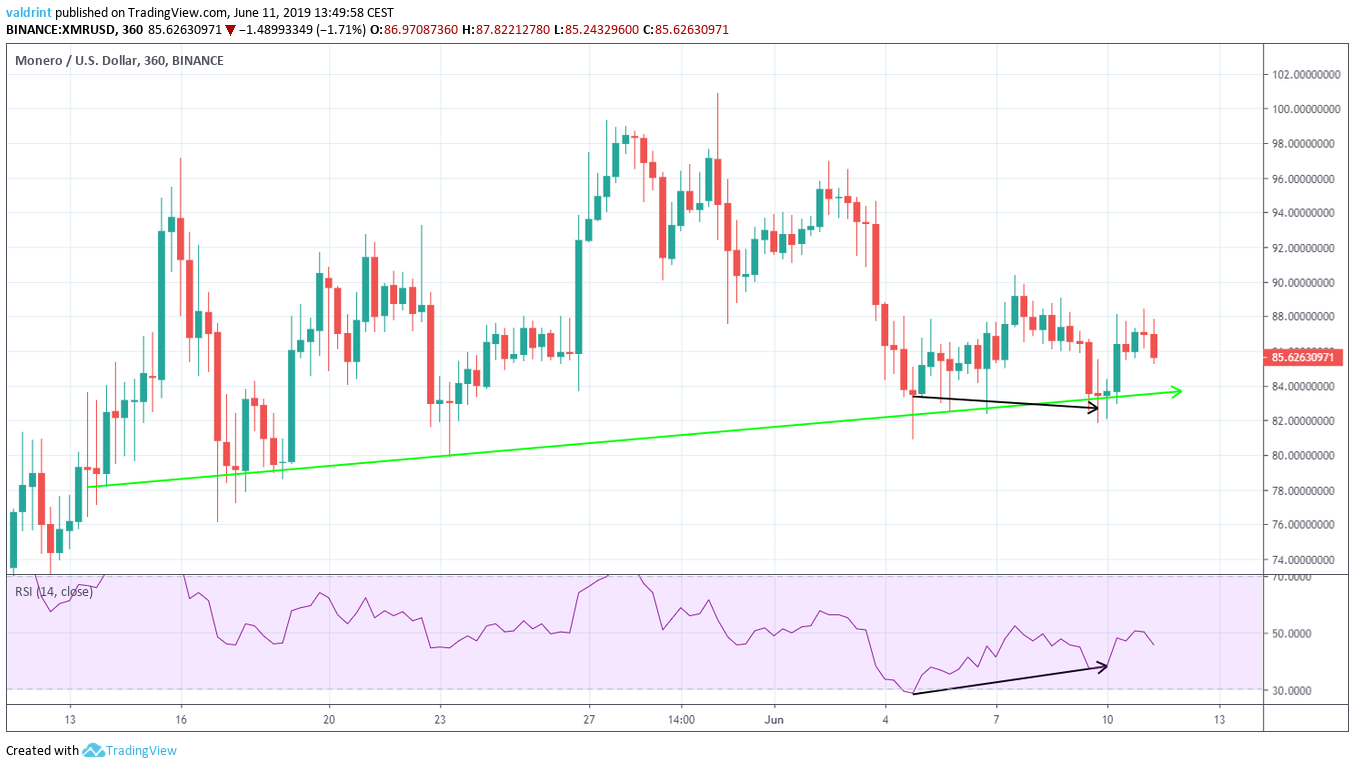
On June 4 and 10, the Monero price (XMR) created two lower lows. During this interval, the RSI created higher lows. This is known as bullish divergence and often precedes price increases.
Furthermore, it has occurred right on the support line, increasing its validity. However, it is only present in six-hours and shorter time-frames.
On June 8, the 10-day MA crossed below the 20-day one. This is known as a bearish cross and often indicates that a downtrend has begun. The price is trading below both MAs and is facing close resistance from them. It has made several unsuccessful attempts at a breakout, on June 6, 7 and 11.
The use of these indicators suggest that the Monero price (XMR) might be beginning a downtrend. However, it also supports a short-term upward move. Therefore, a breakout from the triangle is likely, but the price will eventually begin a reversal. It unlikely that the price will reach a high above that on May 30.
Reversal Areas
One support and one resistance area is shown below for XMR/USD:
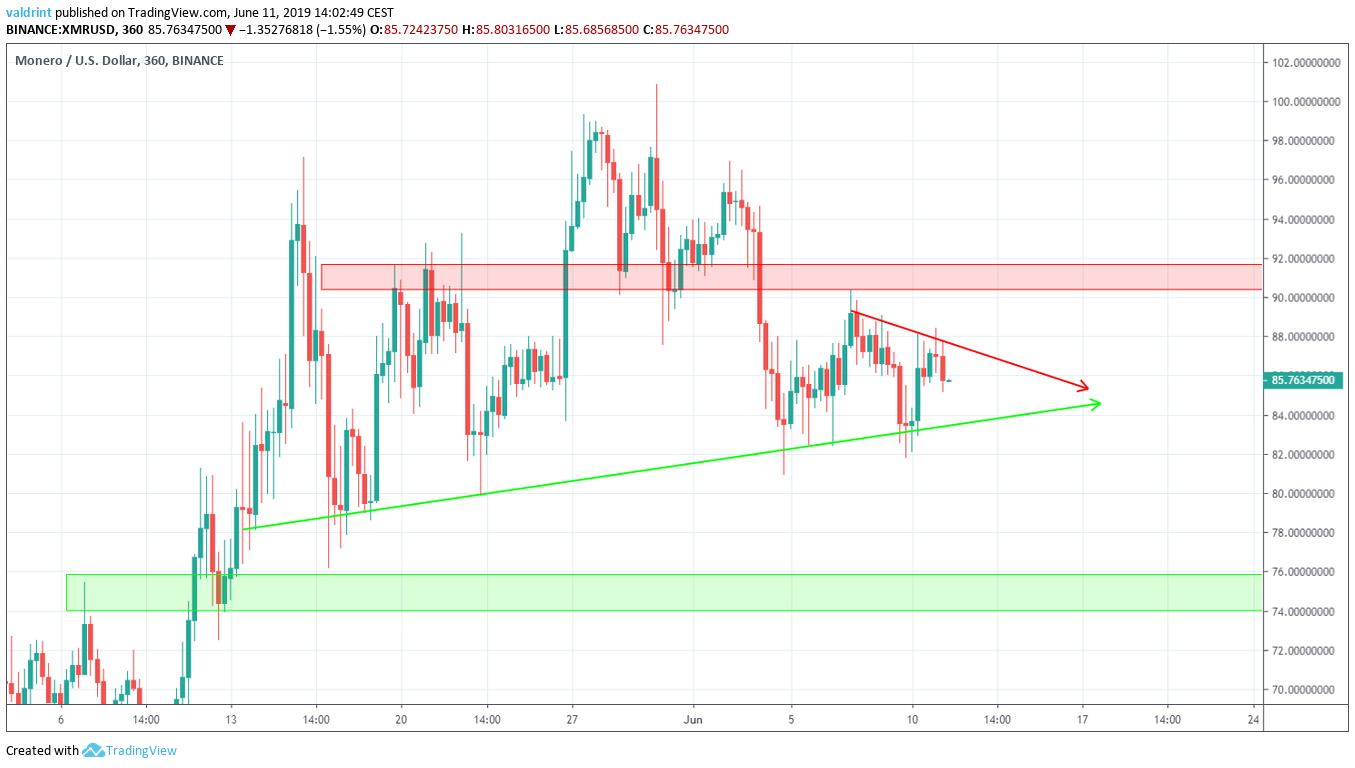
The closest resistance area is found near $91. If the Monero price (XMR) breaks out from the triangle, it is likely to provide reversal. According to technical indicators, this is likely to occur.
The closest support area is found near $75. If the price breaks down from the support line, it is likely to provide support and possibly initiate an upward move.
Summary
The Monero price (XMR) reached a high on June 3 and has been decreasing since. It is trading inside a symmetrical triangle. The short-term technical indicators give a bullish outlook. However, in the long-term, it is likely that a downtrend has begun. The analysis of technical indicators supports a breakout from the triangle. However, it is possible that it will be only a short-term increase inside a longer downtrend.
Do you think the Monero price will break out from the triangle? Let us know your thoughts in the comments below.
Disclaimer: This article is not trading advice and should not be construed as such. Always consult a trained financial professional before investing in cryptocurrencies, as the market is particularly volatile.


