


Both The Sandbox (SAND) and Decentraland (MANA) are trading inside short-term bullish patterns and are showing signs of impending breakouts.
SAND is the native token of The Sandbox, a blockchain-based virtual world that allows users to create, buy and sell digital assets in the form of a game.
The Sandbox is on a massive metaverse adoption goal to build a themed metaverse based on major cities in the world.
It will be launching “Dubaiverse”, a central hub and gaming metaverse and will be built through local collaborations with businesses in entertainment, gaming and real estate.
This is an extremely positive development and could potentially cause relief in the price of SAND, which is very close to its yearly lows.
SAND
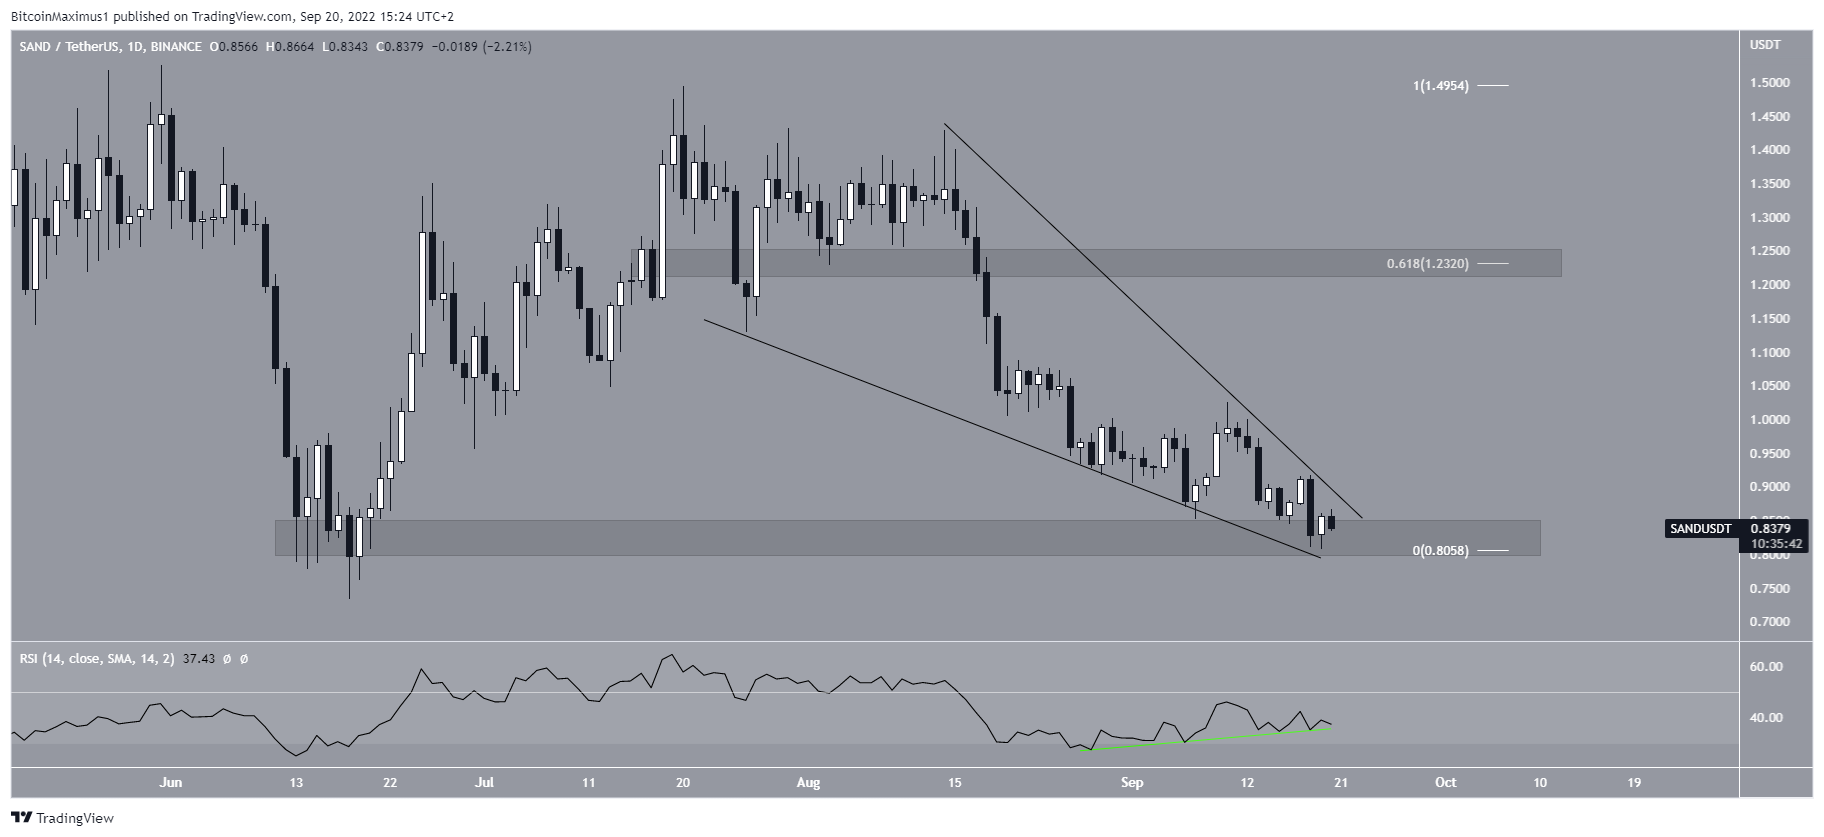
SAND has been falling inside a descending wedge since reaching a high of $1.42 on Aug. 14. The descending wedge is considered a bullish pattern, meaning that an eventual breakout from the pattern is expected.
Currently, SAND is very close to the point of convergence between resistance and support. Therefore, a decisive movement is expected to occur soon.
Readings from technical indicators and the price movement decisively suggest that a breakout from the wedge is expected.
Firstly, the price is trading inside the $0.80 horizontal support area, which marked the bottom in June. Secondly, the daily RSI has been generating bullish divergence over the past month (green line).
As a result of these readings, a breakout from the wedge is expected. If one occurs, the first resistance area would be at $1.23. This is the 0.618 Fib retracement resistance level and also a horizontal resistance area.
MANA
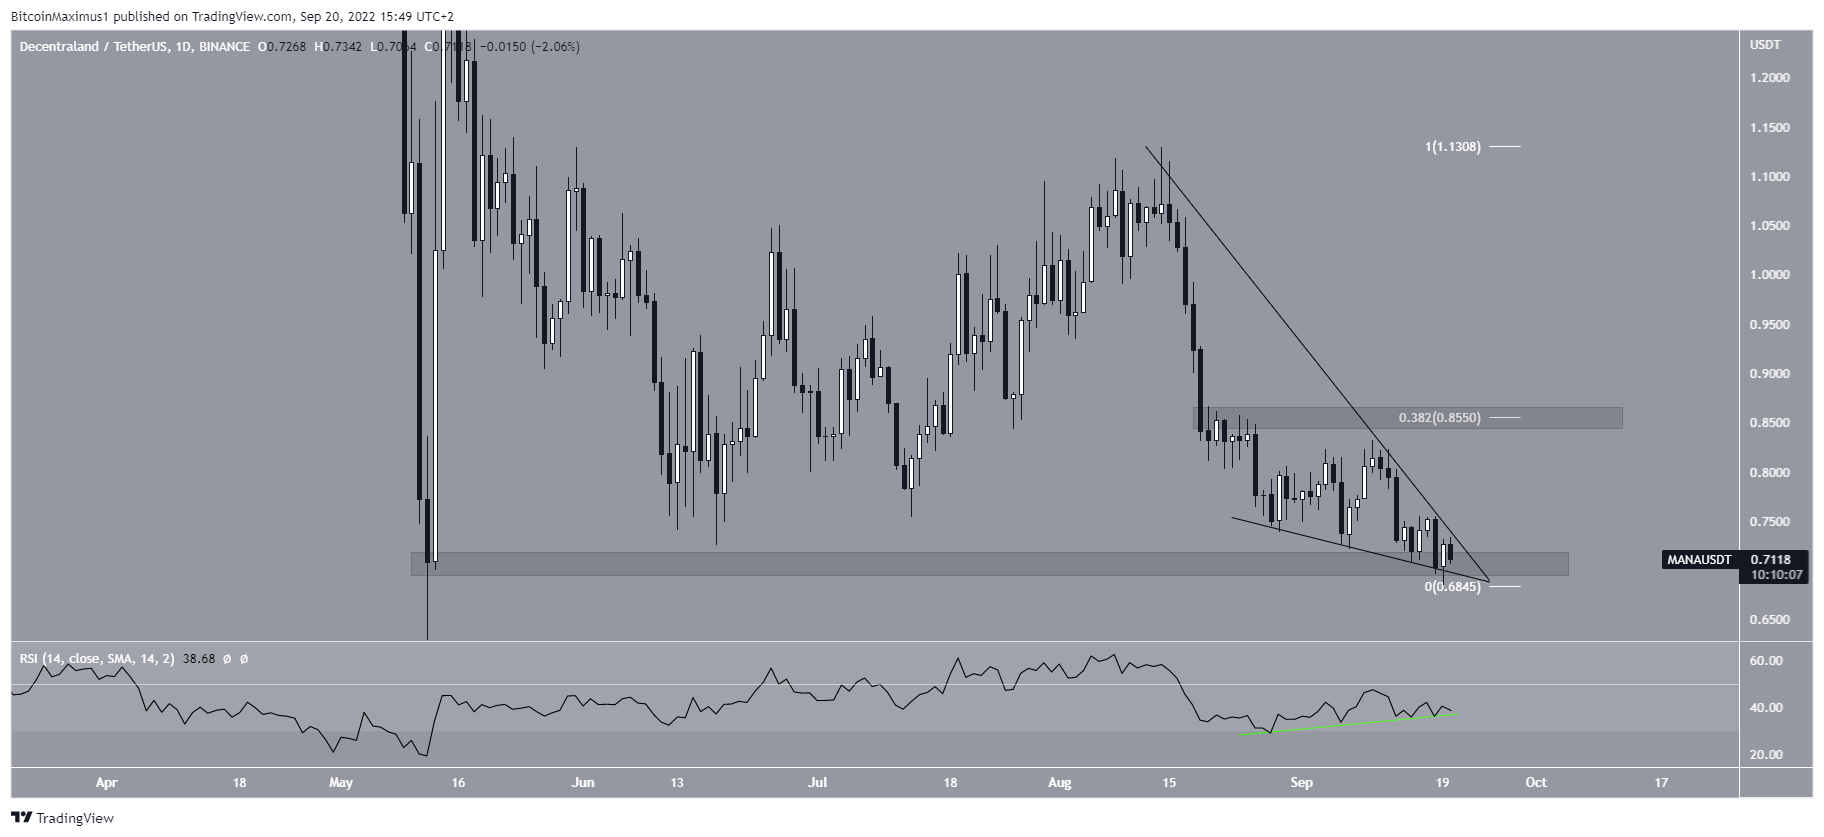
The price movement and readings for MANA are eerily similar to those of SAND. The price has been falling inside a descending wedge since Aug. 12 and has nearly reached the projected end of the pattern.
Furthermore, MANA has bounced at the $0.70 support area, which marked the May bottom. Additionally, the daily RSI has generated bullish divergence, supporting the possibility of a breakout.
If one occurs, the closest resistance area would be at $0.85, created by the 0.382 Fib retracement resistance level and a horizontal resistance area.
For Be[In]Crypto’s latest Bitcoin (BTC) analysis, click here


