


Decentraland (MANA) price broke down below the $0.70 horizontal support area. It was rejected in an attempt to reclaim it. The Sandbox (SAND) previously broke down from the $0.82 level but managed to successfully reclaim it.
Decentraland Fails to Reclaim Breakdown Level
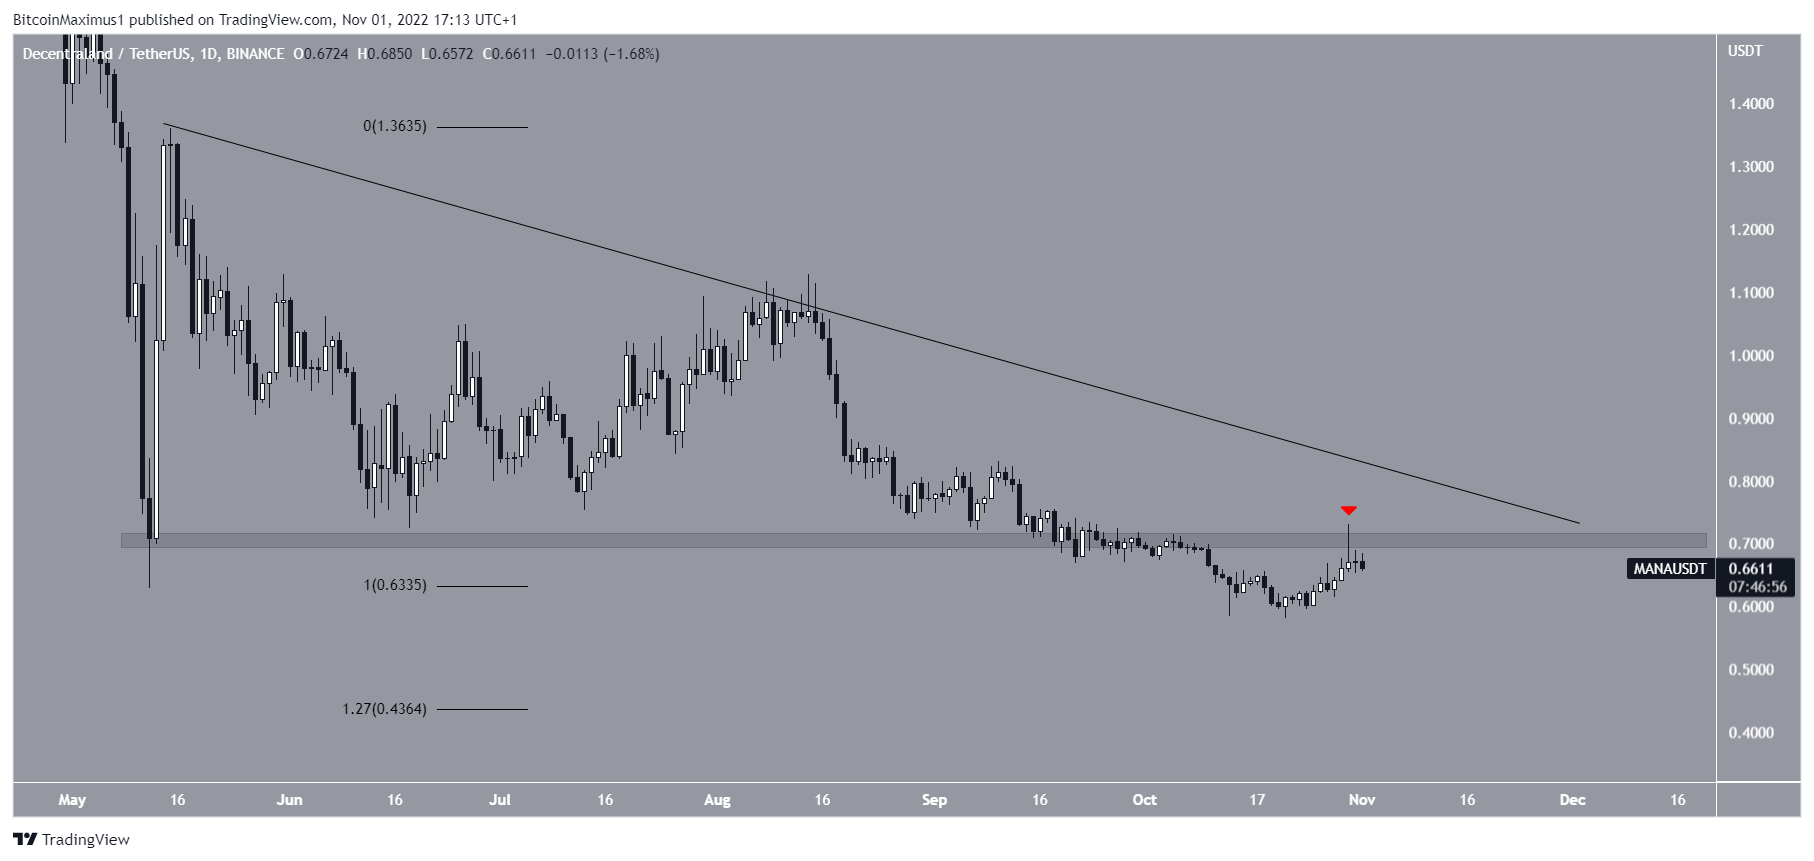
Decentraland is the native token of a virtual world and a non-fungible token (NFT) marketplace, where players can buy land, estates and other game assets. The MANA price has fallen below a descending resistance line since May 15.
On Oct. 2, MANA price broke down below the $0.70 horizontal area and reached a new yearly low of $0.58 on Oct. 21.
While it initiated an upward movement afterward, it was rejected by the $0.70 area on Oct. 30 (red icon). The trend cannot be considered bullish unless the Decentraland price manages to reclaim the area and then break out from the resistance line.
If the downward movement continues, the next closest support area would be at $0.44. The support is created by the 1.27 external Fib retracement of the most recent increase.
Sandbox Initiates Unlikely Reversal
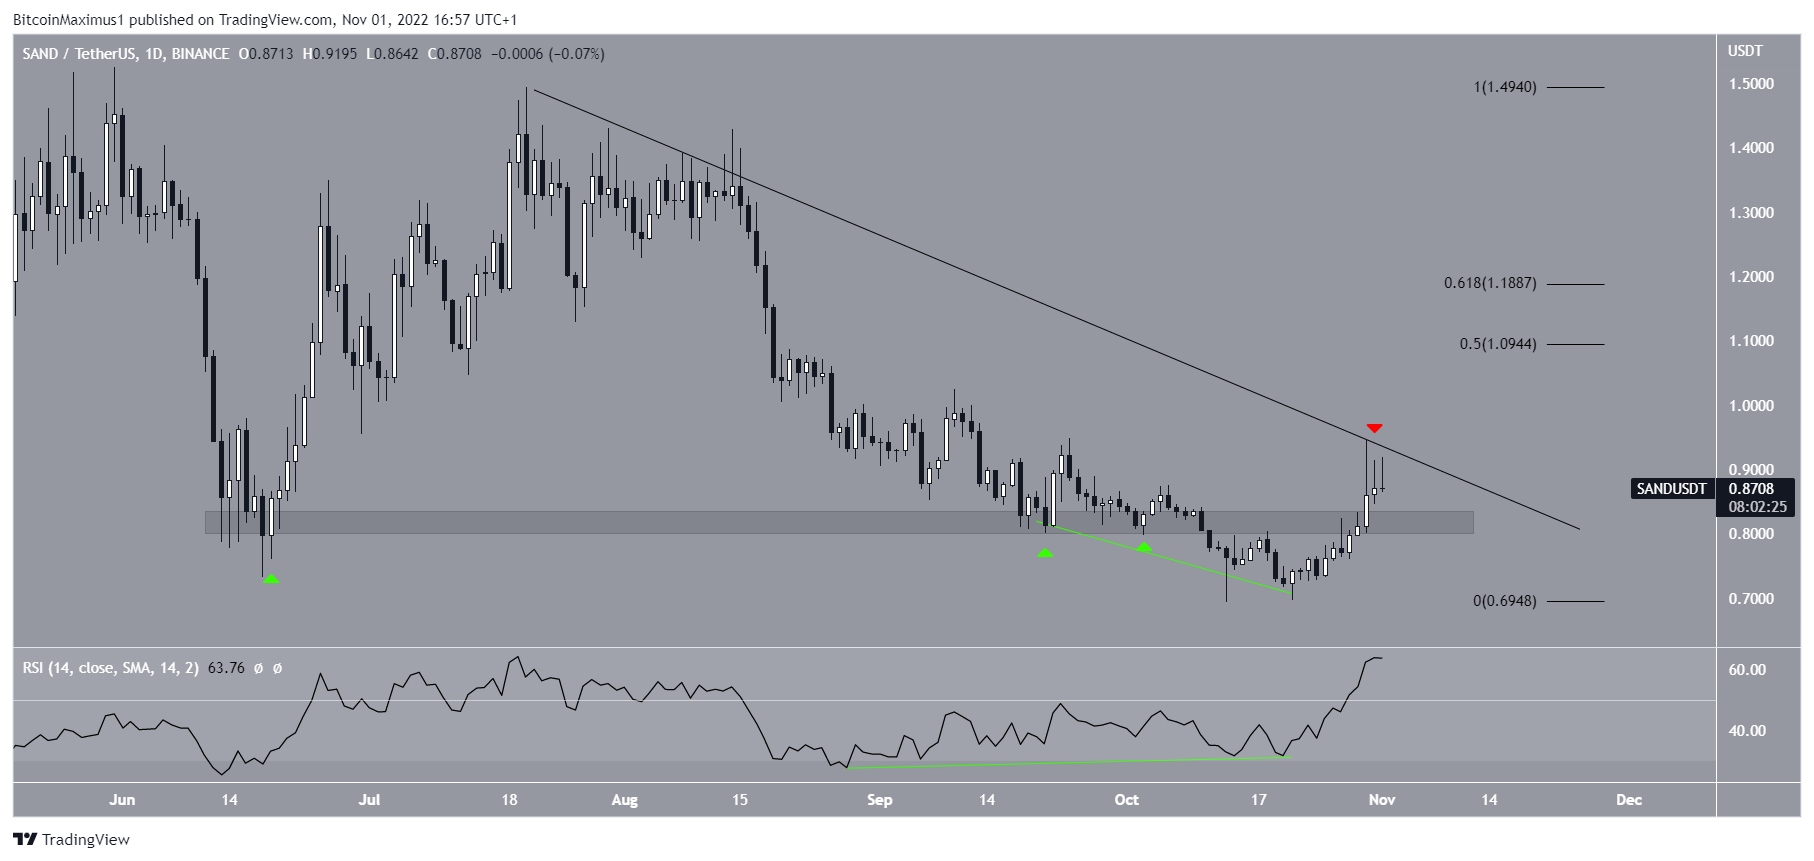
Sandbox (SAND) is another coin that relates to the metaverse since it is the native token of a blockchain game. The SAND price had fallen underneath a descending resistance line since reaching a high of $1.49 on July 20. The downward movement led to a low of $0.69 on Oct. 13, seemingly causing a breakdown below the $0.82 support area.
This was a crucial development since the $0.82 area had provided the previous yearly low support.
However, the SAND price initiated a trend reversal and reclaimed the area on Oct. 30.
The upward movement was preceded by a bullish divergence in the RSI (green line). The indicator has now moved above 50, confirming the divergence and granting legitimacy to the reversal.
However, the Sandbox price has yet to break out from the resistance mentioned above (red icon). As a result, it did not confirm its reversal.
The main resistance area is between $1.09-$1.19, created by the 0.5-0.618 Fib retracement resistance levels. The reaction once the SAND price gets there will likely determine the direction of the future trend.
For the latest BeInCrypto Bitcoin (BTC) and crypto market analysis, click here
Disclaimer: BeInCrypto strives to provide accurate and up-to-date information, but it will not be responsible for any missing facts or inaccurate information. You comply and understand that you should use any of this information at your own risk. Cryptocurrencies are highly volatile financial assets, so research and make your own financial decisions


