
Memecore (M) is trading at $2.20, pulling back 9.25% after the previous session’s explosive rally. The move wiped out $1.7 million in short positions across five exchanges on March 25 alone, but historical price behavior following similar liquidation events suggests the rally is already exhausted.
The bearish divergence forming on the Chaikin Money Flow (CMF) indicator and a consistent pattern of post-spike reversals visible on the liquidation chart both point toward lower prices from here.
This Pattern Suggests Reversal
The Coinglass total liquidations chart covers Memecore from late September 2025 through March 25, 2026. The pattern is consistent across every major liquidation event in that period. In early October, a large, long liquidation spike reaching approximately $1.79 million was immediately followed by a sharp price decline. In late October and early November, additional short liquidation clusters were each followed by the price failing to hold the post-squeeze level.
Want more token insights like this? Sign up for Editor Harsh Notariya’s Daily Crypto Newsletter here.
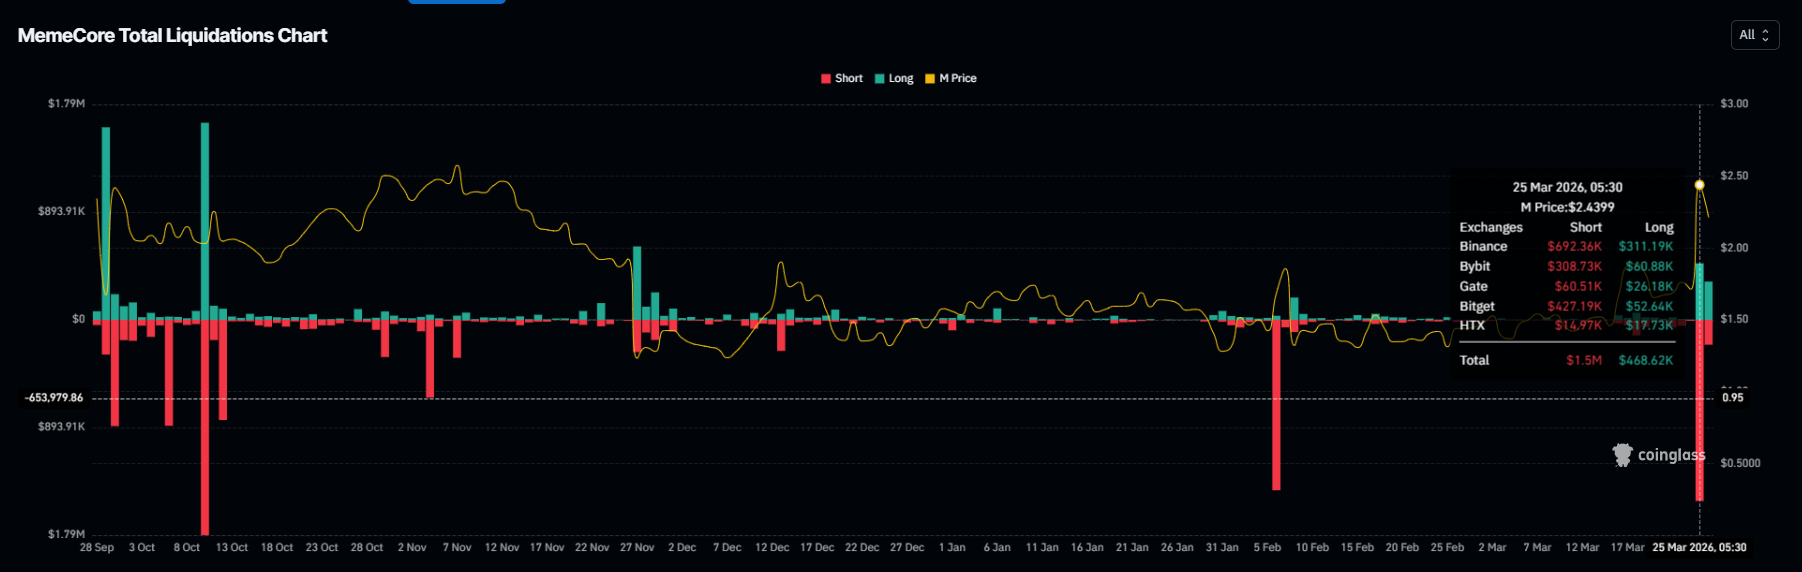
The October 10 event produced the largest short liquidation visible on the chart before March 25. Price did not sustain gains after that event either, and similarly during the February 5 event as well.
On March 25, the breakout triggered $1.7 million in total short liquidations across exchanges, with $468,620 in longs also liquidated. Every comparable event on this chart was followed by a reversal within one to two sessions.
Capital Outflows Will Be Reflected Soon
The CMF on the daily chart tells the most important story. The indicator peaked at approximately 0.25 on March 17 and has been declining in a straight line ever since, sitting at just 0.09 as of March 26, against the rising prices.
This is a textbook bearish divergence. Memecore price is rising, and CMF is falling, meaning that the volume-weighted money flow is not supporting the move higher. Buyers are not committing fresh capital into the rally — the price increase has been driven primarily by the short squeeze mechanics rather than genuine demand entering the market.
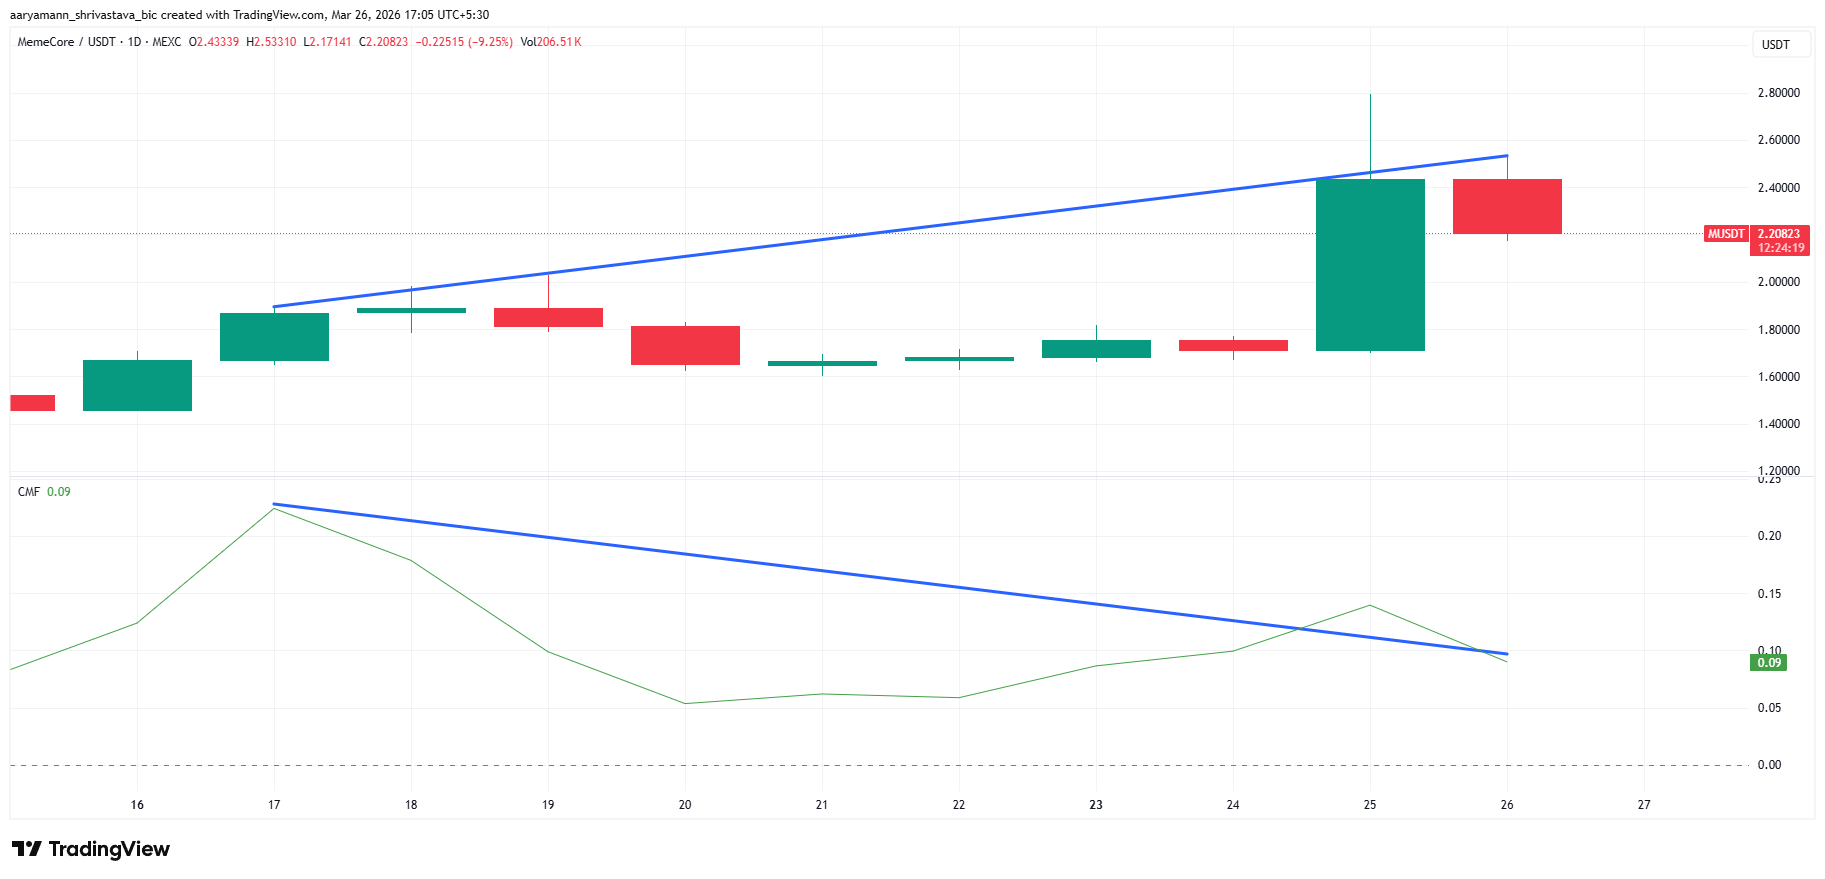
CMF at 0.09 remains positive, meaning capital is still nominally flowing in on net. However, the descending trendline on the indicator projects it crossing zero in the coming sessions if the current trajectory continues. A CMF reading below zero would confirm that capital is actively leaving Memecore. This would remove the last technical support for the current price level.
Memecore Price May See a Decline
The Fibonacci retracement chart runs from the zero level at $1.60 to the current measured move high. The 0.618 level sits at $2.02, highlighted by the green horizontal line. The 1.0 level sits at $2.29 and the 1.236 level at $2.45.
Memecore price opened on March 26 below the 1.236 level after failing to close above it on March 25. The annotated measured move on the chart shows a prior 29.80% gain from the base of the March 25 candle. That move has now partially reversed, with the price at $2.20.
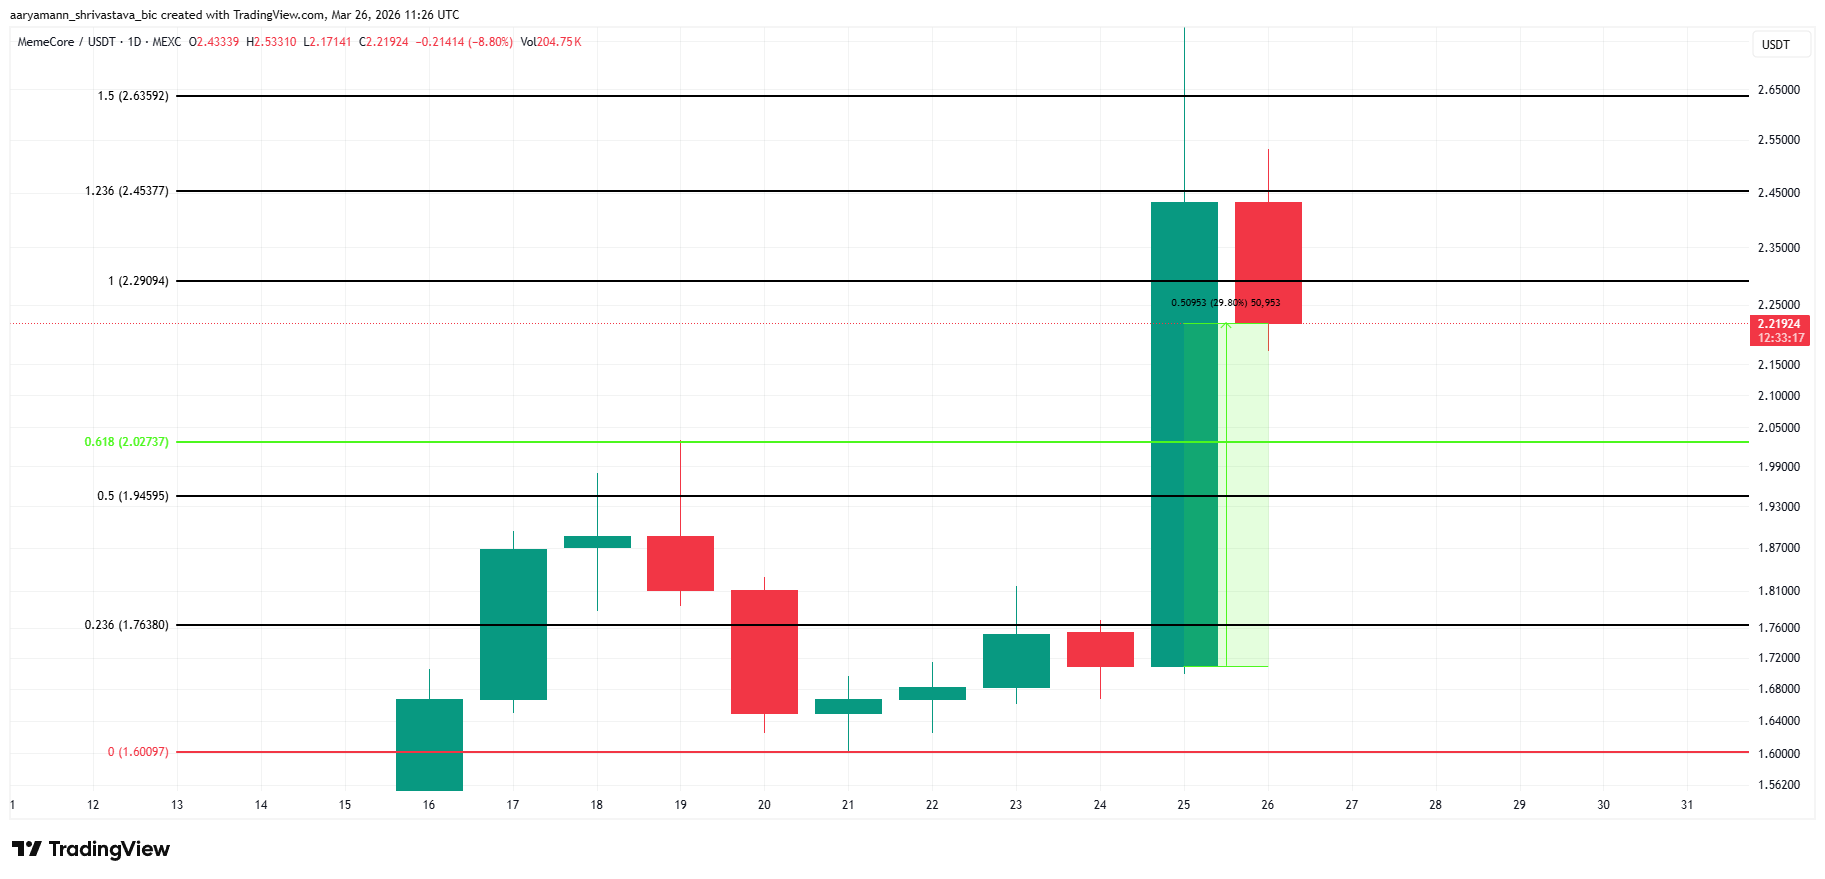
Given the bearish CMF divergence and the consistent post-liquidation reversal pattern visible across the full historical chart, the 0.618 level at $2.02 is the most likely near-term destination. Memecore price daily close below $2.02 would open the path to the 0.5 level at $1.94 and then the 0.236 level at $1.76. The Fibonacci zero at $1.60 remains the last visible floor.
The bullish invalidation requires a daily close above the 1.5 extension at $2.63. That level was briefly tested as a wick on March 25 but was not sustained as a close. Reclaiming it with a full daily candle body above $2.63 would break the historical reversal pattern. This would open the path toward new highs.
