


On Jan 29, the Matic Network (MATIC) price broke out above a descending resistance line and has been increasing since. At the time of writing, it is trading inside a significant resistance area.
MATIC Highlights
- MATIC is following an ascending support line.
- It has broken out from a descending resistance line.
- There is resistance at 255 satoshis.
- There is support at 220 satoshis.
- The price is trading above significant daily moving averages.
Well-known trader @devchart outlined a MATIC price chart that shows the price has broken out above and retested the 100-day moving average (MA) and gives a target of 279 satoshis. However, because of its prior rapid decrease, he is still wary of trading the coin.
https://twitter.com/devchart/status/1225110626705596422?s=19
MATIC Breaks Out
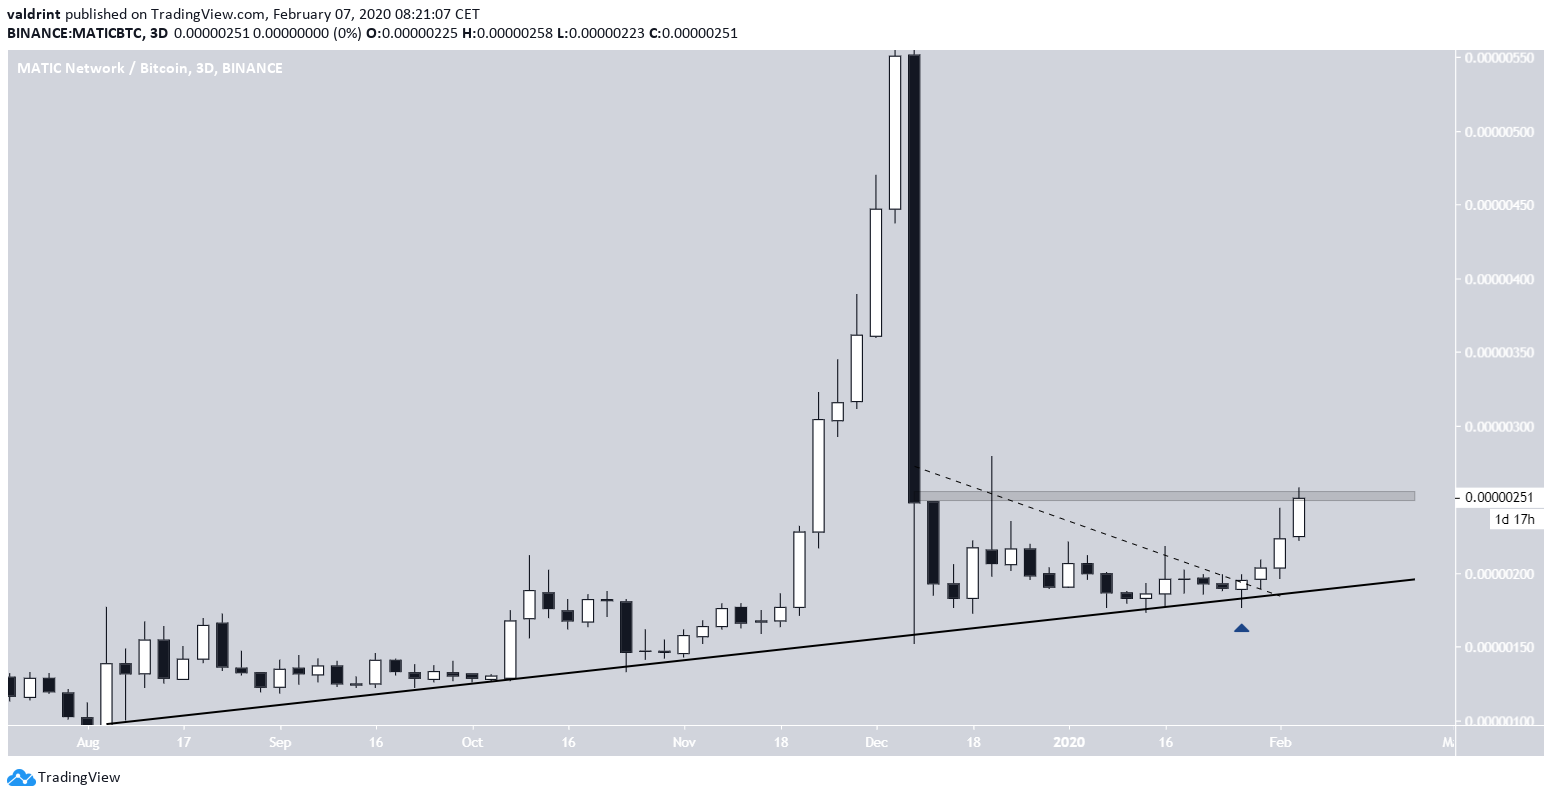
The MATIC price has been following an ascending support line since Aug 5, 2019.
After the steep pump and correction, the price generated a descending resistance line, out of which it broke out on Jan 29, 2020. Since then, the price has been increasing and has once again reached the 255 satoshi resistance area, where it was trading at the time of writing.
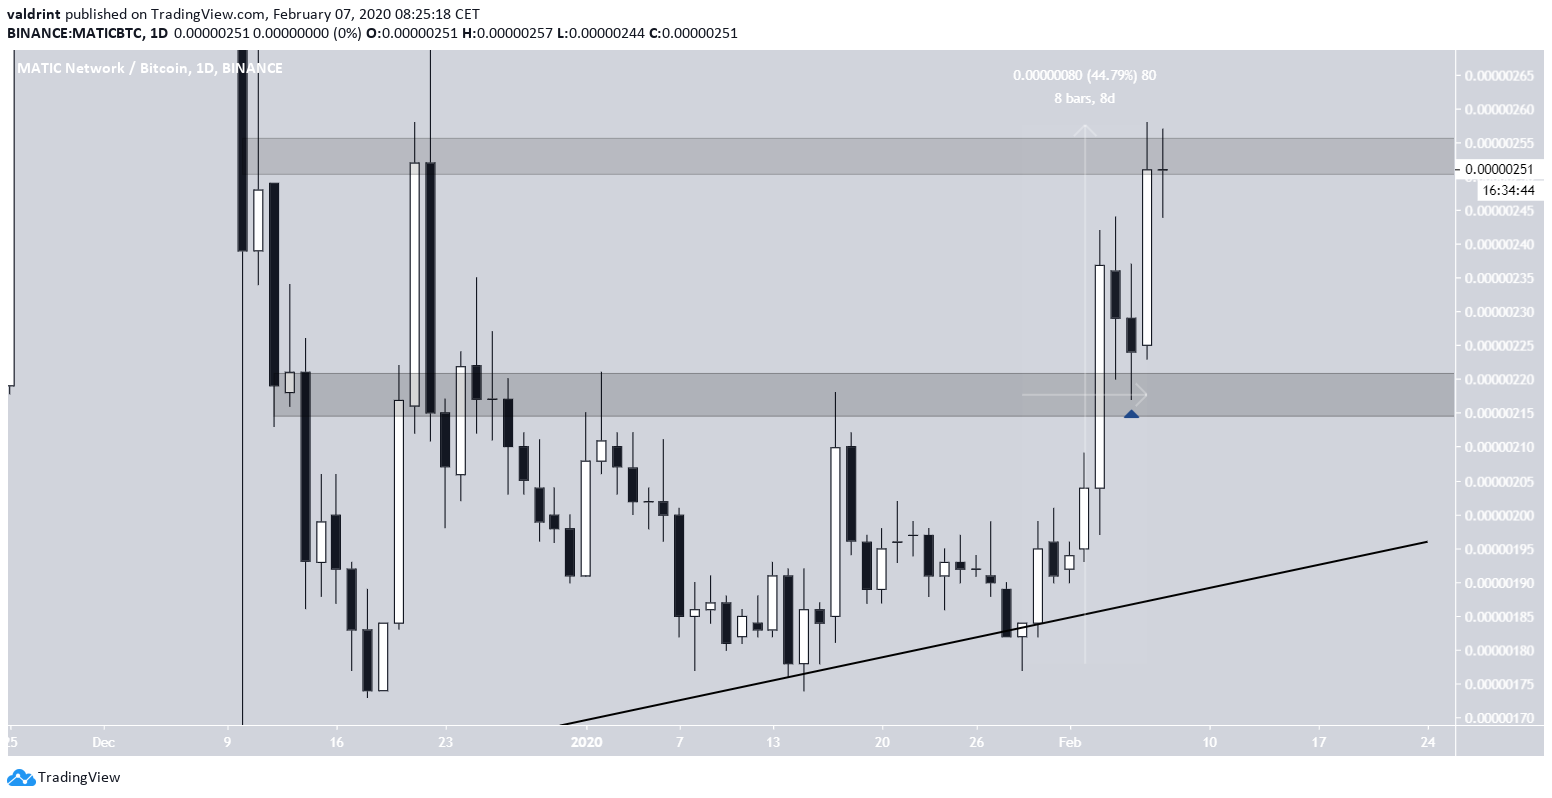
The upward move was rapid and the price increased by 45% in only eight days. In addition, MATIC has broken out above and successfully validated the previous 220 satoshi resistance area as support, which is expected to provide support in the near future.
Future Movement
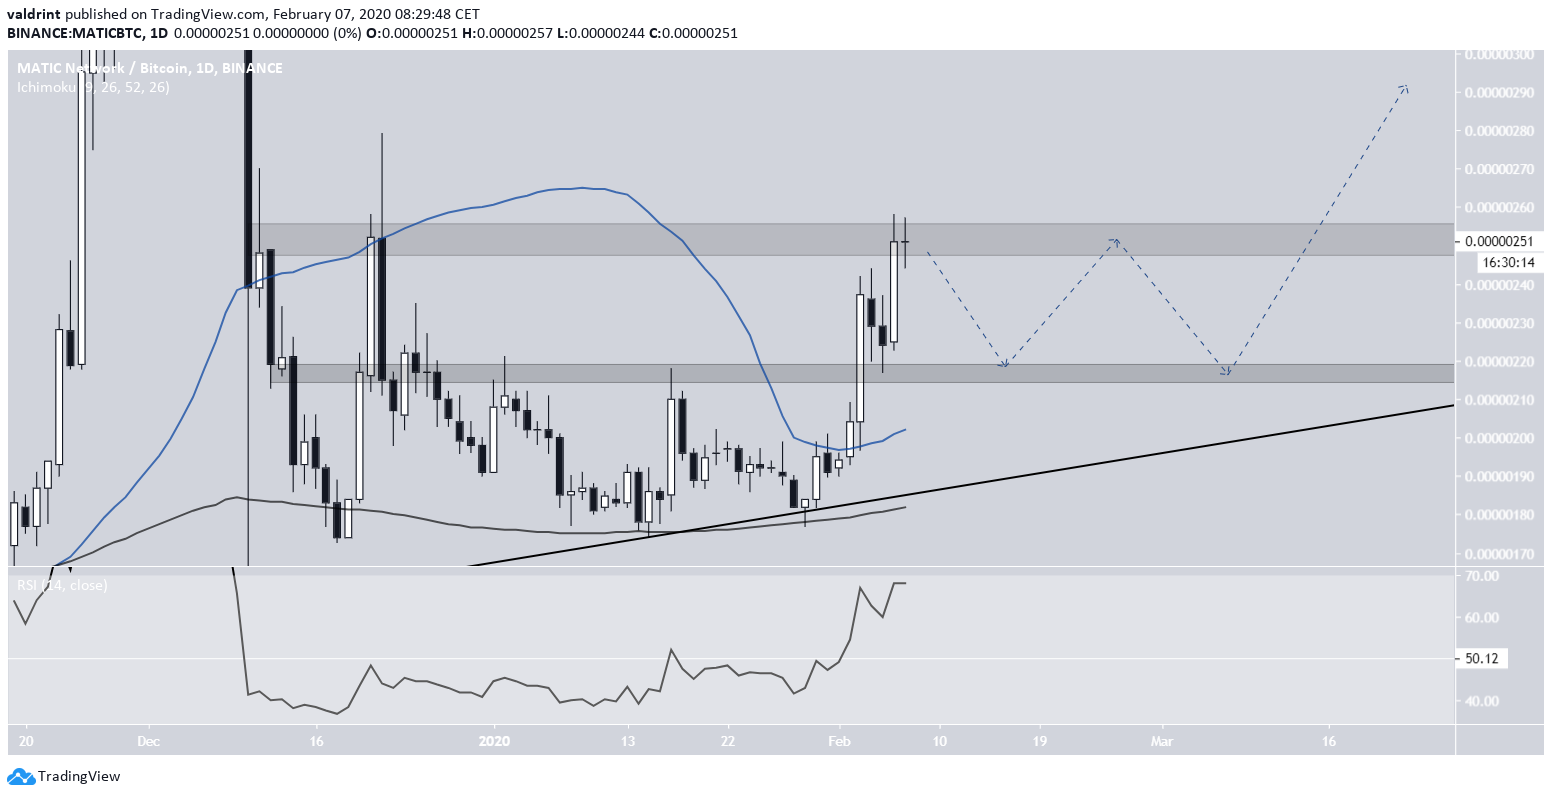
The recent increase caused the price to move above both the 50 and 200-day moving averages (MA) while the former has sharply turned upward and will possibly offer support to the price.
What’s more, the daily RSI is above 50 — a value it has not reached since the rapid price decrease on Dec 10. Both these signs suggest that the price will continue moving upwards, after possibly returning to validate the support area or 50-day MA.
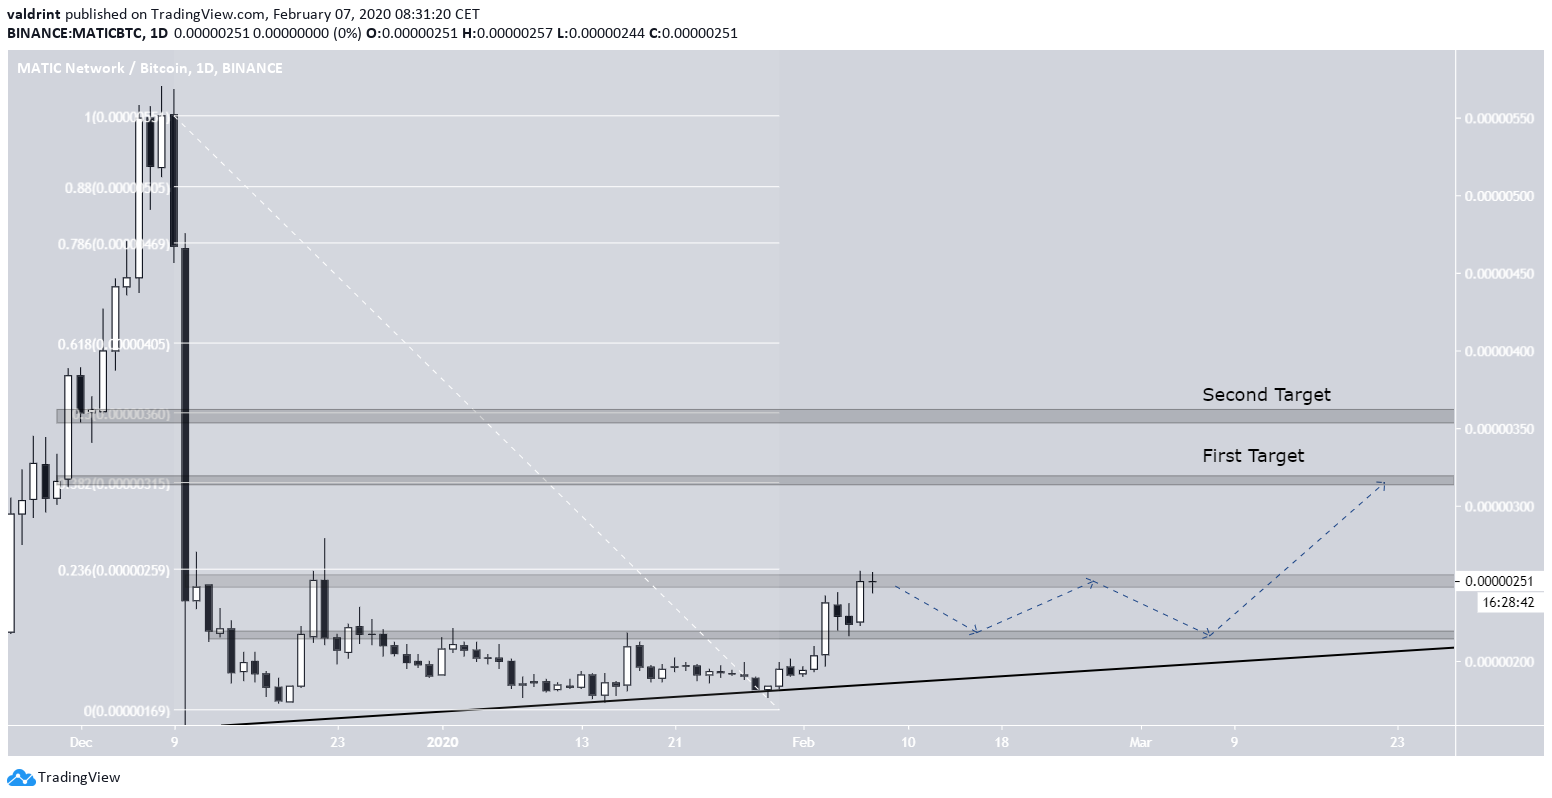
As for future movements, the targets after a breakout are found at 310 and 360 satoshis, the 0.382 and 0.5 fib levels of the previous decrease.
It appears that the current price movement is a retracement in response to resistance rather than the beginning of another upward move.
To conclude, the MATIC price has broken out above a descending resistance line and reached a significant resistance area. It will likely be successful in breaking out eventually and will move towards the two targets outlined above.


