


Polygon’s (MATIC) upward movement culminated on Oct 28 with an increase of 28% in a single day. While a short-term drop could occur, the token is likely to make a run at the all-time highs soon.
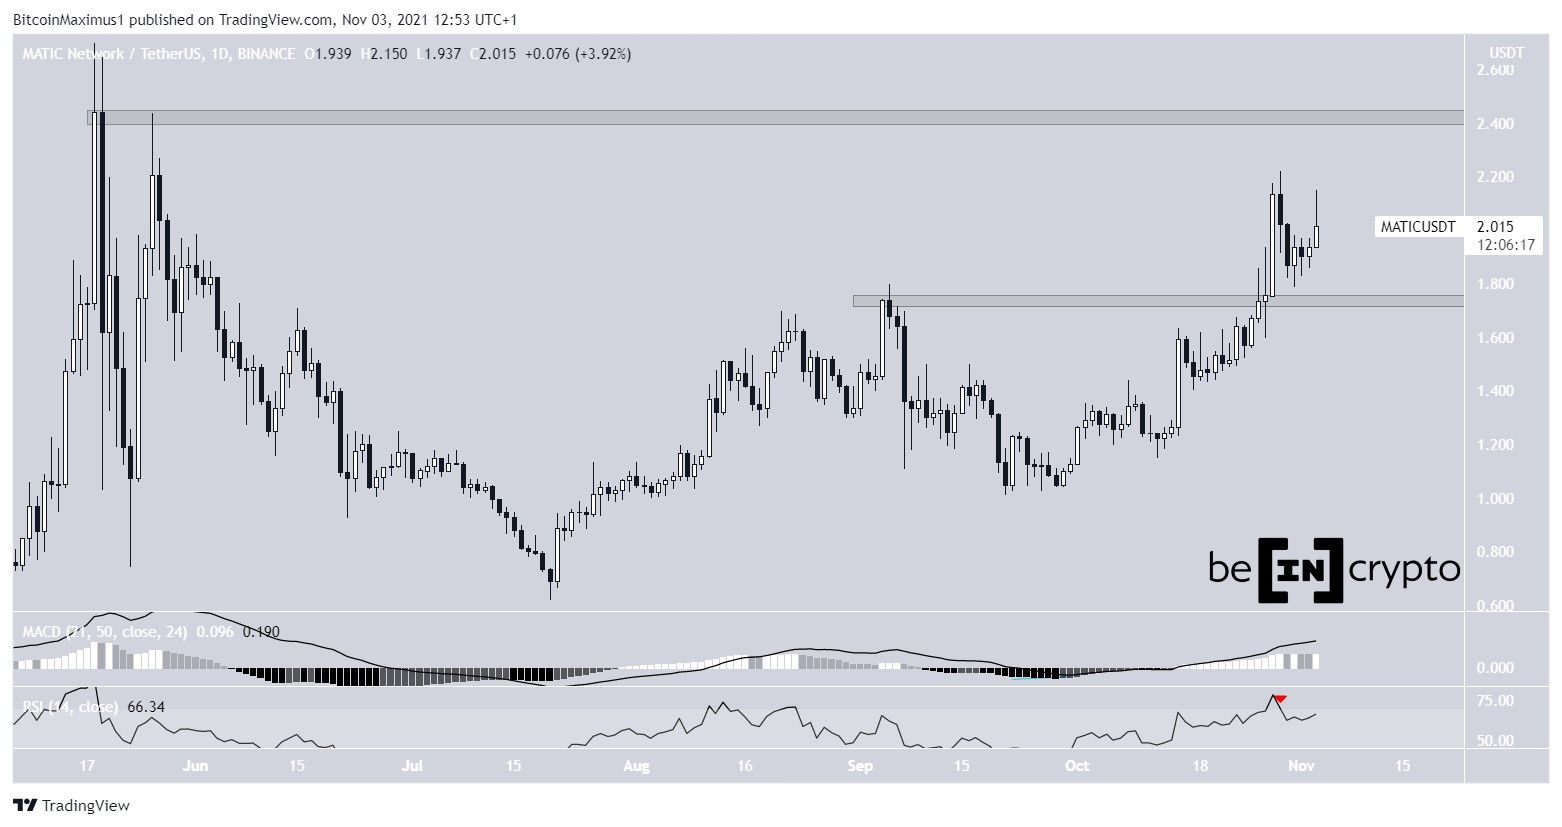
MATIC has been increasing since Sept 21. On Oct 27, it broke out above the $1.74 resistance area and increased significantly the next day.
The breakout was important since the token finally moved above its Sept highs after a decrease that had been ongoing since Sept 5. The next resistance area is at $2.42, close to the all-time high price.
Despite the breakout, technical indicators are still mixed. The MACD, which is created by a short- and a long-term moving average (MA), is still moving upwards. This means that the short-term trend is still faster than the long-term lone. However, the RSI, which is a momentum indicator, has fallen below 70 (red icon). This is a sign of decreasing momentum.
In addition to this, MATIC has not yet validated the $1.74 area as support. After breaking out, the price usually re-tests the breakout level prior to resuming its upward movement.
Therefore, it is possible that MATIC will do so prior to initiating another upward movement.
Future movement
Cryptocurrency trader @Altcoinsherpa tweeted a MATIC chart, stating that the token will soon break out from the $1.70 resistance area.
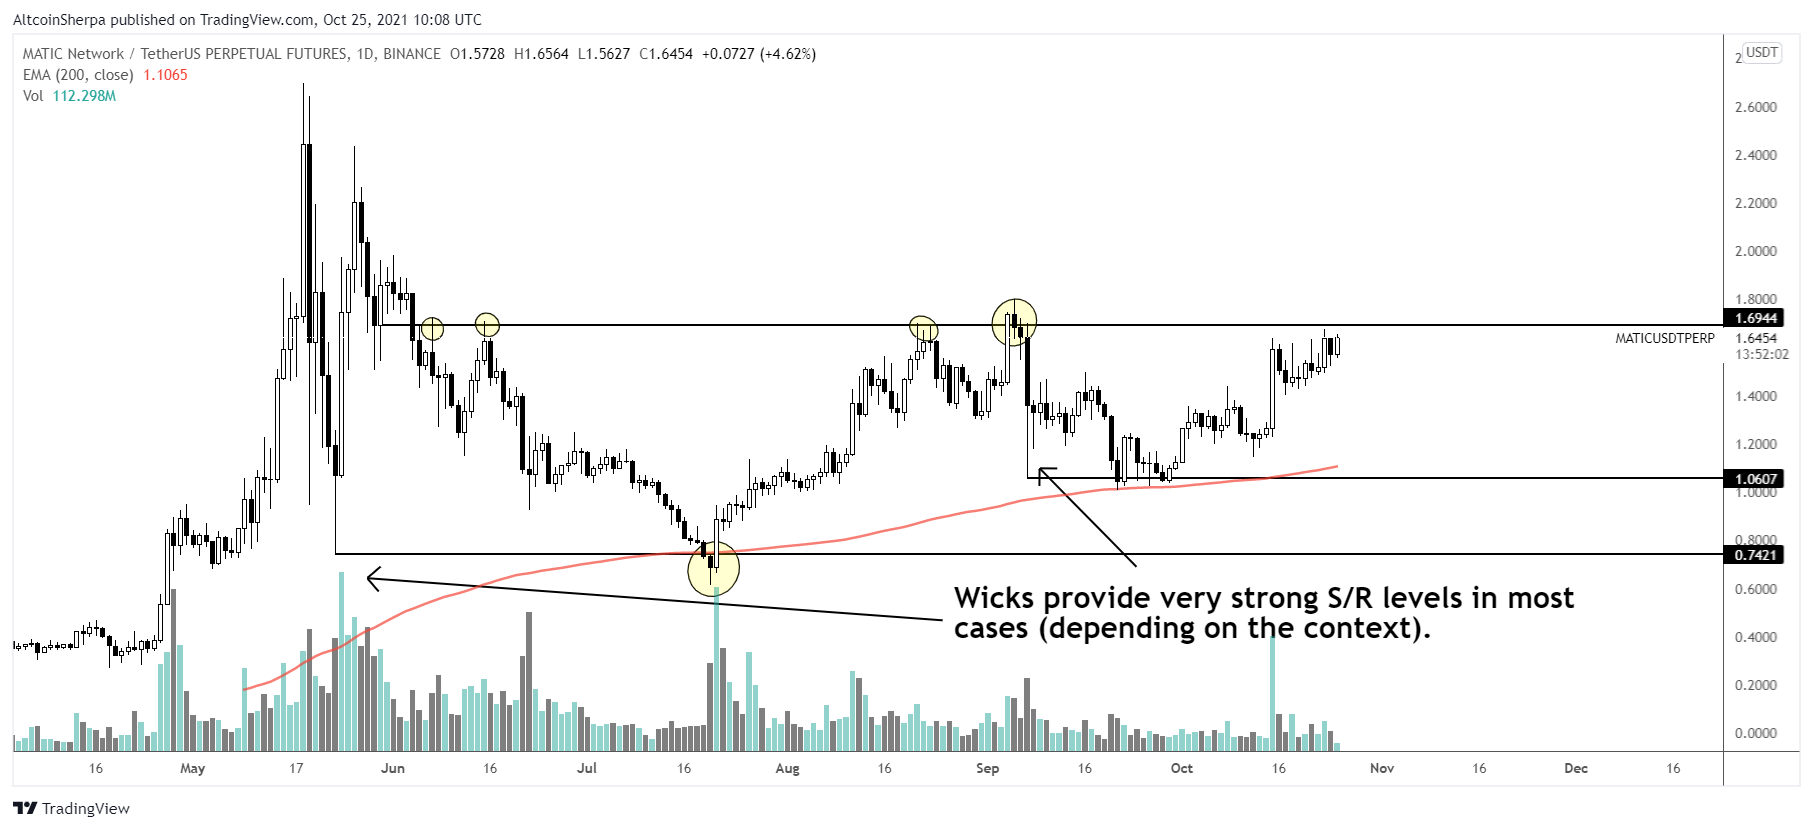
Since the tweet, MATIC has broken out, as evidenced in the previous section.
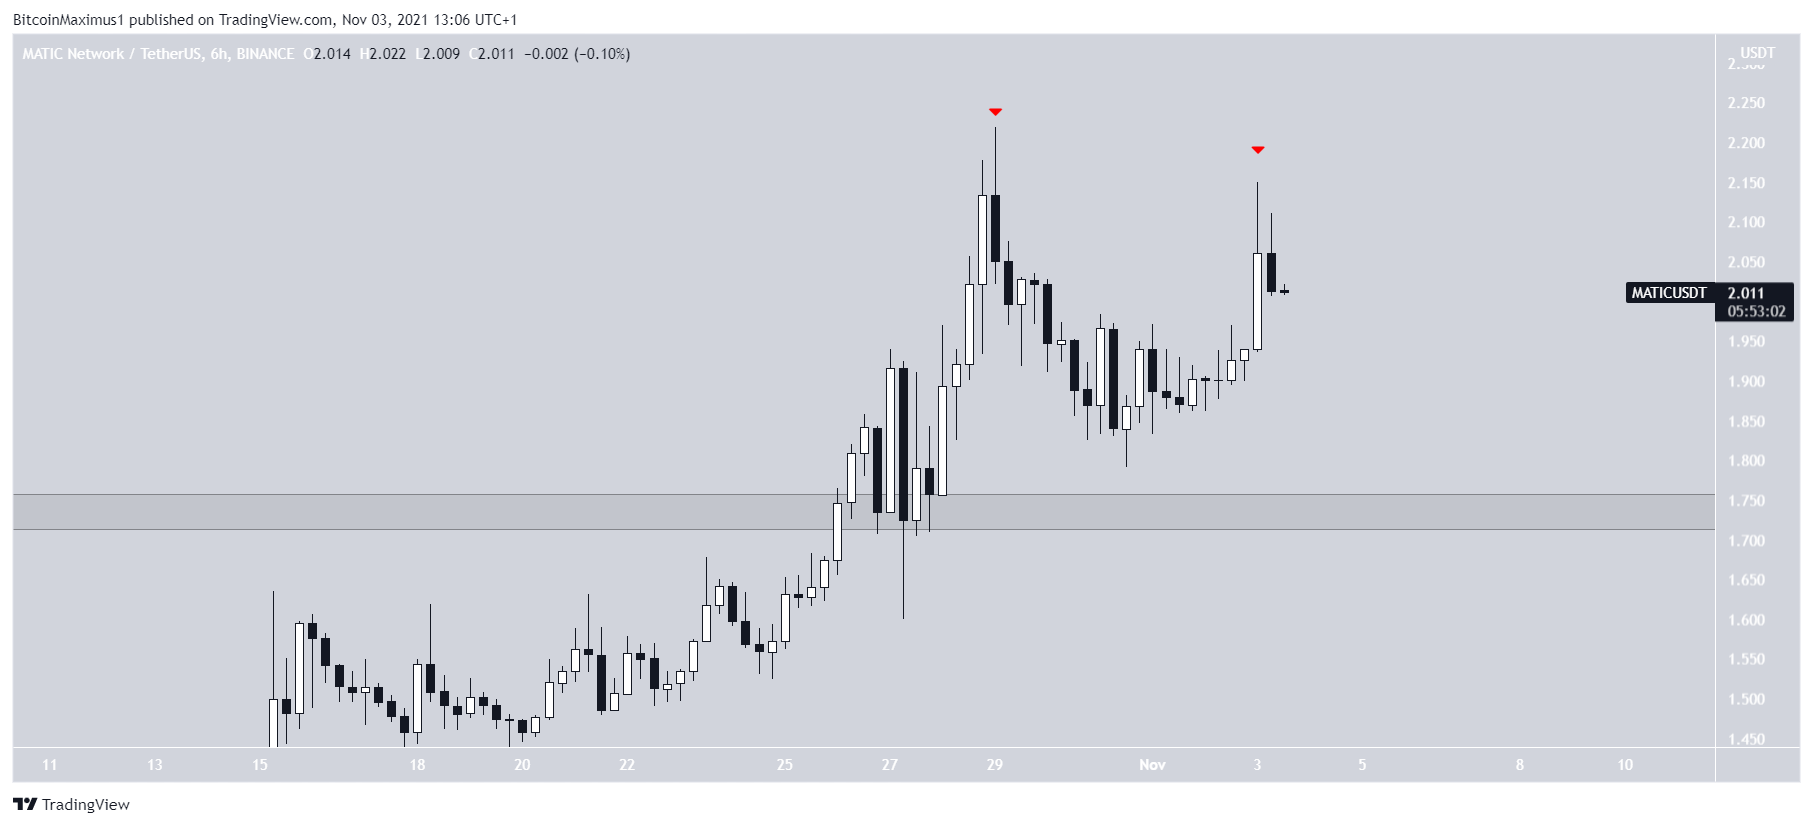
However, it has created a lower high in the short-term (red icon). This is a bearish sign, since it shows that the second attempt at initiating an upward movement was weaker than the first one.
Furthermore, the presence of long upper wicks is also a sign of selling pressure.
Therefore, it is possible that MATIC will drop to the $1.74 area once more prior to resuming its upward movement.
MATIC/BTC
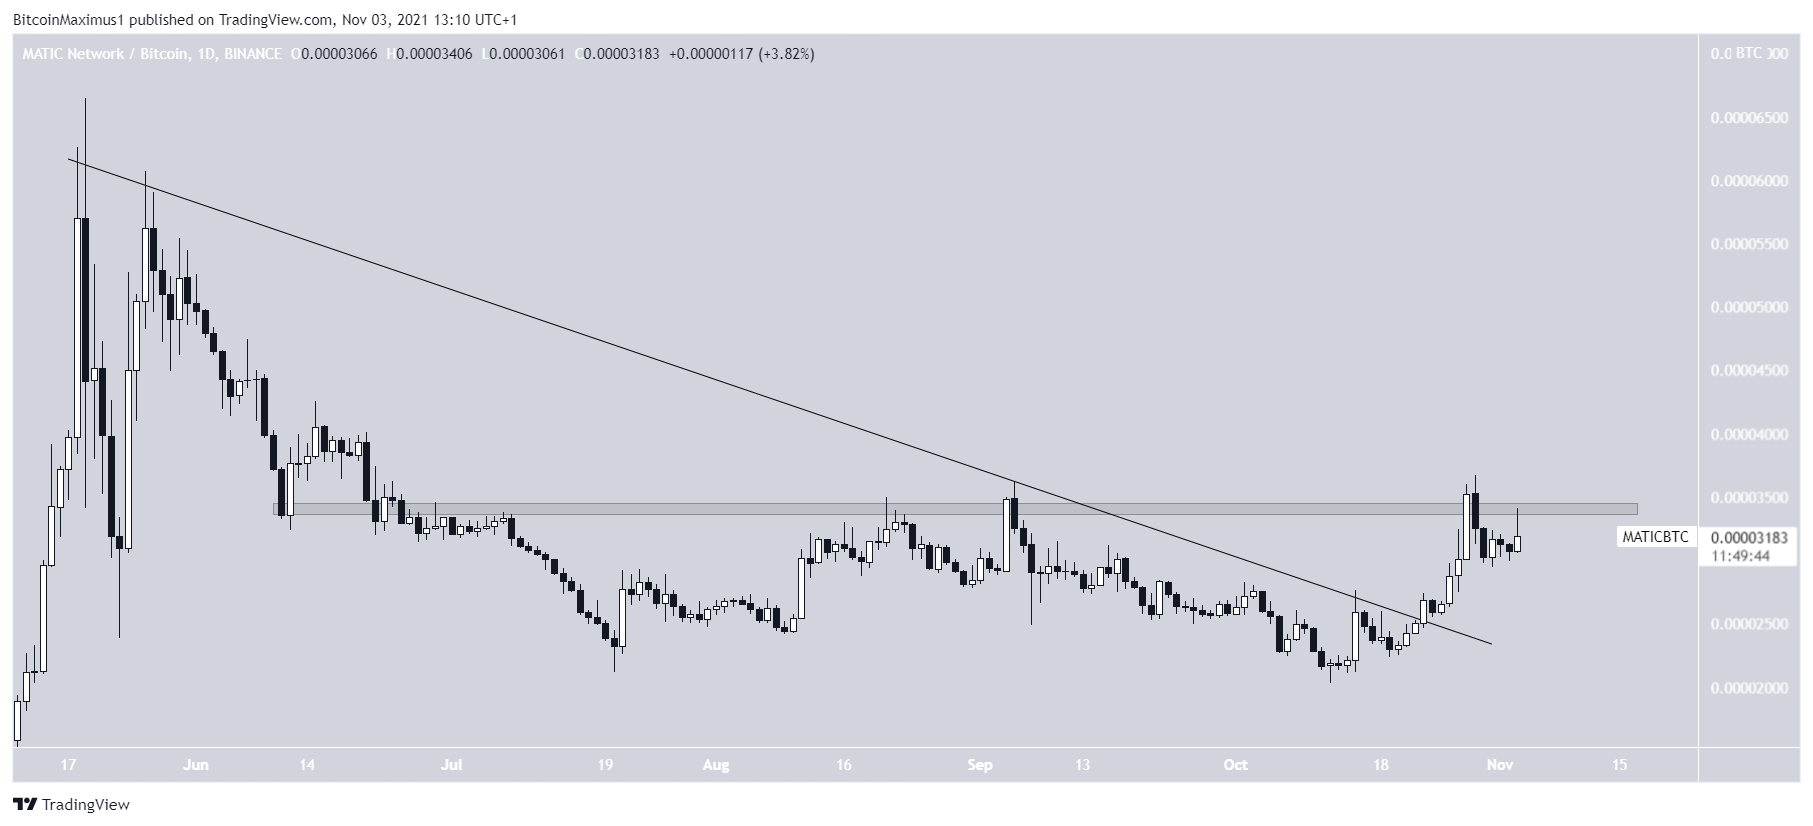
The MATIC/BTC pair is not as bullish as its USD counterpart. Since the token is facing resistance at 3,450 satoshis.
However, it has also broken out from a descending resistance line in place since the May all-time high. This is a sign that the long-term correction is complete, despite the resistance from the 3,450 satoshi area.
Therefore, while a short-term decrease could occur, the most likely scenario would have MATIC/BTC eventually breaking out from the 3,450 satoshi area.
This would also align with the MATIC/USD movement, in which a short-term decrease could also transpire.
For BeInCrypto’s latest Bitcoin (BTC) analysis, click here.


