


In this article, BeInCrypto will take a look at the previous times, in which the weekly MACD gave a bearish reversal signal, and analyze the effect it had on the bitcoin (BTC) price movement afterwards.
A bearish MACD reversal signal is created by consecutive lower momentum bars and a bearish weekly close.
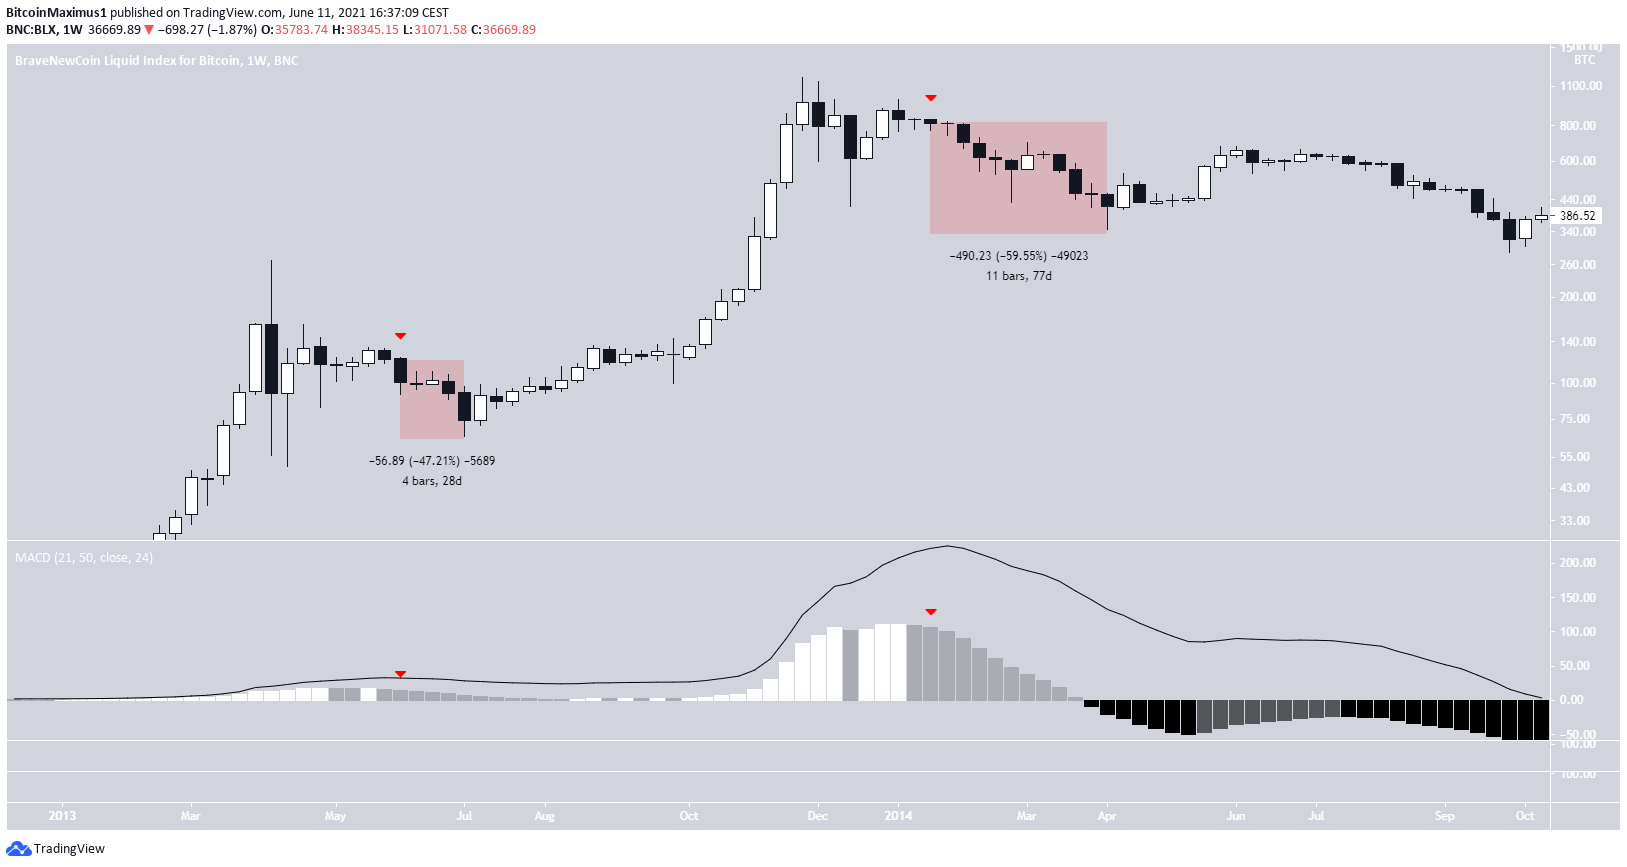
BTC in 2013
The first two such occurrences transpired in 2013 (red icons).
The first one was in June 2013. It led to a 47% decrease in 28 days, after which the price began to increase, eventually reaching a new high. Interestingly, the MACD did not cross into negative territory.
The second bearish reversal signal occurred in January 2014. The price decreased by 59.55% in 77 days, and began to move upwards afterwards.
The bounce transpired right after the MACD crossed into negative territory. However, the bounce was short-lived and new lows were reached afterwards.
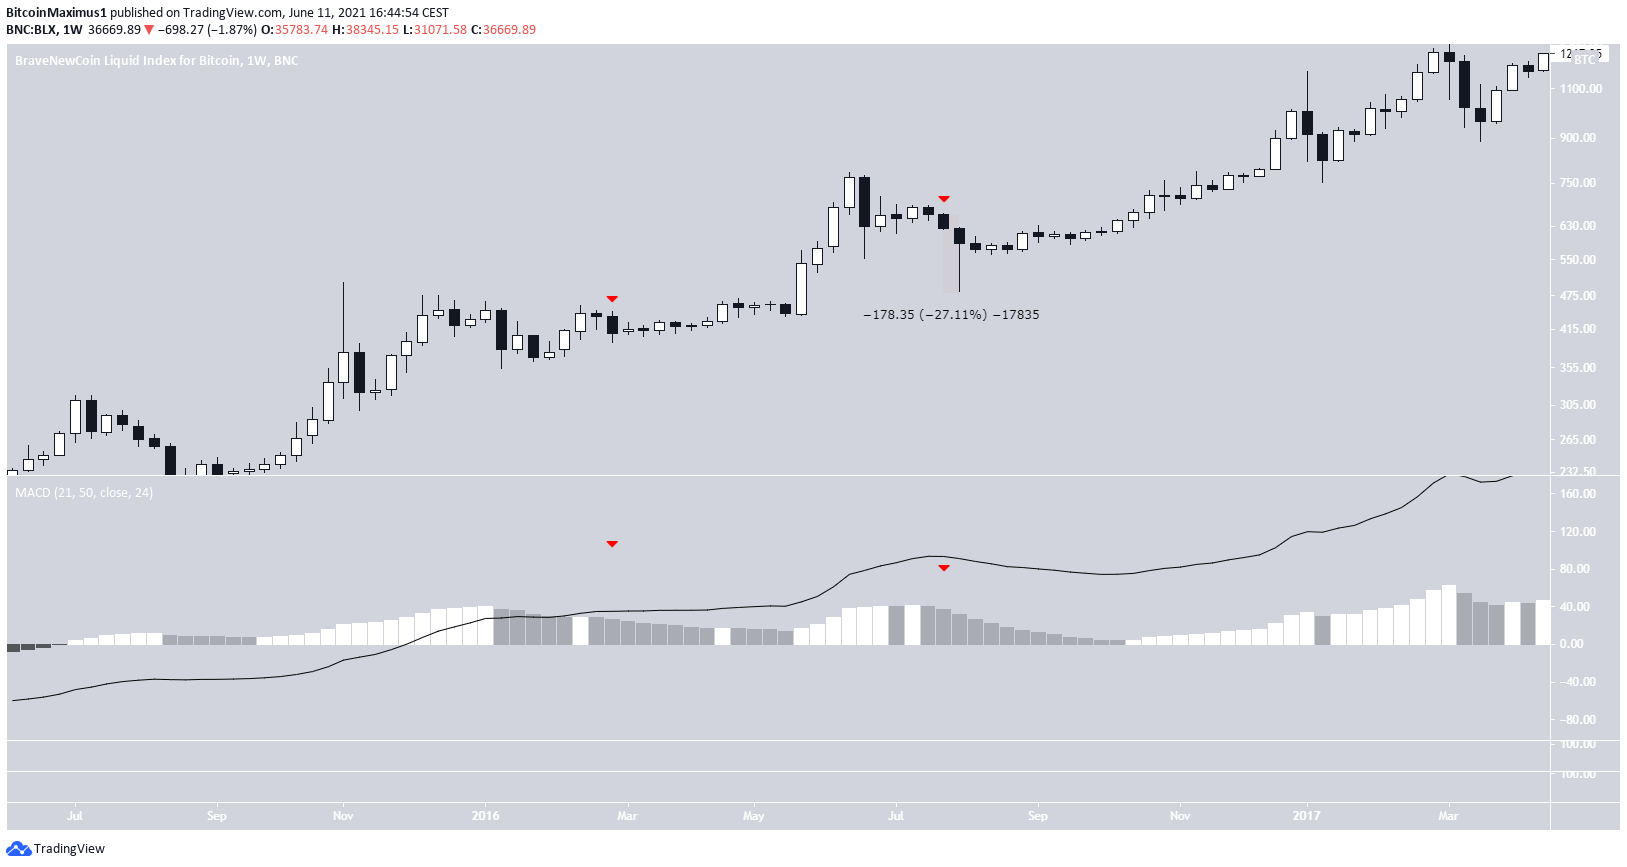
2016 reversal signals
Another bearish reversal signal was seen in February 2016. Despite this, BTC moved upwards immediately afterwards and reached new highs. This was the first case of a false signal, in which the reversal had no bearish effects on the price whatsoever.
Afterwards, there was a bearish reversal signal in July 2016. BTC decreased by 27.11% in 13 days, but created a long lower wick and moved upwards, following it. The MACD did not cross into negative territory that time either.
Therefore, the 2013 and 2016 movements have the same pattern, in which corrections last for a shorter period of time if the MACD does not cross into negative territory.
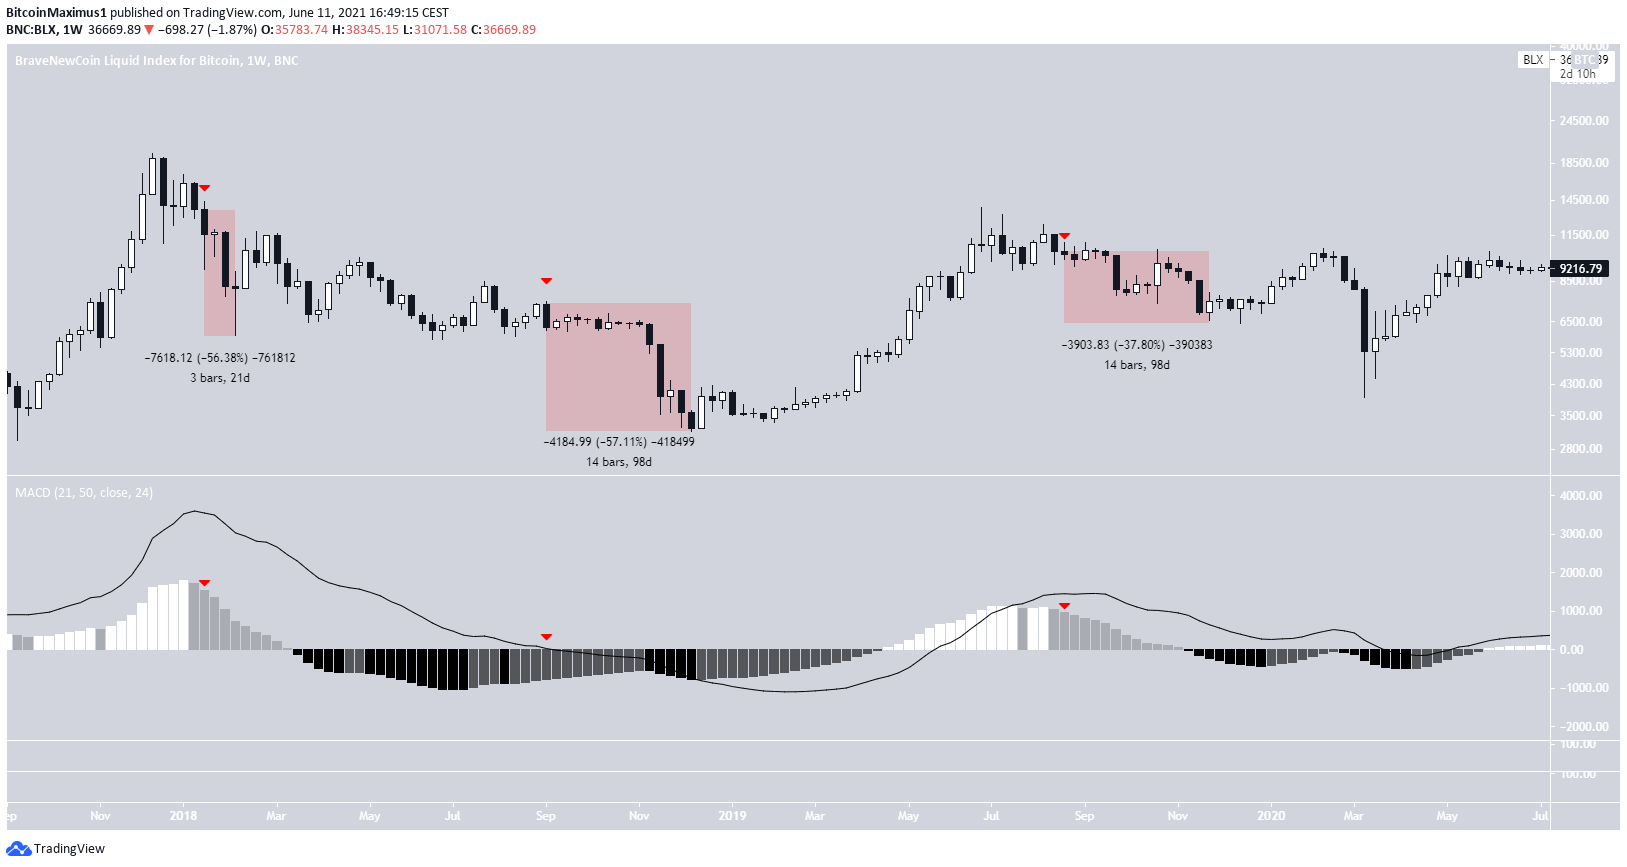
Another bearish reversal signal transpired in January 2018. What ensued was a decrease of 56.38% in 21 days, followed by a strong bounce. Nevertheless, the MACD crossed into negative territory afterwards, leading to a long corrective period. This fits with the previously outlined pattern.
On Sept. 3 of the same year, the signal line crossed negative, leading to a 98-day corrective period, in which BTC fell by 57%.
The final bearish reversal signal prior to the current one transpired in August 2019. It initiated a 98-days corrective period, in which BTC deceased by 37.80%.
It bounced considerably afterwards, before reaching another low. The MACD did cross into negative territory.
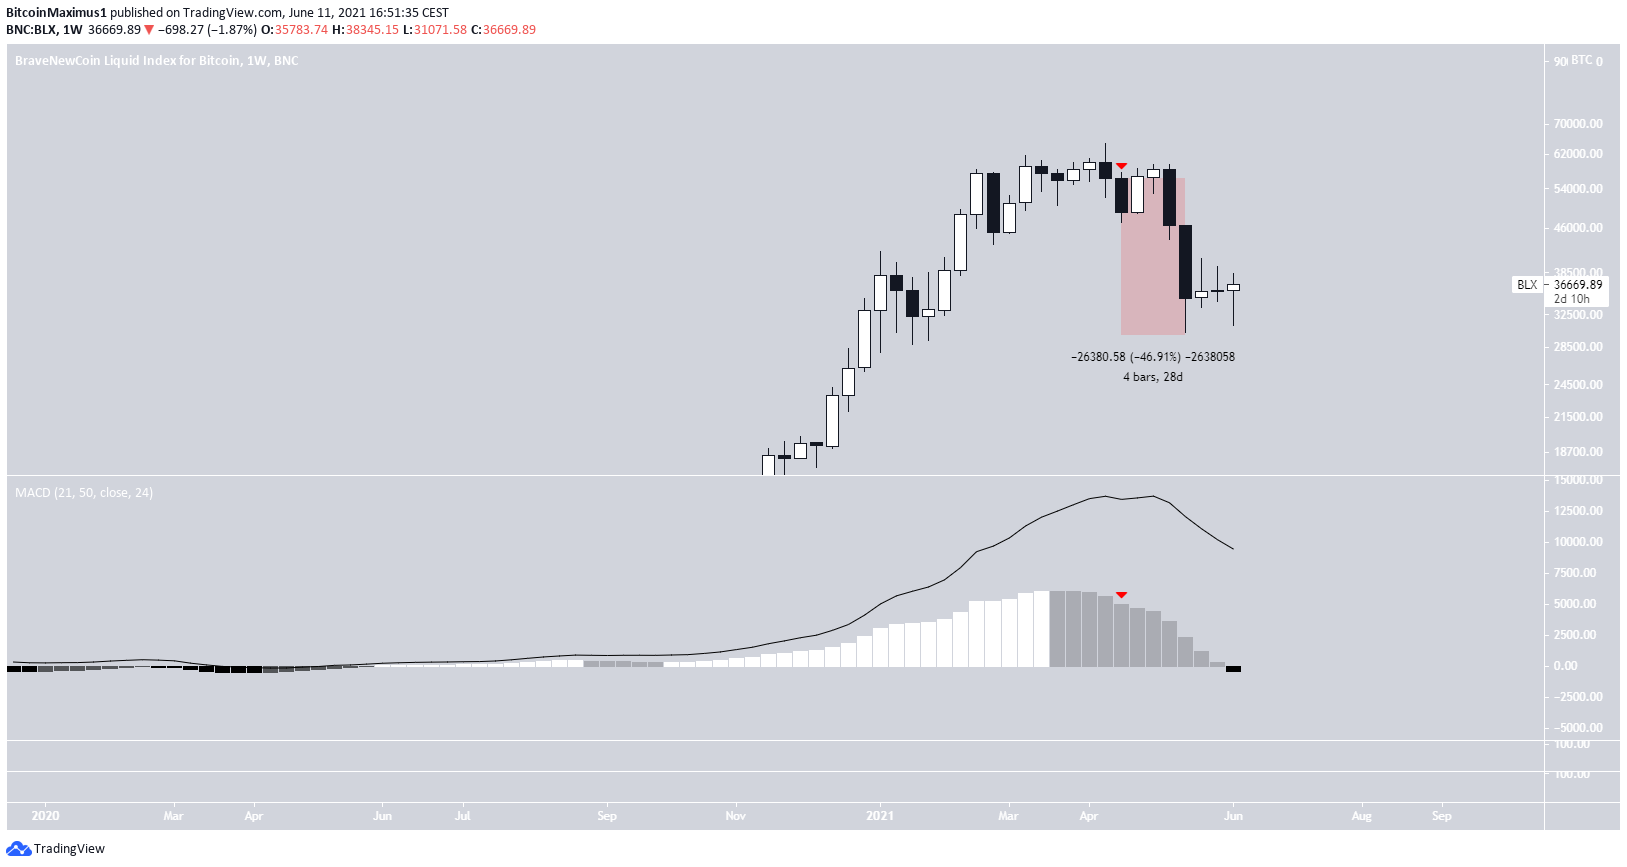
Current BTC movement
In April 2021, the MACD generated another bearish reversal signal. After two weeks of consolidation, BTC fell sharply, decreasing by 47% relative to the price on the day of the signal. The entire decrease took 28 days.
While the MACD has just crossed negative, the signal line is considerably above 0. MACD reversals have been catalysts for corrective period in the past, significant bounces occurred prior.
Even if BTC were to eventually reach a lower low, the price history suggests that a significant bounce would first be expected.
Therefore, judging solely by the weekly MACD movement, another low could eventually transpire due to the fact that the indicator has crossed into negative territory.
For BeInCrypto’s latest bitcoin (BTC) analysis, click here.


