


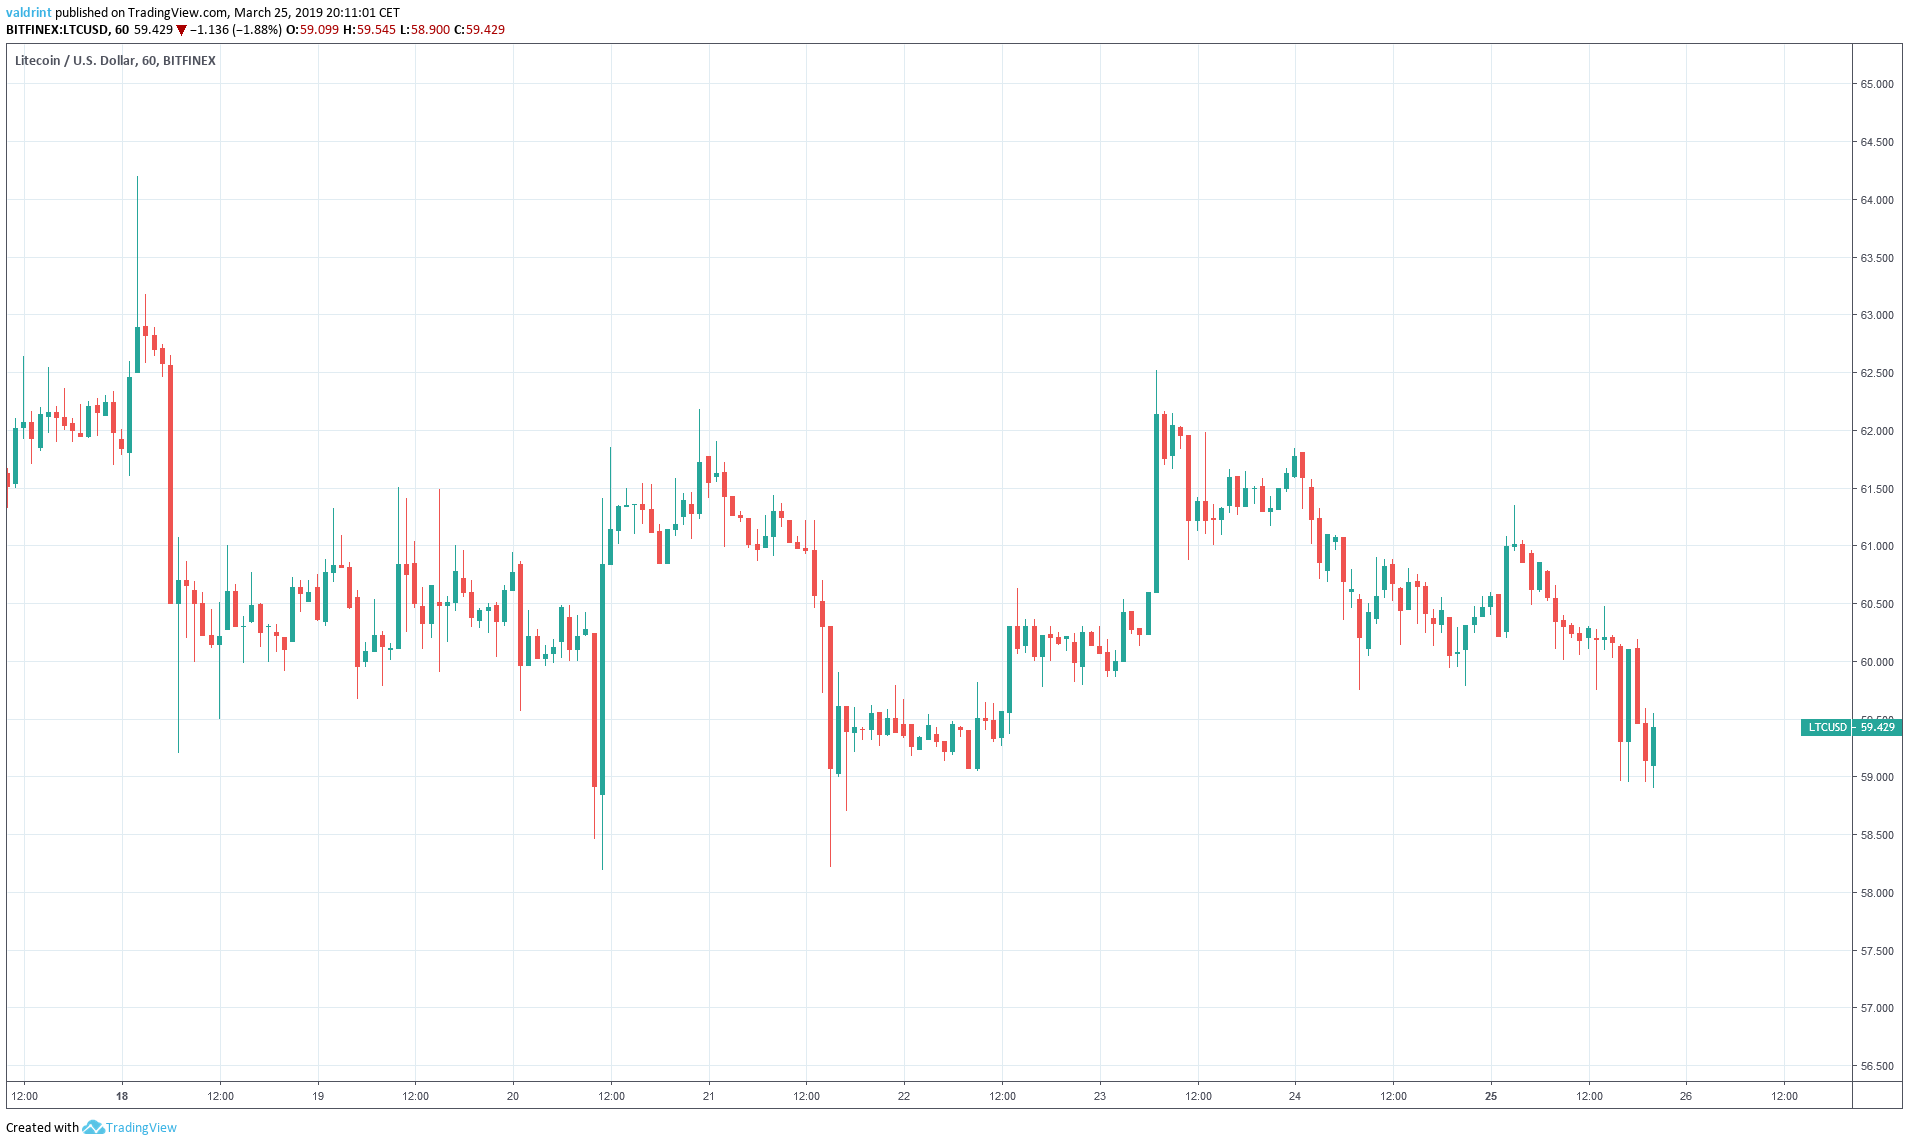
On Mar 18, 2019, the price of Litecoin (LTC) reached a high of $64. A downtrend has followed with lows near $58 reached on Mar 20 and 21. At the time of writing, LTC was still making bottoms below $59.
Throughout 2019, Litecoin has shown tremendous growth rising from a bottom of around $22 on Dec 7, 2018 to its current levels. In less than 4 months, Litecoin has nearly tripled in value.
Unfortunately, growth cannot continue forever, and we are forced to ask whether or not this might be the beginning of a reversal.
Should we expect further price losses for Litecoin? If so, how low might they get?
Based on today’s analysis, it is likely that the price will keep trading inside the descending channel we will define below.
Litecoin (LTC): Trends And Highlights For Mar 25.
- The price of Litecoin (LTC) has been on a downward trend since Mar 18.
- LTC has been trading inside a short-term descending channel.
- It recently broke down from an ascending wedge.
- The MACD and SMAs recently triggered a sell signal.
- There is resistance near $63.
- There are support areas near $59 and $54.
Tracing Resistance
The price of LTC on Bitfinex was analyzed at one-hour intervals from Mar 17 to Mar 25.
The price reached a high of $64.20 before a sharp drop. As prices rebounded along a downward trend, significant volatitlity was experienced.
Litecoin reached a lower high on Mar 23. Tracing the Mar 21 and 23 highs gives us a descending resistance line.
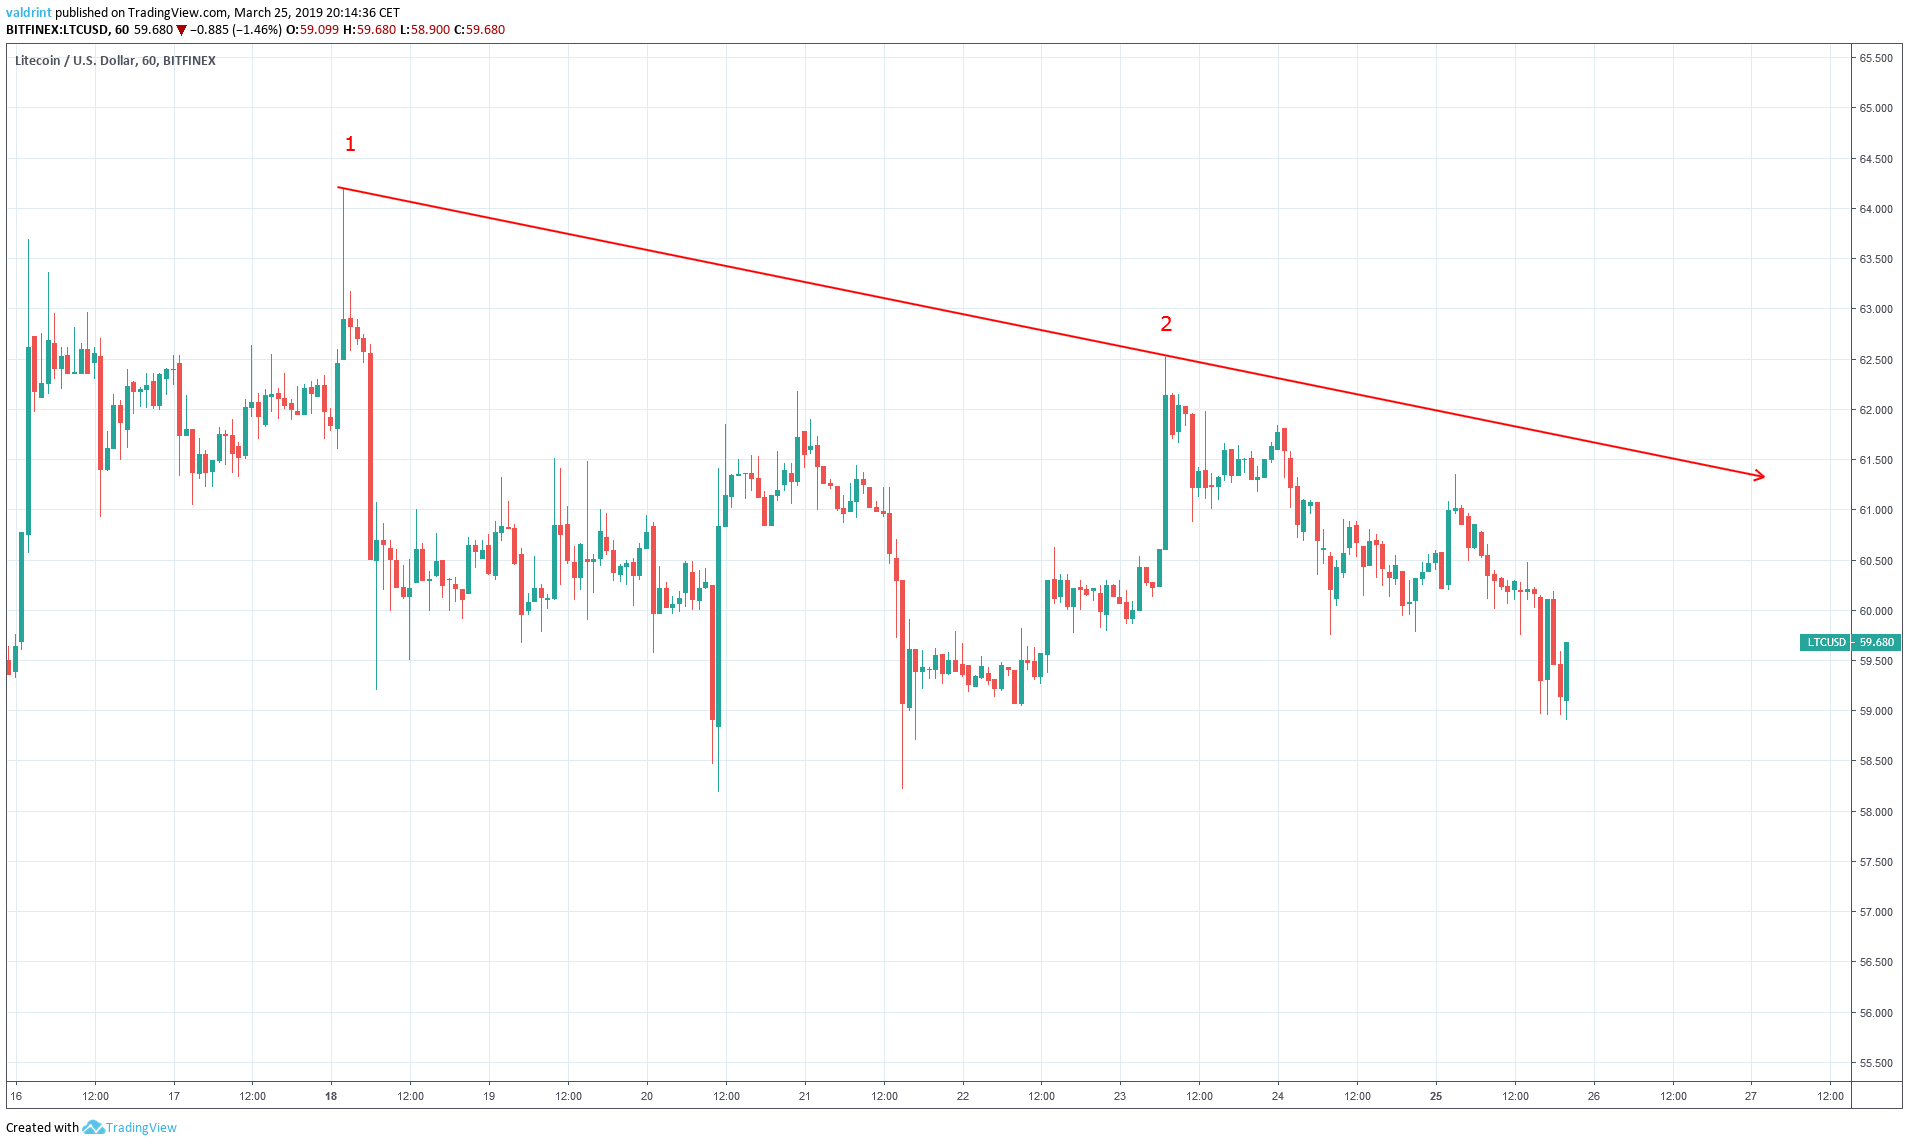
The resistance line acts as a ceiling to price, preventing further upward movement. It theoretically traces the upper limits of the price. It also measures the rate of decrease.
Litecoin has been trading at an apparently more rapid rate than that suggested by the line. Significant drops beneath resistance have been common since Mar 18 with prices in the upper $50s common.
It is likely that the price keeps decreasing at or above the rate suggested by the resistance line. It is also possible that another resistance line may develop. Given that the current line is traced by only two wick highs, it may not prove to hold long-term validity.
Descending Channel
The price reached a low of $59.2 on Mar 18. A gradual uptrend followed. However, the price has made two lower lows since. Tracing these lows gives us a descending support line.
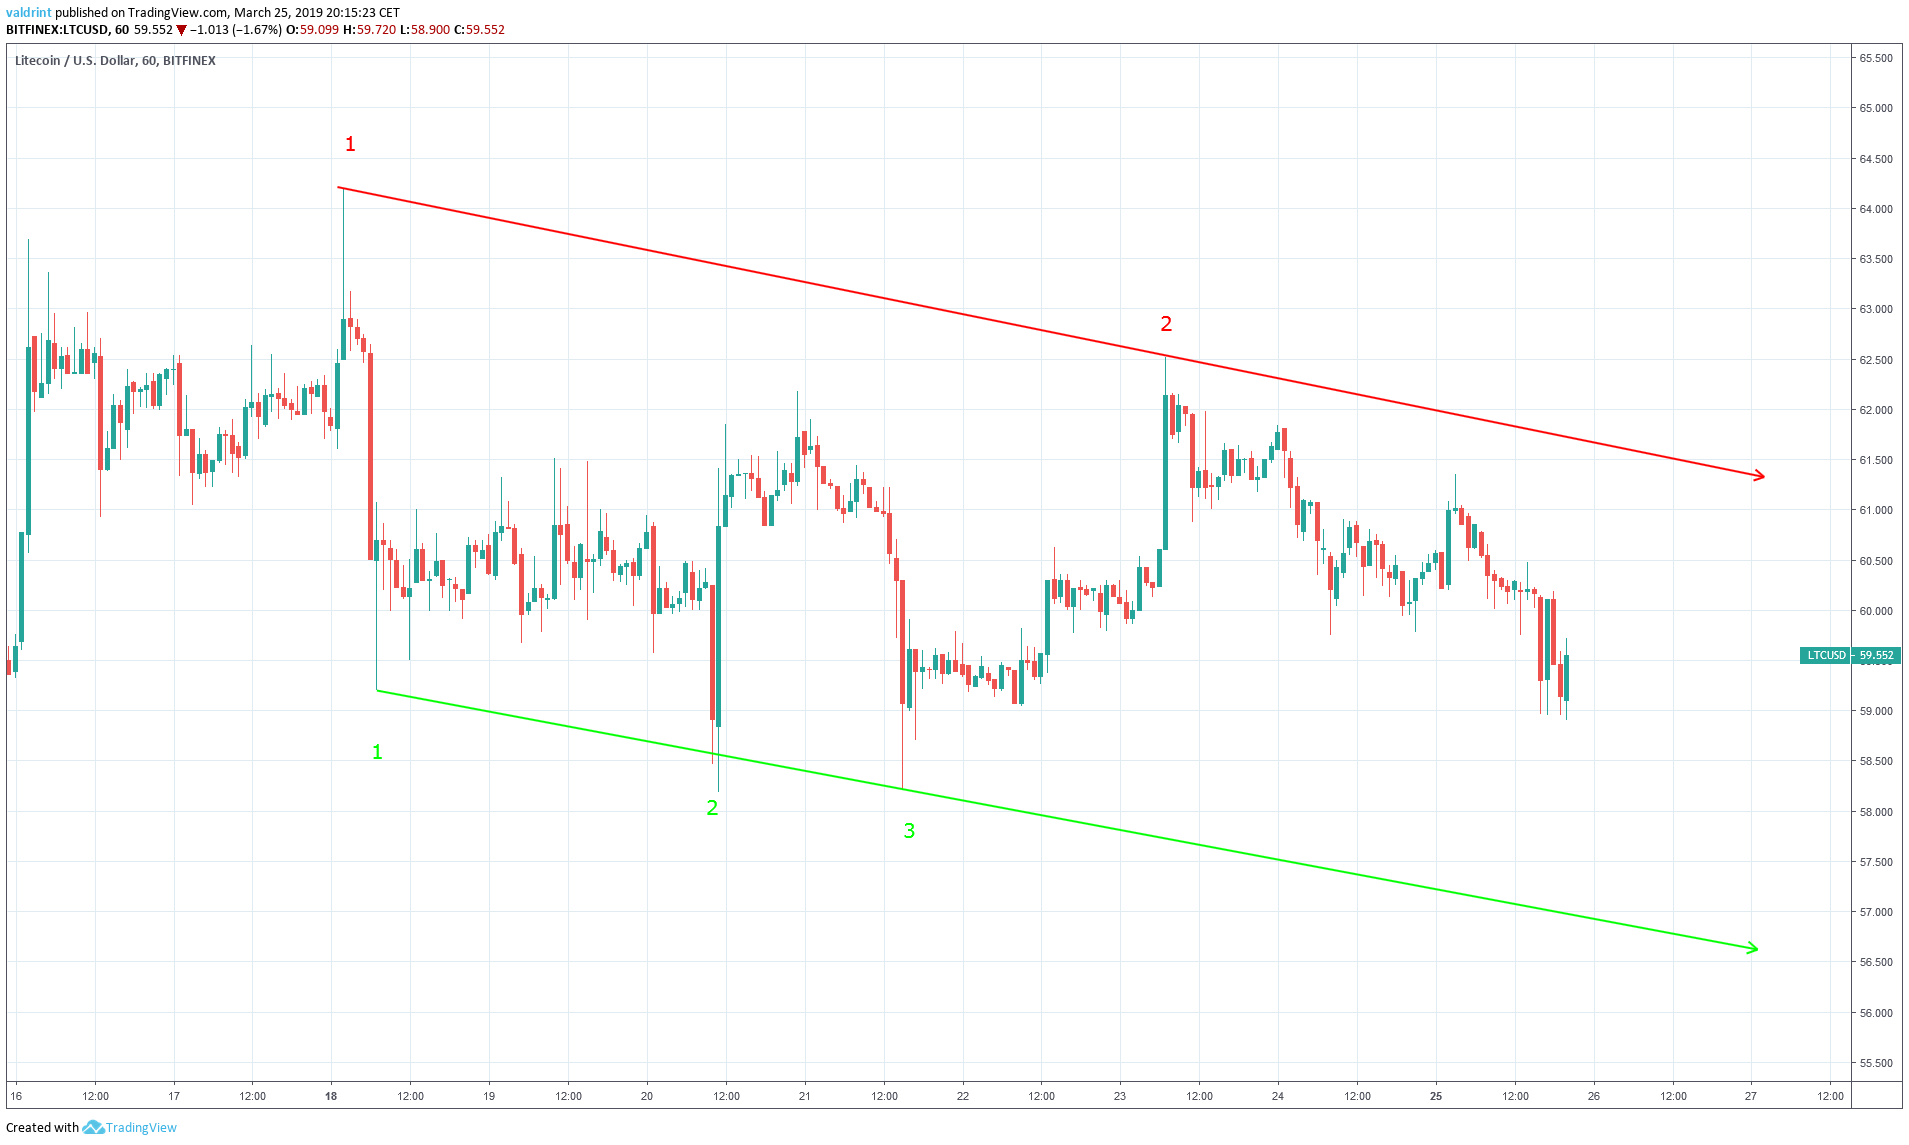
Similar to the resistance line, the support line can act as a floor to price, preventing further downward movement.
The support and resistance lines combine to create a descending channel. This is generally a neutral trading pattern with price increasing and decreasing between the resistance and support.
However, the downward angle of the line suggests that Litecoin’s price should gradually drop as highs and lows grow successively lower over time.
Litecoin’s price last touched the resistance on Mar 23. It has since been moving toward the support.
Based on the placement of the price within the channel, it is unlikely that a breakout above support or breakdown below resistance is imminent. However, to better assess these possibilities, we use several technical indicators.
Signal Triggered
The moving average convergence divergence (MACD) is a trend indicator that shows the relationship between two moving averages (long and short-term) and the price. It is used to measure the strength of a move.
Combined with simple moving averages (SMA), MACD can be used as a trigger for buy and sell signals. Signals are triggered whenever the MACD line is above 0 and the price is above the 10 (red) and 50-period (green) SMAs.
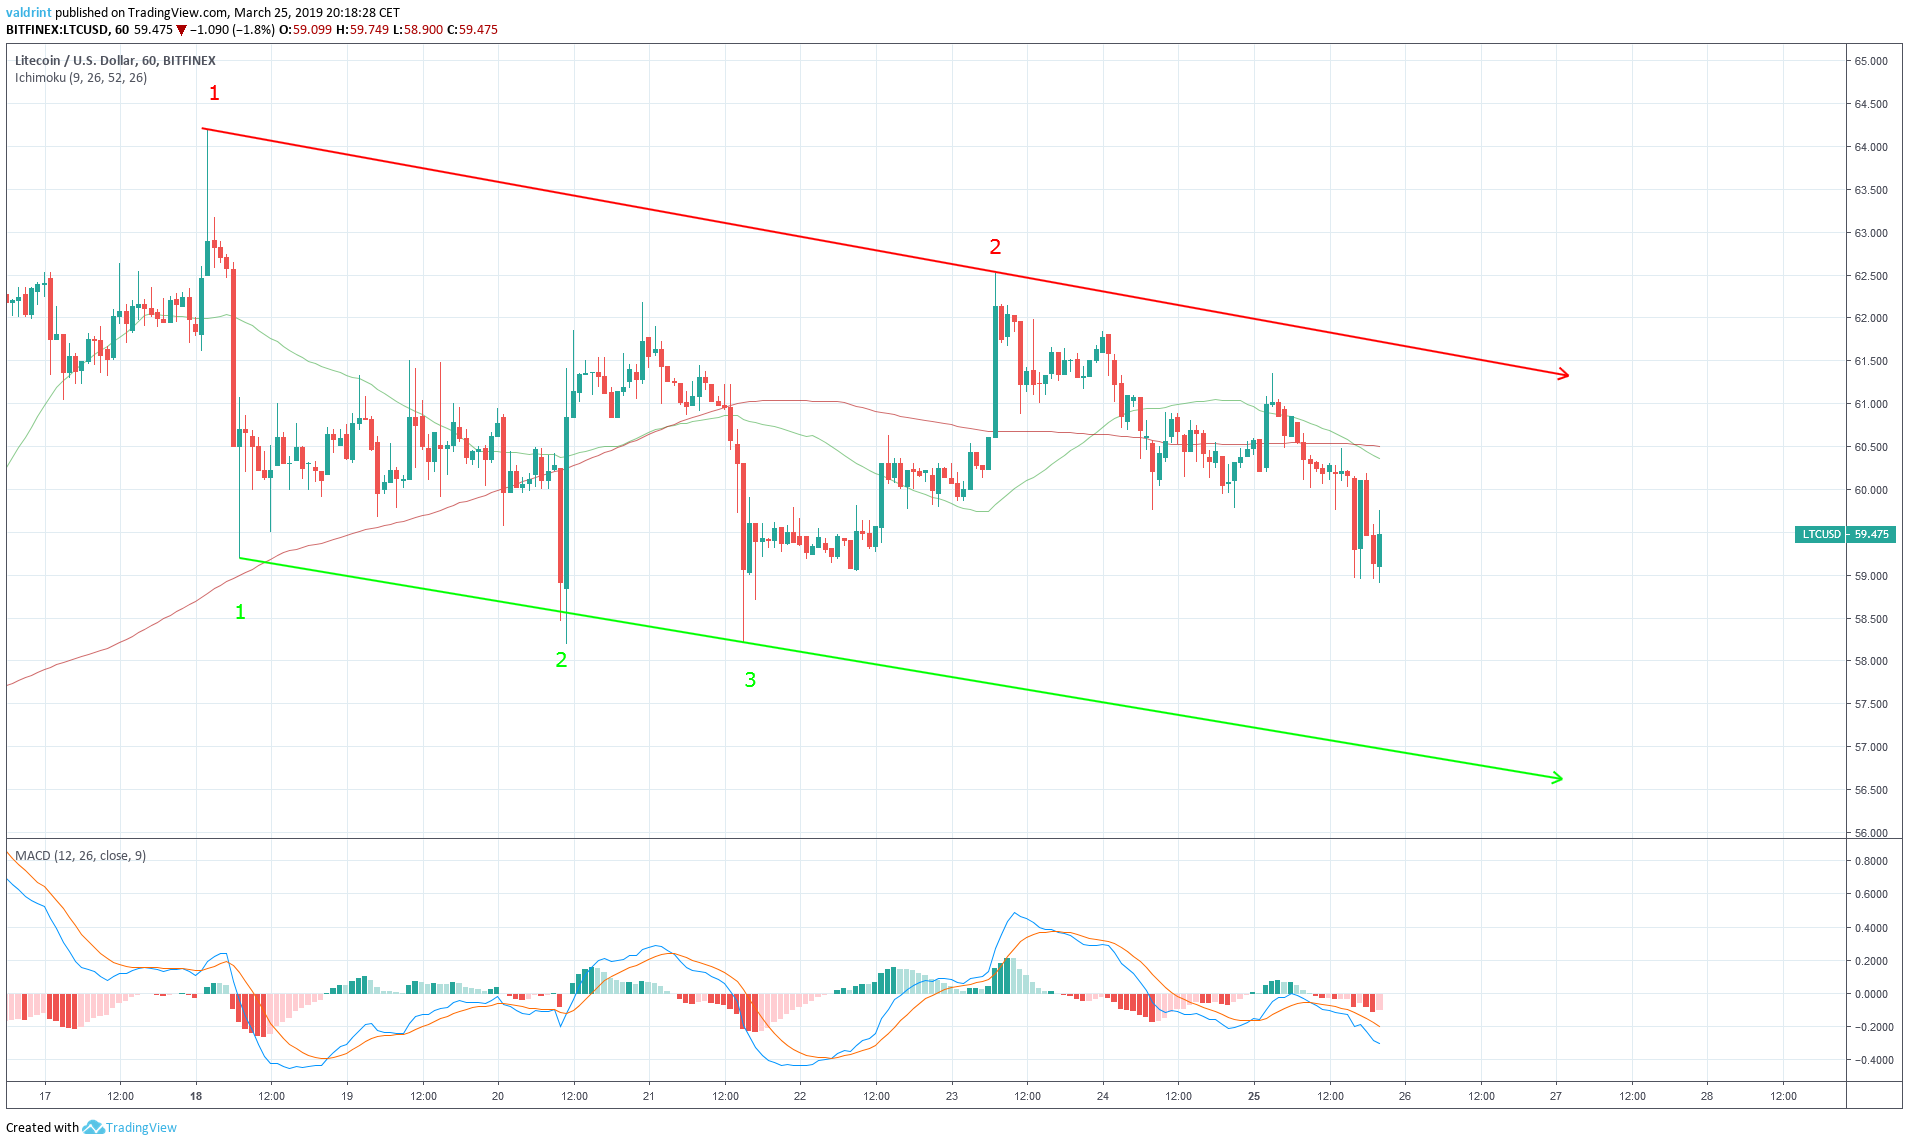
On Mar 25, the 10-period (red) SMA moved below the 50-period (green) one. On Mar 23, the same thing occurred in the MACD.
The combination of these movements indicates that our prediction for price losses may be accurate. It is uncertain when Litecoin will again reach the support line, but we do believe that it will be validated for the fourth time in the near future.
Previous Movement
The price of LTC on Bitfinex was analyzed at two-hour intervals from Mar 4 to Mar 25.
This is done in order to visualize the previous move and provide some context to the current one.
The price made a high of $59.30 on Mar 7. It has continued to create higher highs since. Tracing these highs gives us an ascending resistance line.
The price made a low of $45.70 on Mar 4. It has continued to create higher lows since.
Tracing these lows gives us an ascending support line.
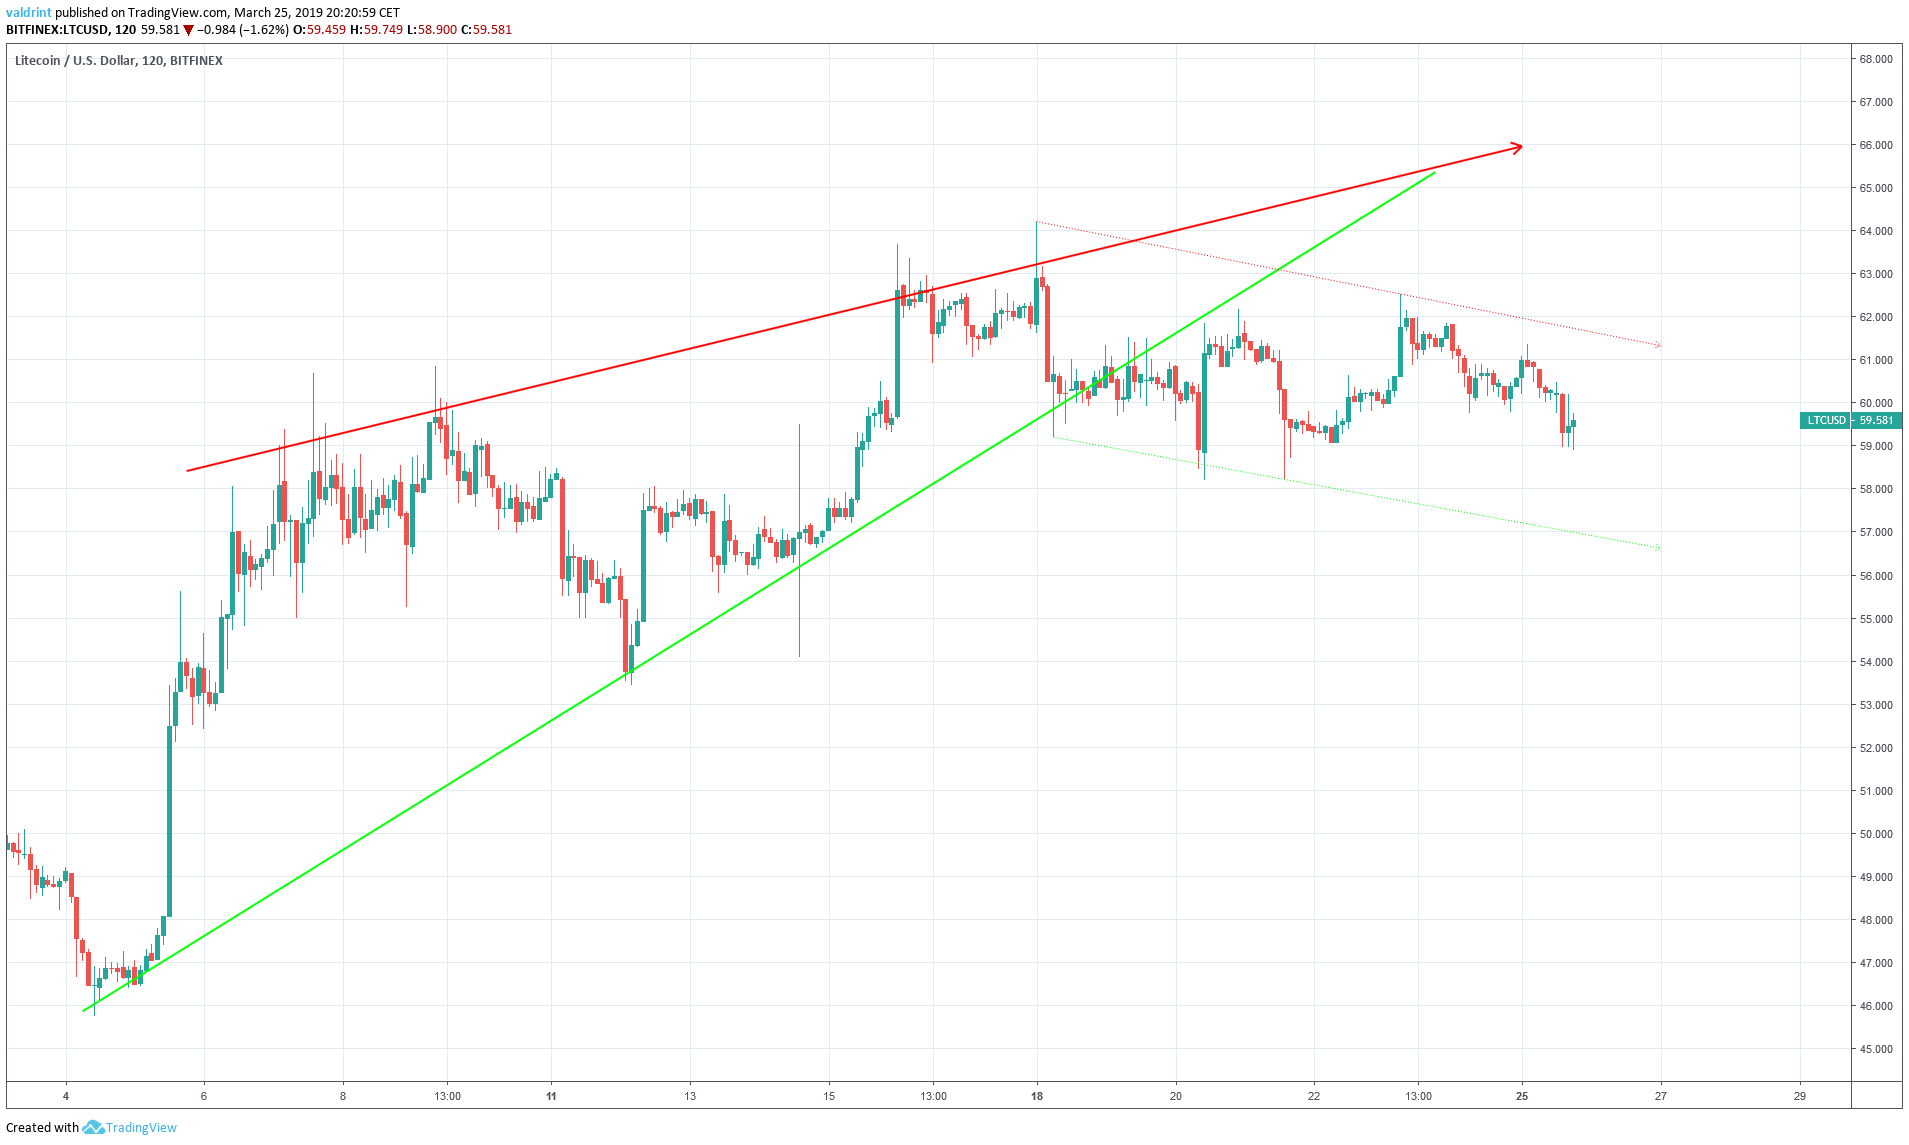
The support and resistance lines combine to create an ascending wedge, which is a bearish pattern.
A breakdown from the wedge occurred on Mar 19.
The beginning of the channel coincides with the end of the wedge.
Therefore, the current downward trend marks the continuation of price decreases following the breakdown from the ascending wedge on Mar 19. Based on this, price decreases may be part of a longer downward trend. This trend appears to be a response to significant price gains throughout March.
Future Movement
The price of LTC on Bitfinex was analyzed at two-hour intervals from Feb 19 to Mar 25 in order to better visualize potential reversal areas.
Resistance and support areas are formed when the price reaches a certain level several times. They can act as a ceiling/floor that prevents the price from moving further in that direction.
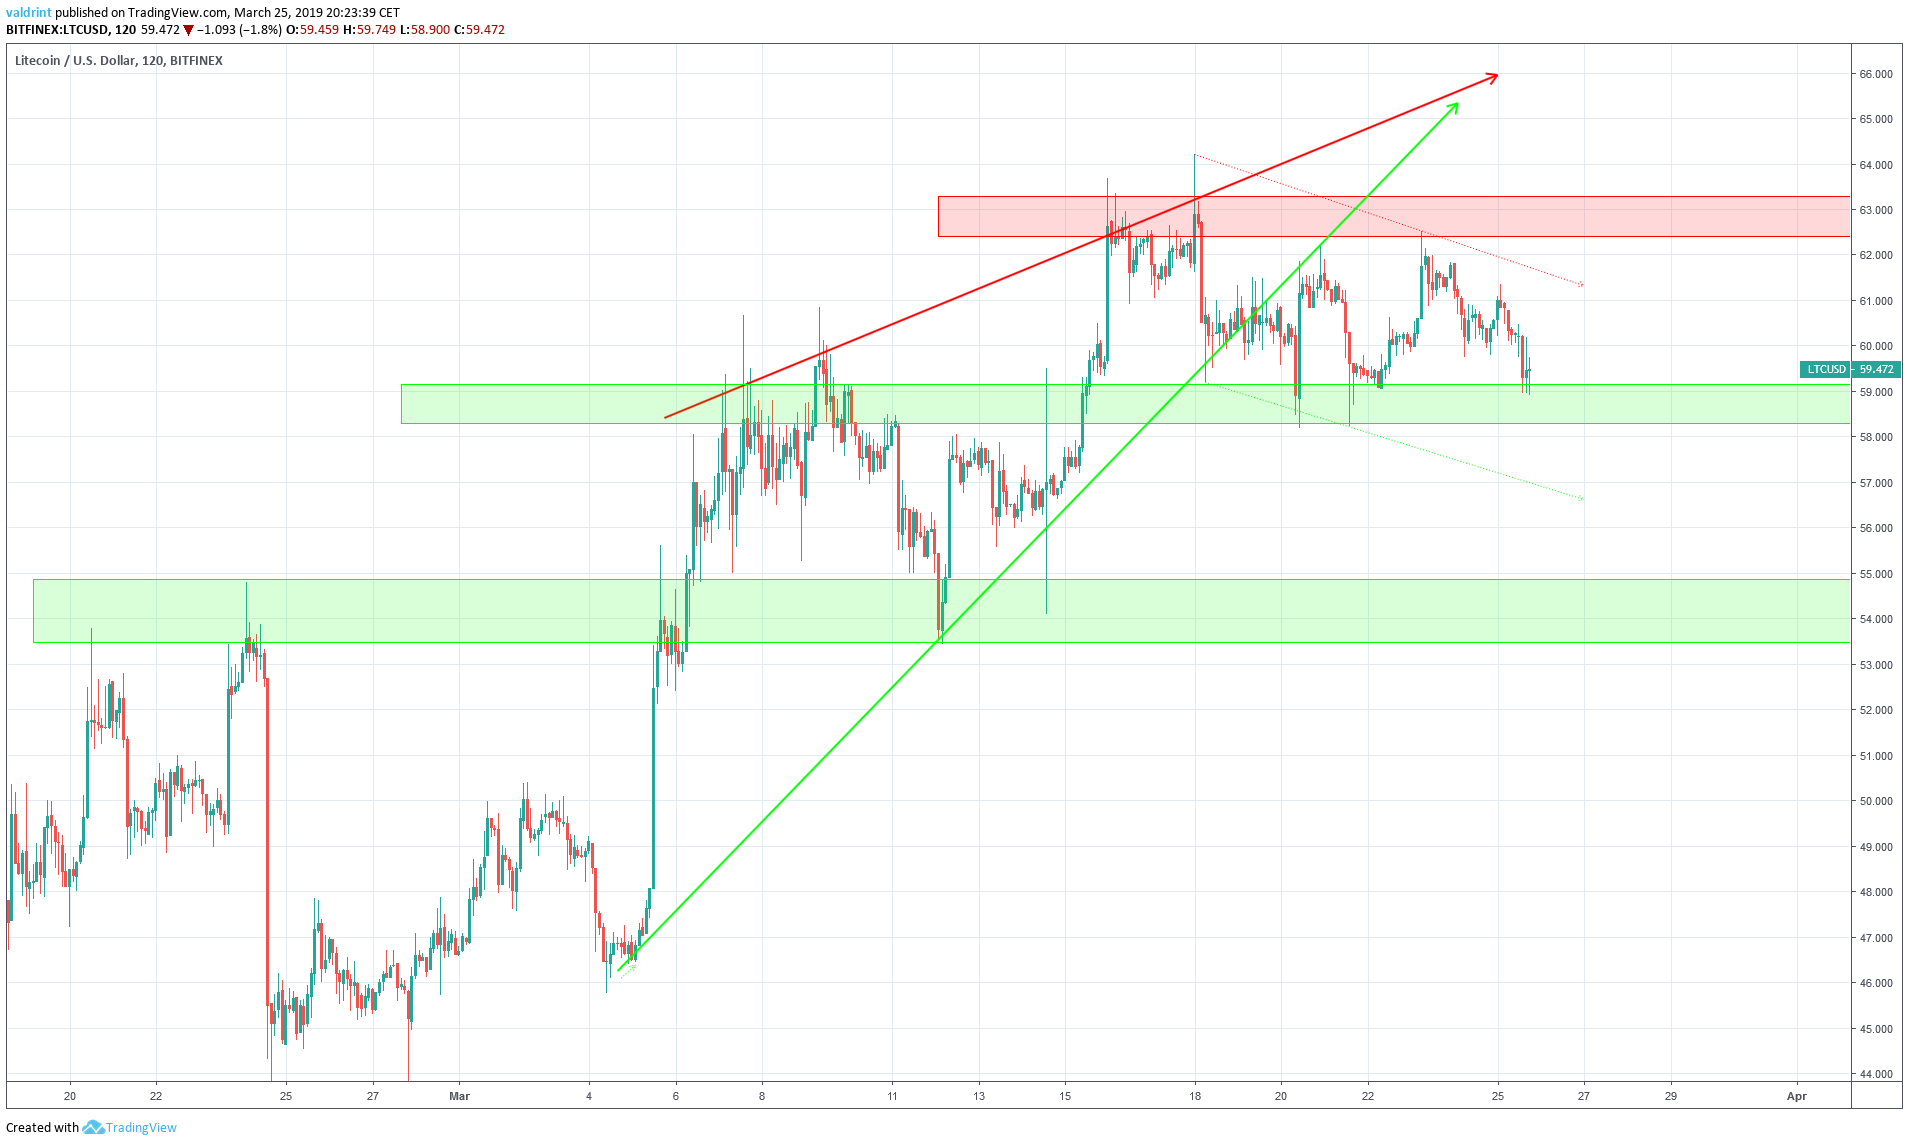
The closest resistance area is found near $64. If the price breaks out of the channel, it is likely to provide a reversal area. Based on our current analysis, this is unlikely. However, given the rapid increases in price which have occurred for LTC so far in 2019, this situation cannot be entirely ruled out.
The closest support area is found near $59 slightly below where price is currently trading. Another support area is found near $54. Based on our analysis it is very likely that Litecoin will reach this support in the near future. Price losses will likely continue to the second support along the current downward trend. Successively lower highs and lows should be expected during this corrective period.
Summary Of Analysis
Based on this analysis, it is likely that the price keeps trading inside the descending channel. This means continued gradual price decreases. Furthermore, we believe that price will drop toward the resistance of the downward facing horizontal channel in which Litecoin is currently trading.
Do you think the price of LTC has reached the top? Let us know in the comments below.
Disclaimer: This article is not trading advice and should not be construed as such. Always consult a trained financial professional before investing in cryptocurrencies, as the market is particularly volatile.


