See More

Are Bullish Price Gains Finally Returning to Litecoin? (LTC/USD and LTC/EUR Price Analysis for 04/25/19)

3 mins
Updated by Valdrin Tahiri
Join our Trading Community on Telegram

At BeInCrypto, we regular price analyses and predictions for Litecoin (LTC). In our Apr 23 Litecoin (LTC) analysis, we predicted price increases. Our prediction was invalidated the next day when the price broke down from the pattern we defined. To learn more, read our latest LTC/USD($) and LTC/EUR(€) analysis below:

On Apr 11, 2019, the price of Litecoin reached an hourly high of $88.47 and €78.73.
Price has since been decreasing, trading along a gradual downtrend.
Market Outlook
LTC/USD & LTC/EUR Prices: Apr 10 – 25
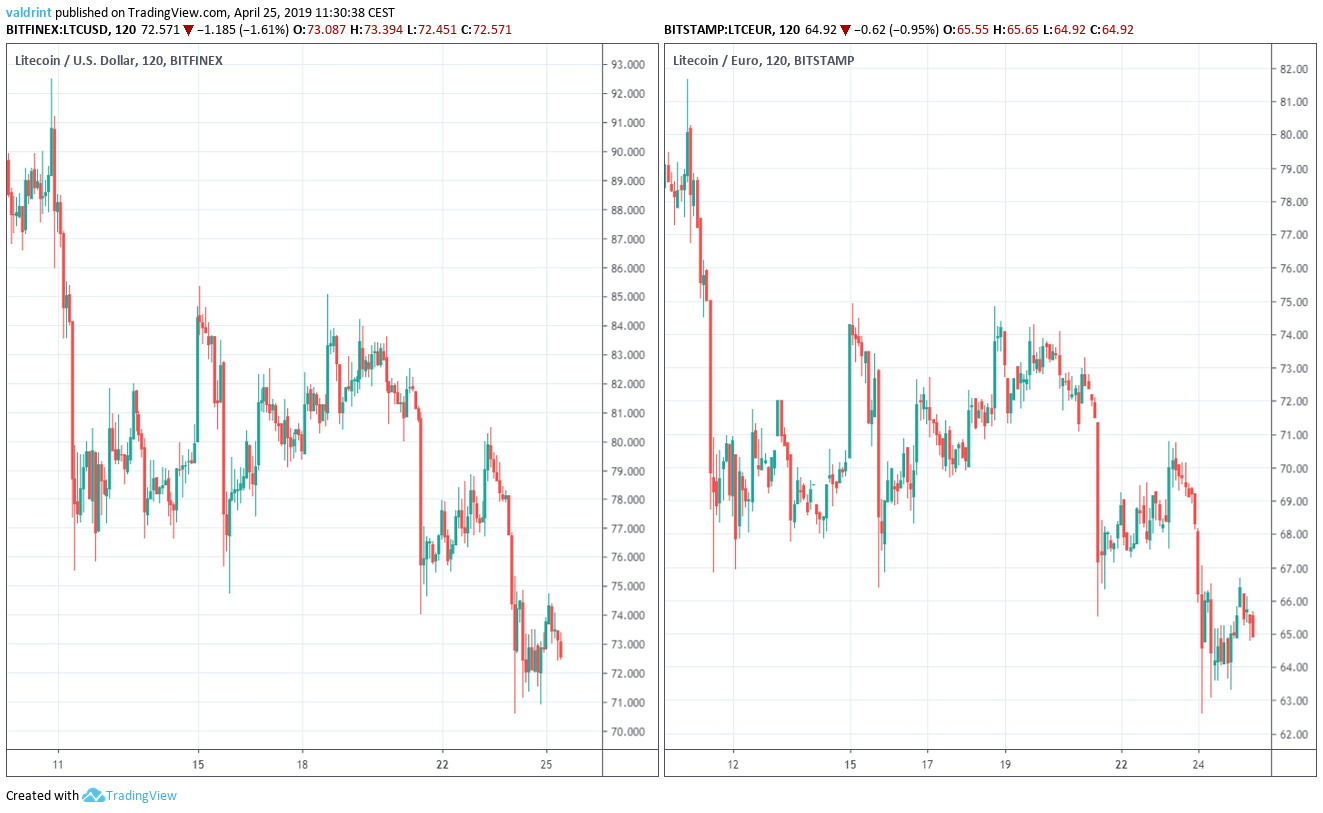
Lows near $70 and €62 were reached on Apr 24. Will Litecoin keep decreasing or will a reversal bring new highs? Let’s find out:

Litecoin (LTC): Trends And Highlights For April 25, 2019

  • Both LTC/USD and LTC/EUR have been on a downtrend since Apr 11.
  • Litecoin is trading inside a descending wedge.
  • Bullish divergence is developing in the RSI.
  • There is resistance near $76/€67.

Descending Channel

The price of LTC/USD on Bitfinex was analyzed at two-hour intervals from Apr 11 to Apr 25 to determine the current trading pattern. We do not include euros in this section because only one trading pair is needed to generate the current trading pattern. Both LTC/USD and LTC/EUR are discussed in the final two sections.
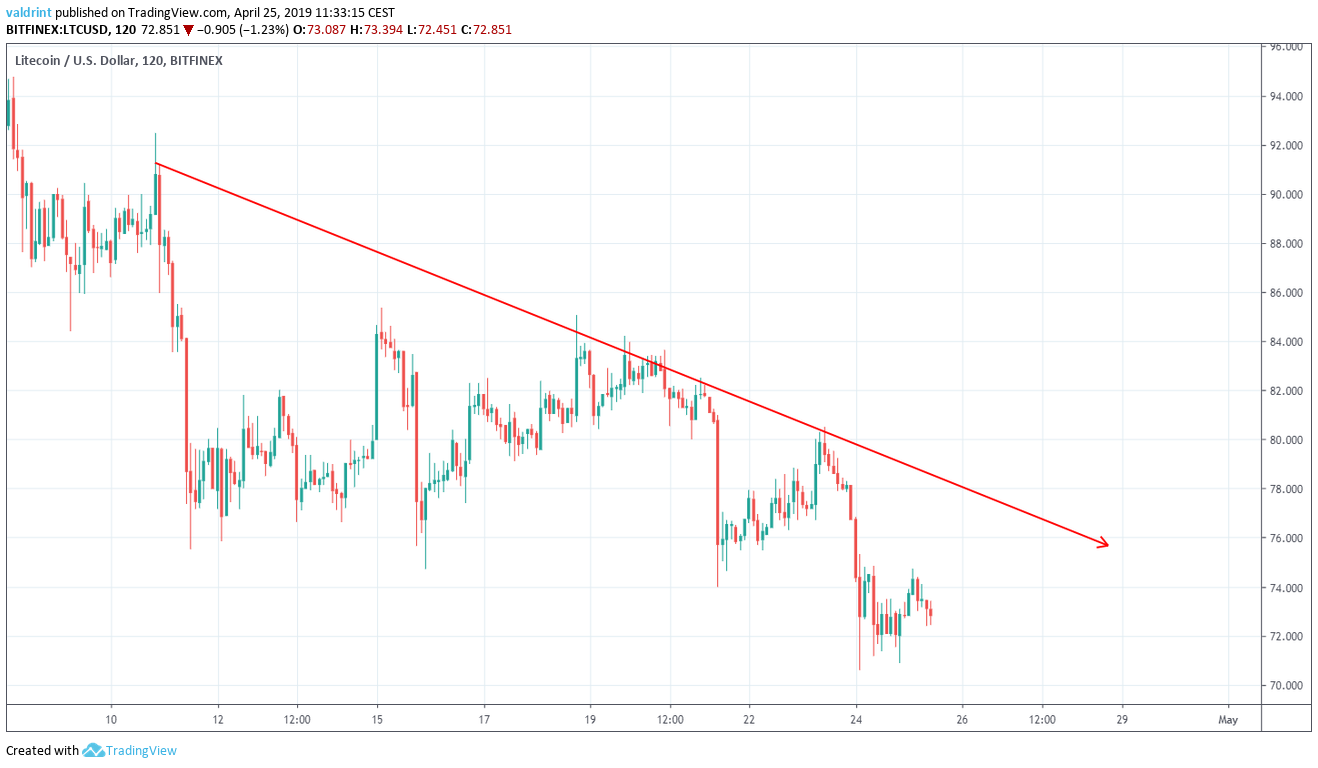
On Apr 11, the price reached an hourly high of $85.50. Several market cycles have been completed. The price has made lower highs each time. Tracing these highs gives us a descending resistance line: Litecoin Resistance Line On Apr 11, the price reached a low of $75.53. A gradual increase was followed by a gradual decrease. The price has made several lower lows. Tracing these lows gives us a descending support line. The support and resistance lines combine to create a descending wedge: Litecoin Wedge 
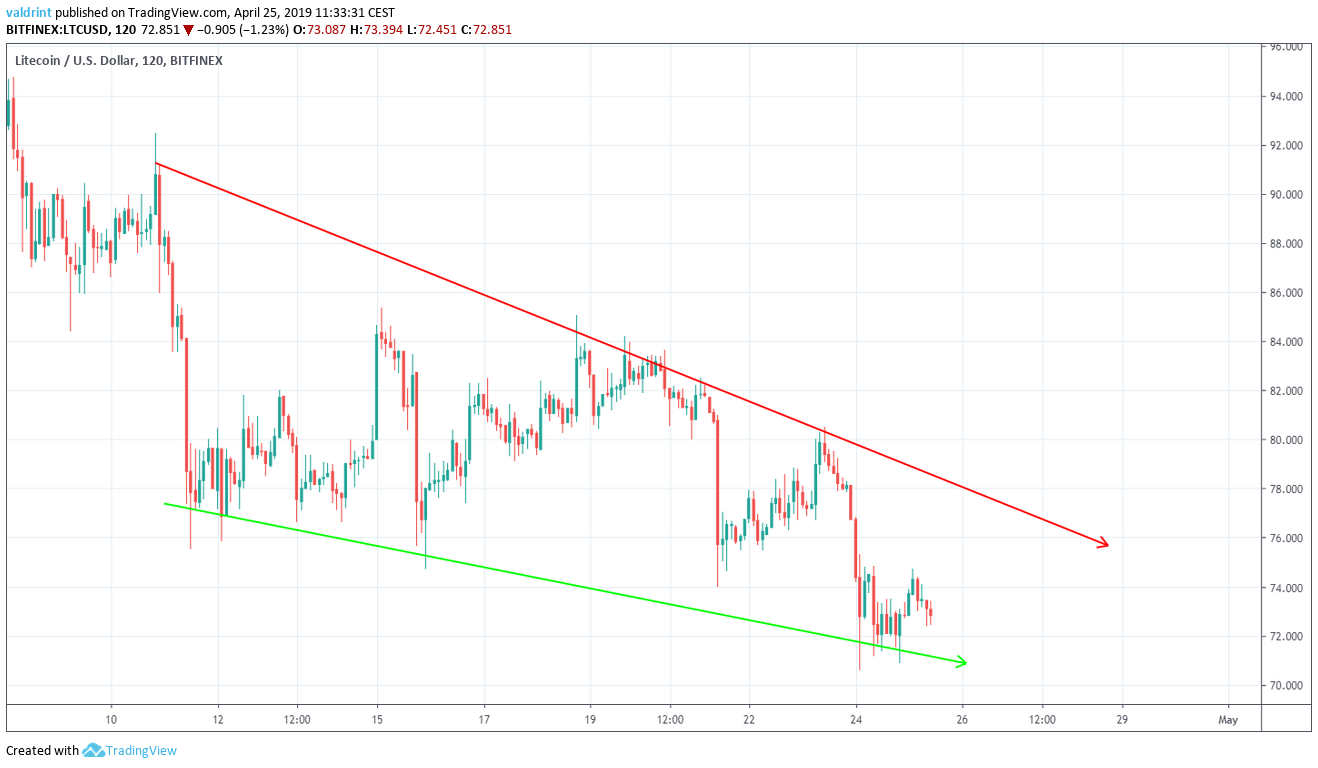
Litecoin is likely to trade inside the confines of the channel until a decisive move occurs. In order to predict the direction of the move, we need to take a look at technical indicators.

Technical Indicators

The relative strength index (RSI) is an indicator which calculates the size of the changes in price in order to determine oversold or overbought conditions in the market.
The price of LTC/USD is shown alongside the RSI below:
Divergence 
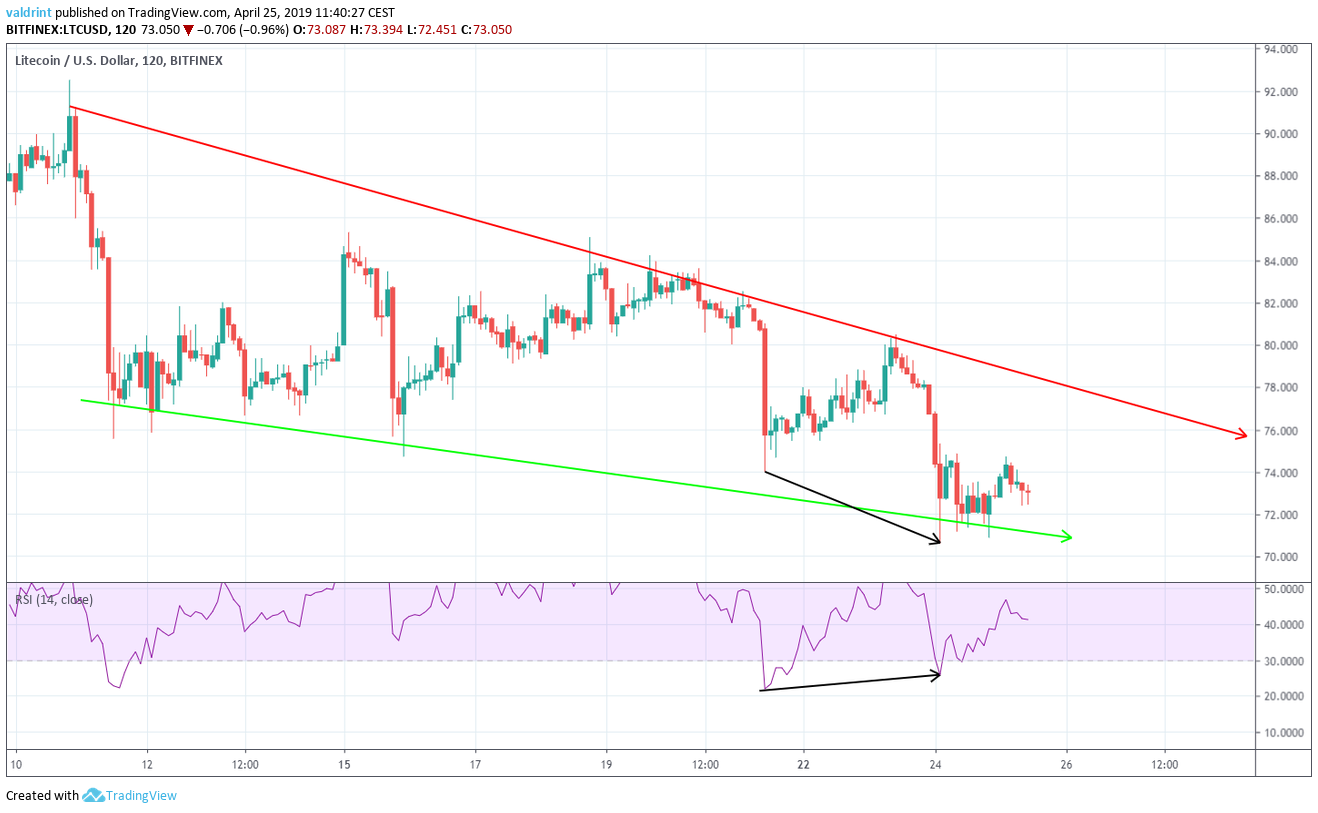
On Apr 21, the price reached a low of $74.0. It made a lower low of 70.6 on Apr 24. Similarly, the RSI made the first low on Apr 21. However, it has continued to generate higher values since. The use of this indicator and the creation of a bullish pattern makes it likely that the price will increase towards the resistance line of the wedge.

Future Movement

To better determine actual future price levels, we examine resistance areas.
Resistance areas are formed when the price reaches a certain level several times. In the case of a breakout/breakdown, they can provide likely areas of reversal.
One resistance area is shown for LTC/USD in the first graph and LTC/EUR in the second graph:
Litecoin Reversal
LTC/USD
Litecoin Reversal
LTC/EUR
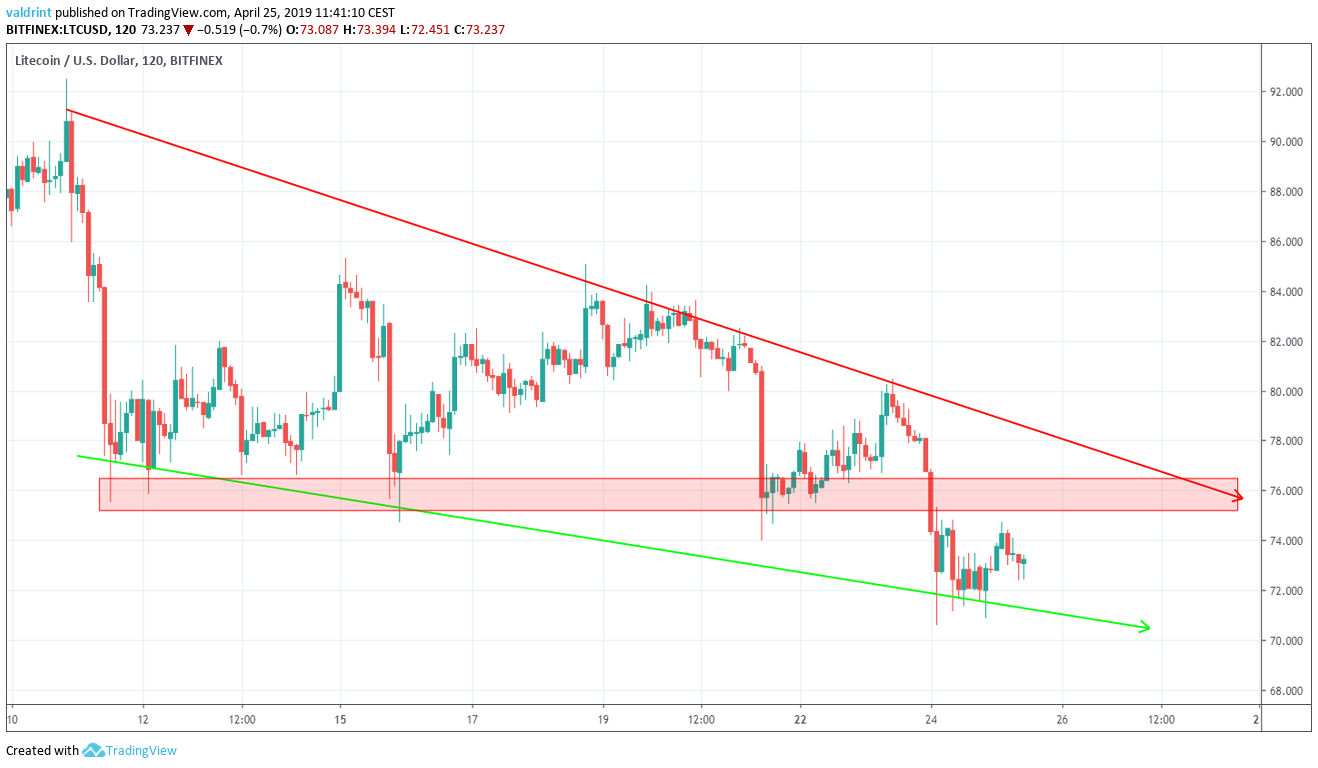
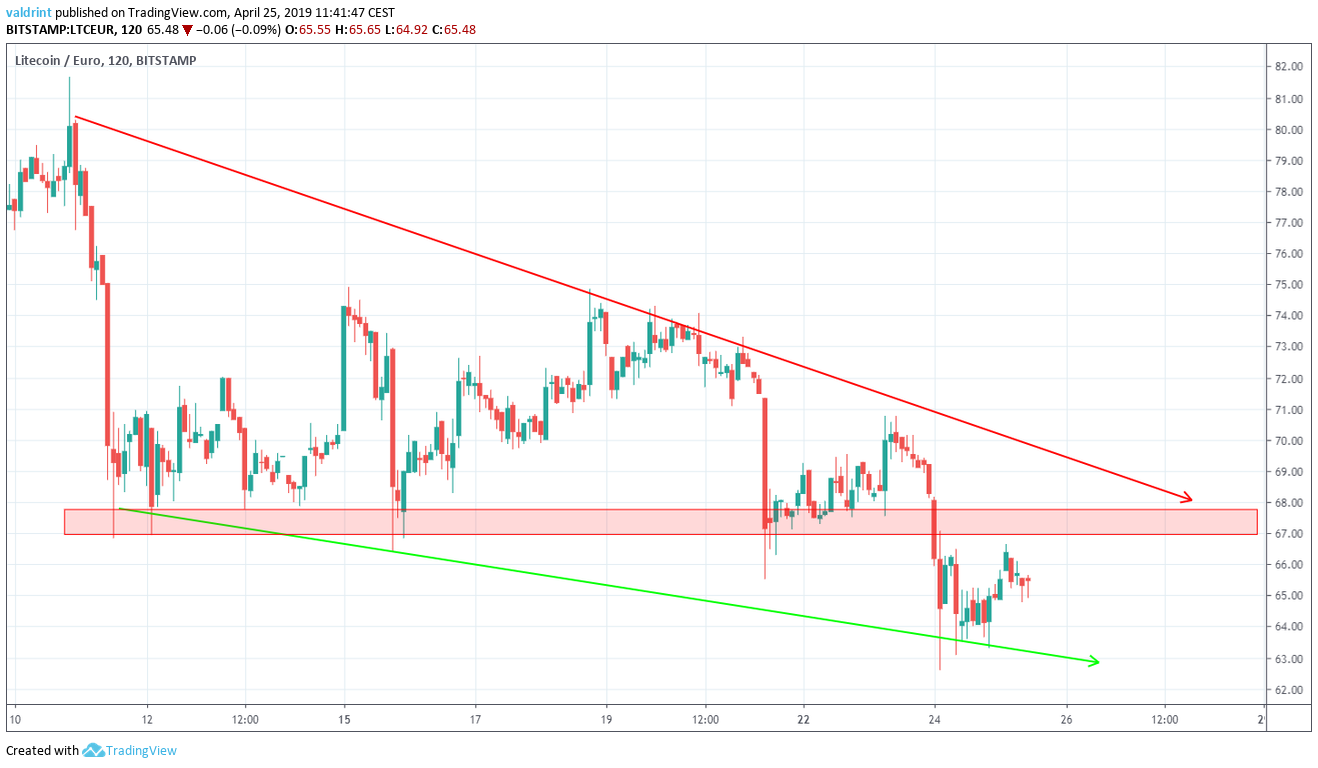
The closest resistance area is found near $76 and €67. We believe that the price will reach this area.

Summary Of Analysis

Based on this analysis, it is likely that the price will move towards the resistance line of the wedge. An eventual breakout is likely. Do you think the price of LTC will break out from the wedge?  Let us know in the comments below. If you’re interested in 2019 and 2020 price predictions for Litecoin in dollars, click on the green button below

Disclaimer: This article is not trading advice and should not be construed as such. Always consult a trained financial professional before investing in cryptocurrencies, as the market is particularly volatile.
Top crypto projects in the US | April 2024

Trusted

Disclaimer

In line with the Trust Project guidelines, this price analysis article is for informational purposes only and should not be considered financial or investment advice. BeInCrypto is committed to accurate, unbiased reporting, but market conditions are subject to change without notice. Always conduct your own research and consult with a professional before making any financial decisions. Please note that our Terms and ConditionsPrivacy Policy, and Disclaimers have been updated.

Valdrin-Tahiri.jpg
Valdrin Tahiri
Valdrin discovered cryptocurrencies while he was getting his MSc in Financial Markets from the Barcelona School of Economics. Shortly after graduating, he began writing for several different cryptocurrency related websites as a freelancer before eventually taking on the role of BeInCrypto's Senior Analyst. (I do not have a discord and will not contact you first there. Beware of scammers)
READ FULL BIO
Sponsored
Sponsored