


On Apr 6, 2019, the price of Litecoin reached a high of $98.80. A gradual decrease followed. Losses accelerated on Apr 10.
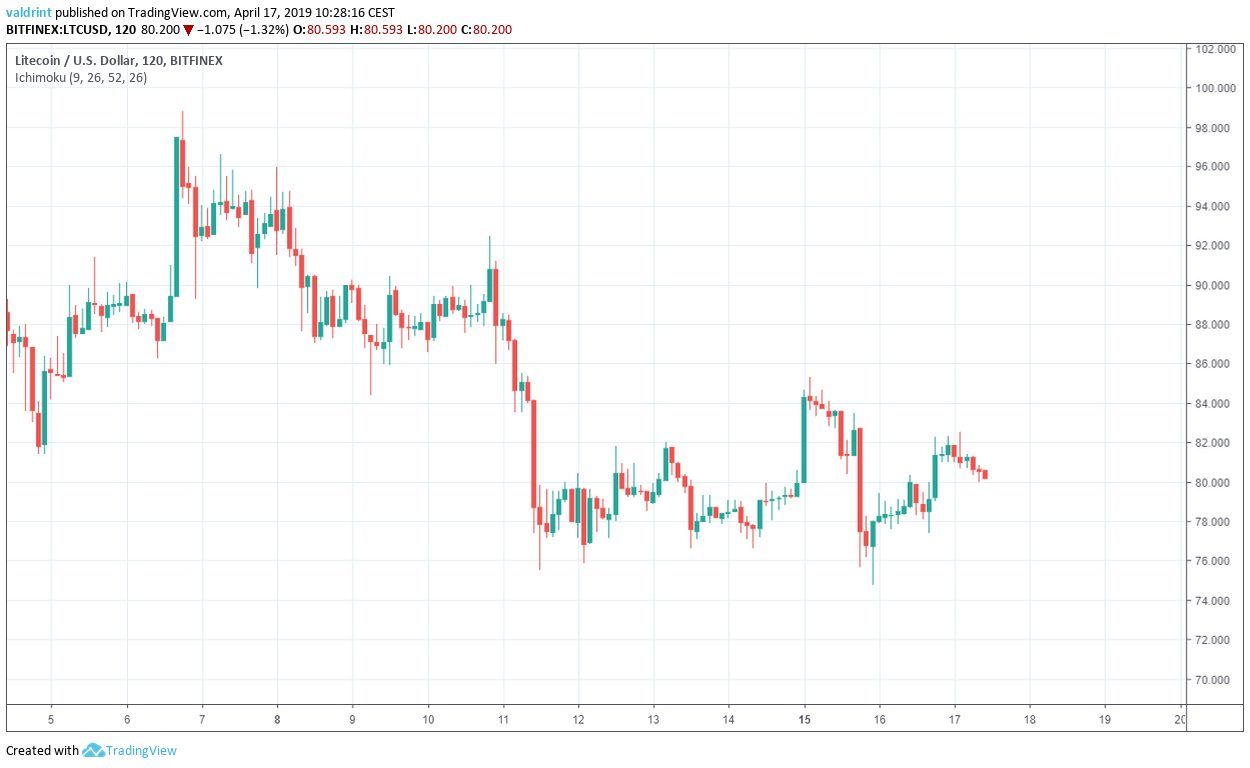
On Apr 15, Litecoin reached a low of under $75. By Apr 16, highs over $82 were reached. At the time of writing, however, Litecoin was trading slightly above $80.
Will this most recent dip bring prices back below the $80 threshold?
Let’s find out:
Litecoin (LTC): Trends And Highlights For April 17, 2019
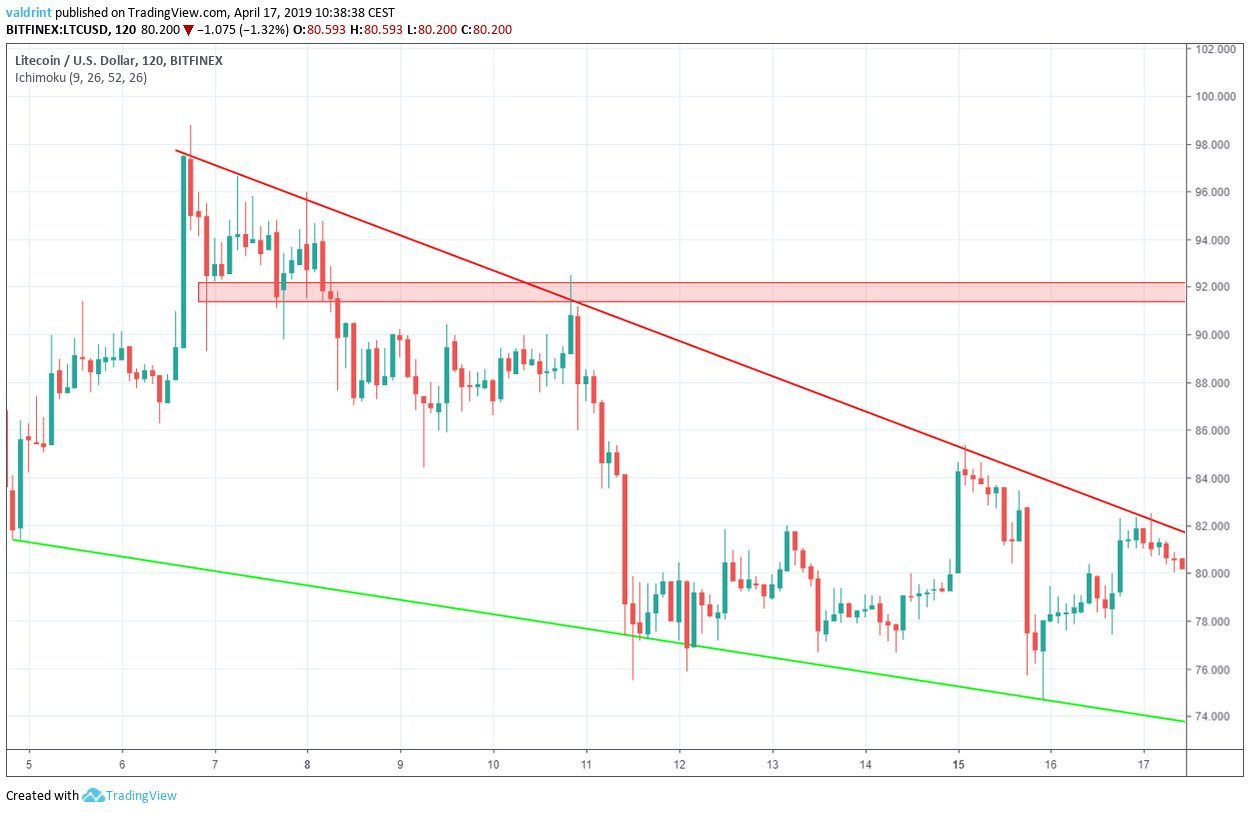
- The price of LTC/USD has been on a downtrend since Apr 6.
- Litecoin is trading inside a descending wedge.
- Bullish divergence is developing in the RSI and the MACD.
- There is resistance near $92.
Descending Wedge
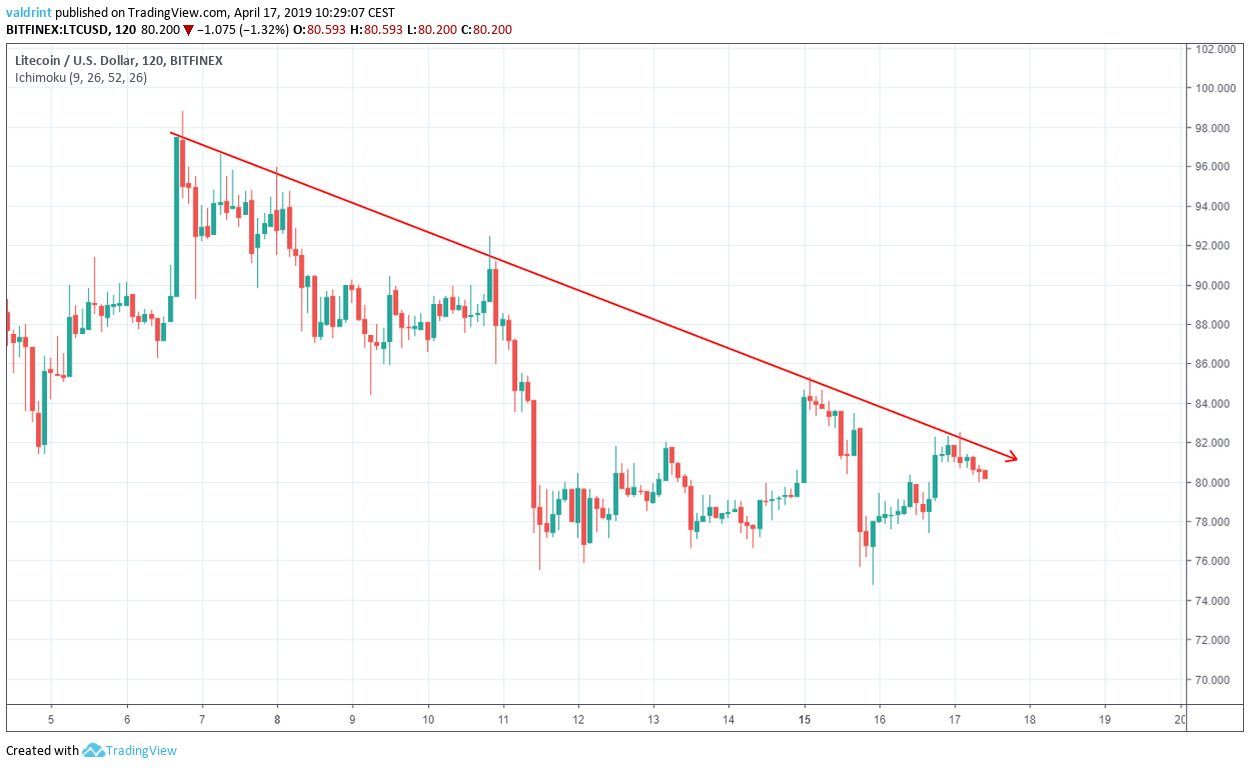
On Apr 6, the price reached a high of $98.80. Several market cycles have been completed and the price has made lower highs each time.
Tracing these highs gives us a descending resistance line:
On Apr 4, the price reached a low of $81.30. A gradual increase was followed by a gradual decrease. The price has made several lower lows. Tracing these lows gives us a descending support line.
The support and resistance lines combine to create a descending wedge:
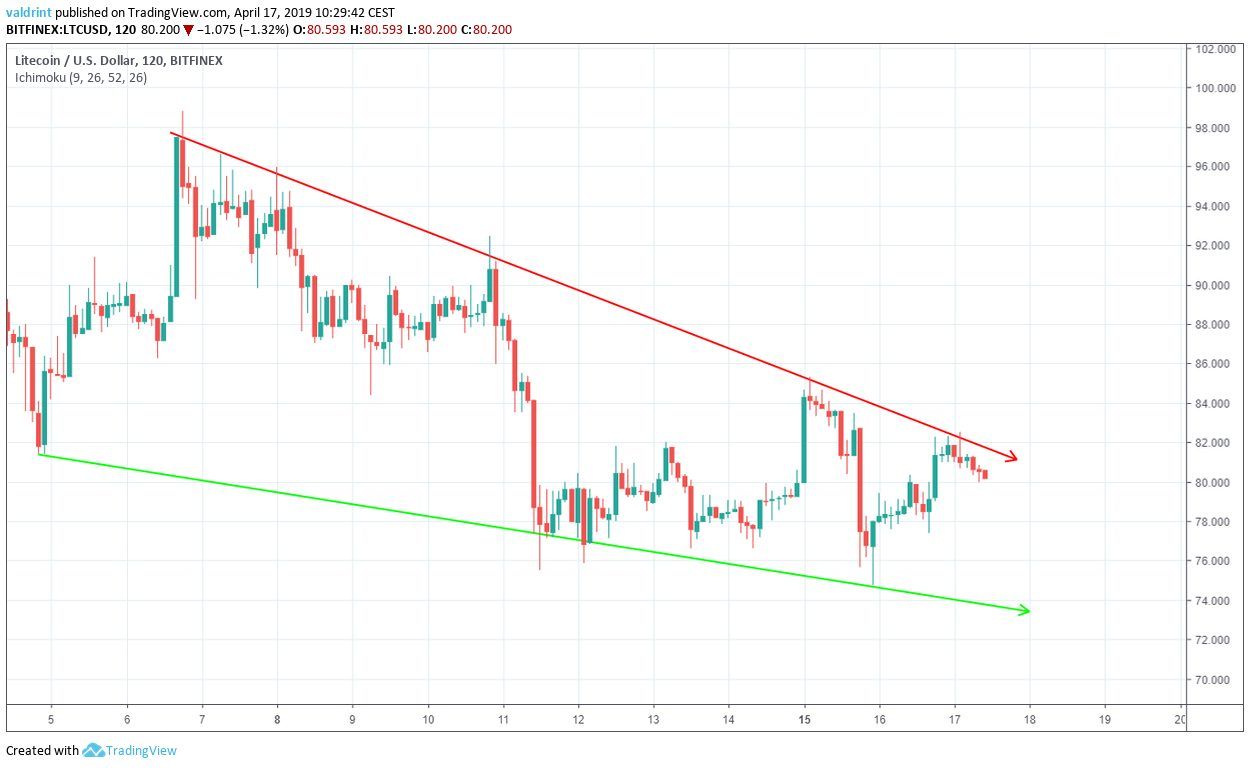
The price is likely to trade inside the confines of the wedge until a decisive move occurs.
In order to predict the direction of the move, we need to take a look at previous movements combined with technical indicators.
Previous Breakdown
We begin by incorporating the MACD and the RSI.
The moving average convergence divergence (MACD) is a trend indicator that shows the relationship between two moving averages (long and short-term) and the price. It is used to measure the strength of a move.
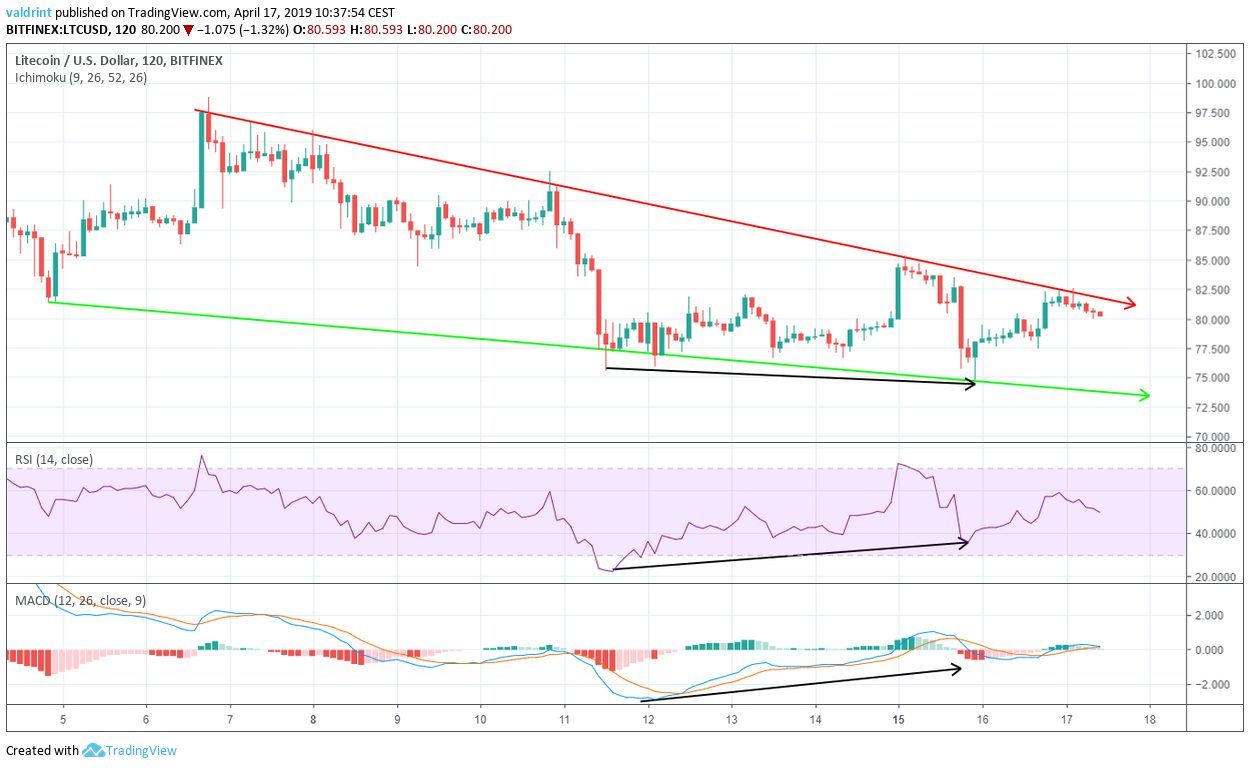
On Apr 11, the price reached a low of $75.53. It made a lower low of $74.72 on Apr 15.
Similarly, the RSI and the MACD reached the first low on Apr 11. However, they have proceeded to generate higher values since.
This is known as bullish divergence and often precedes price increases. Furthermore, it is occurring on the support line of a bullish pattern.
Using these indicators, it is likely that the price will break out of the wedge. However, it is possible that it drops towards the support line before eventually breaking out.
Future Movement
The closest resistance area is found near $92. If the price breaks out of the wedge, it is likely to reach this area. We believe this to be likely.
Summary Of Analysis
Based on this analysis, it is likely that the price break out of the wedge and reach the resistance area at $92.
Do you think the price of LTC will break out from the wedge? Let us know in the comments below.
Disclaimer: This article is not trading advice and should not be construed as such. Always consult a trained financial professional before investing in cryptocurrencies, as the market is particularly volatile.


