


The Litecoin (LTC) price has been increasing at an accelerated rate over the past two weeks and is currently approaching the $149 resistance area.
It should reach this area and possibly break out.
LTC Long-Term Levels
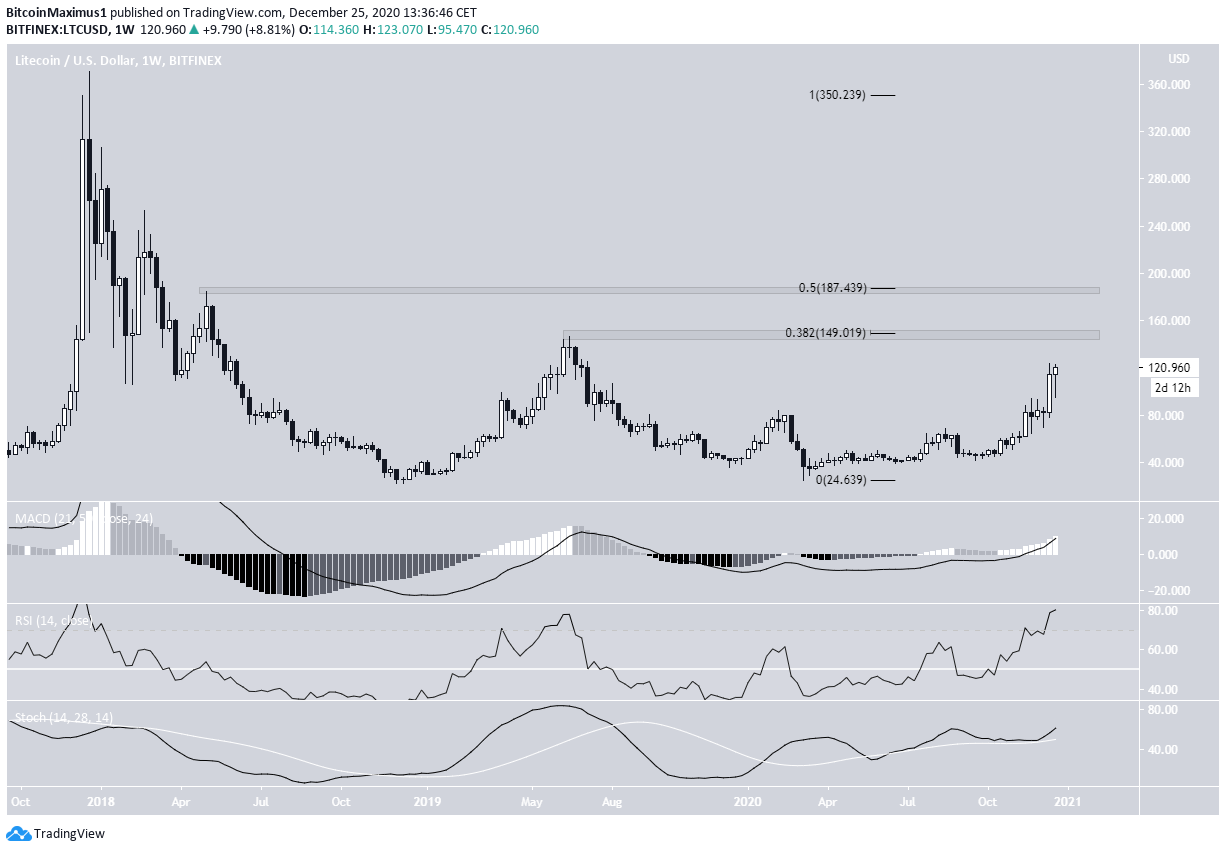
The weekly chart shows that LTC has been moving upwards since the beginning of March. It’s approaching the $149 resistance area, which is the 0.382 Fib retracement level of the entire previous downward move and coincides with the June 2019 highs.
If it breaks out successfully, the next resistance area would be at $187.
Technical indicators are bullish, supporting the possibility that it will rally at least to the $149 resistance area and possibly break out.
Future Movement
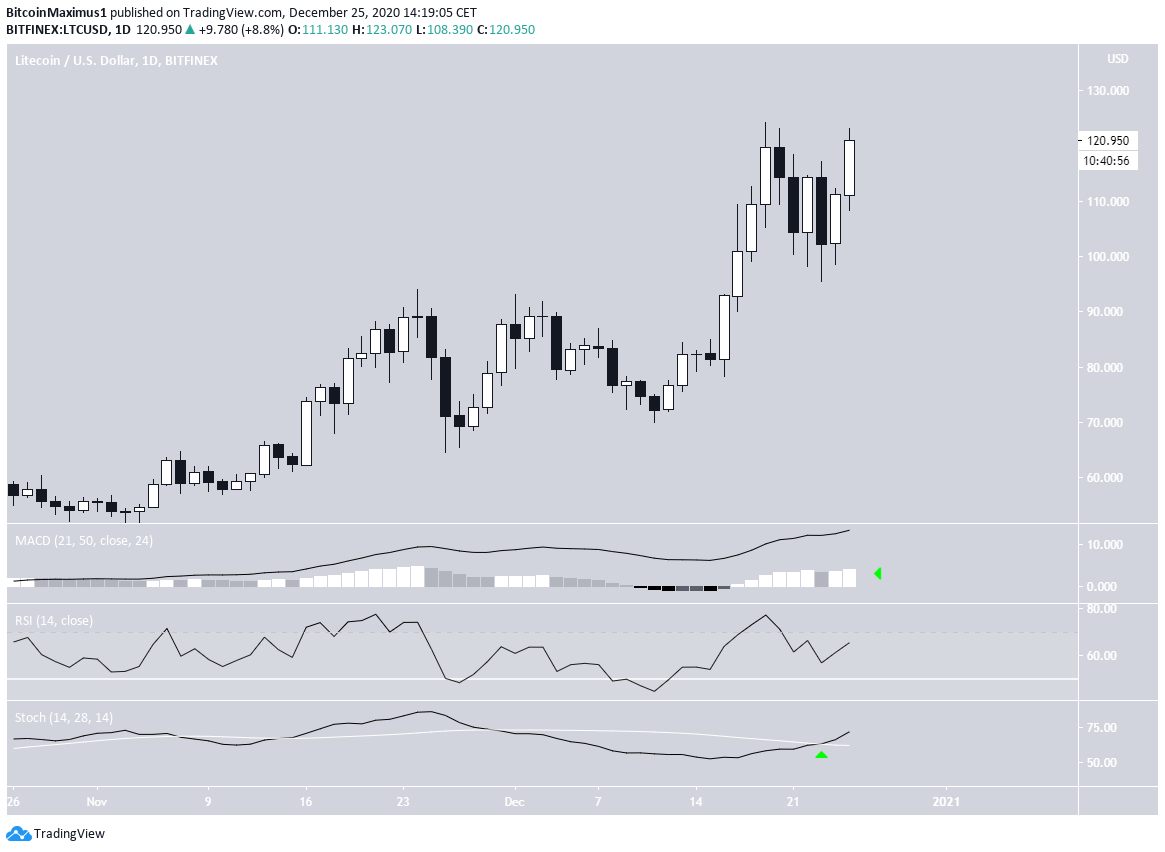
The daily chart also supports the possibility that it will increase at least to the $149 resistance area.
Despite a still unconfirmed bearish divergence in the RSI, both the MACD and Stochastic Oscillator are moving upwards, showing no signs of weakness whatsoever.
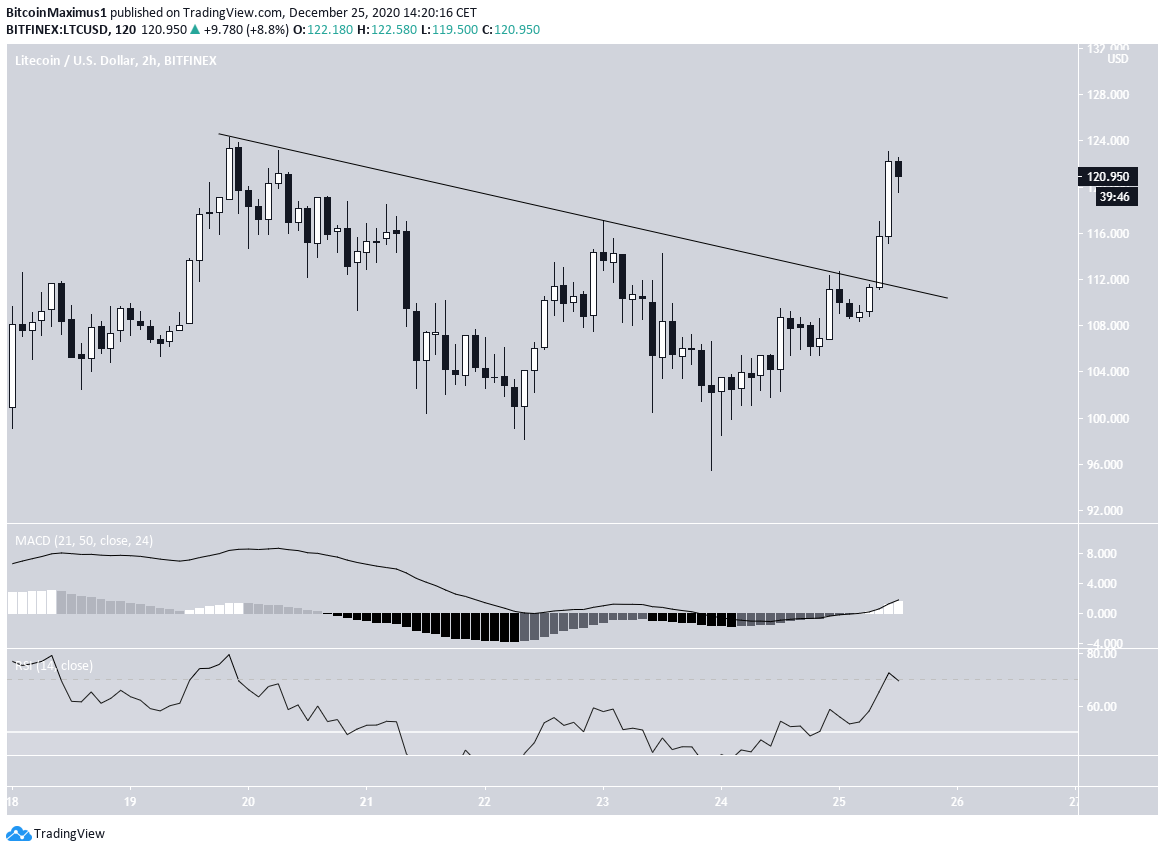
The shorter-term two-hour chart shows that LTC has already broken out from a descending resistance line and has moved upwards at an accelerated rate.
Similar to the weekly and daily time-frames, technical indicators are bullish. Therefore, LTC is likely to continue increasing towards $149 and possibly $187.
A decline below the $100 support area would invalidate this possibility.
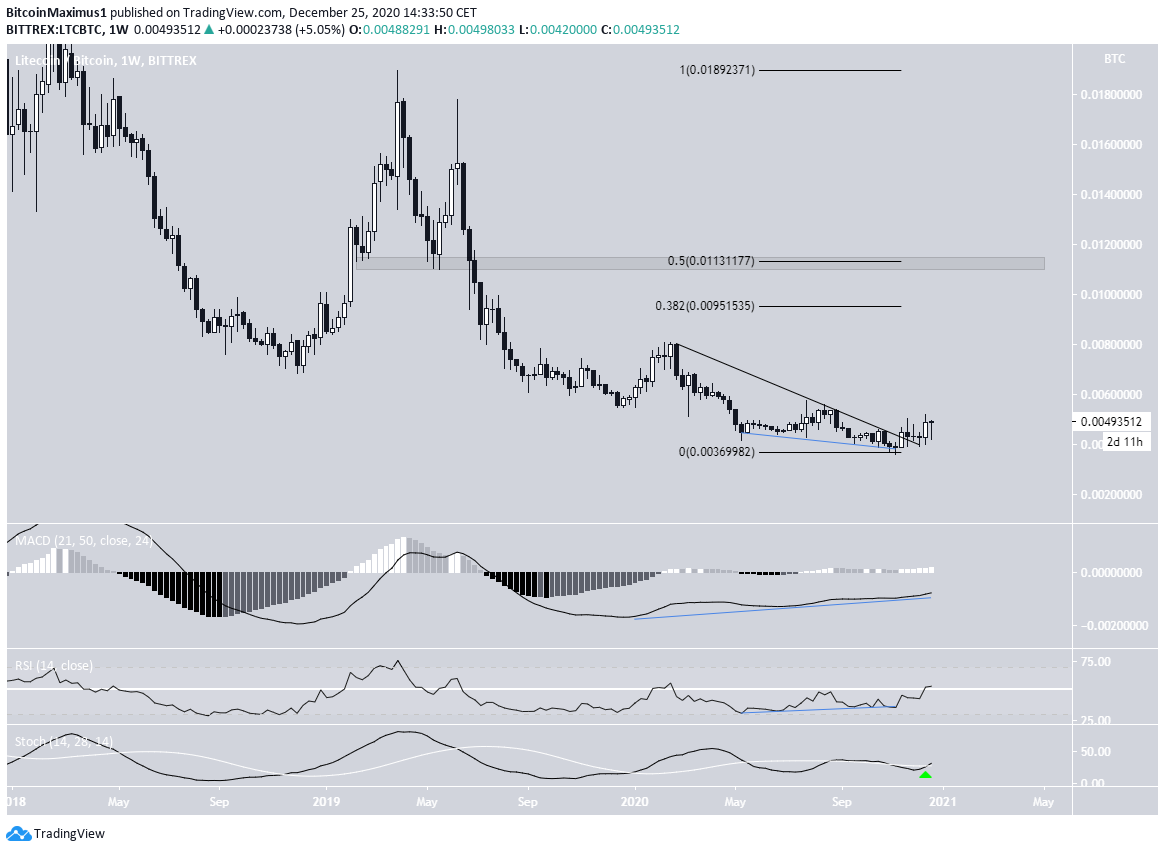
LTC/BTC
Cryptocurrency trader @damskotrades outlined an LTC/BTC chart, stating that it has fallen back to the range low. He expects a significant upward move.
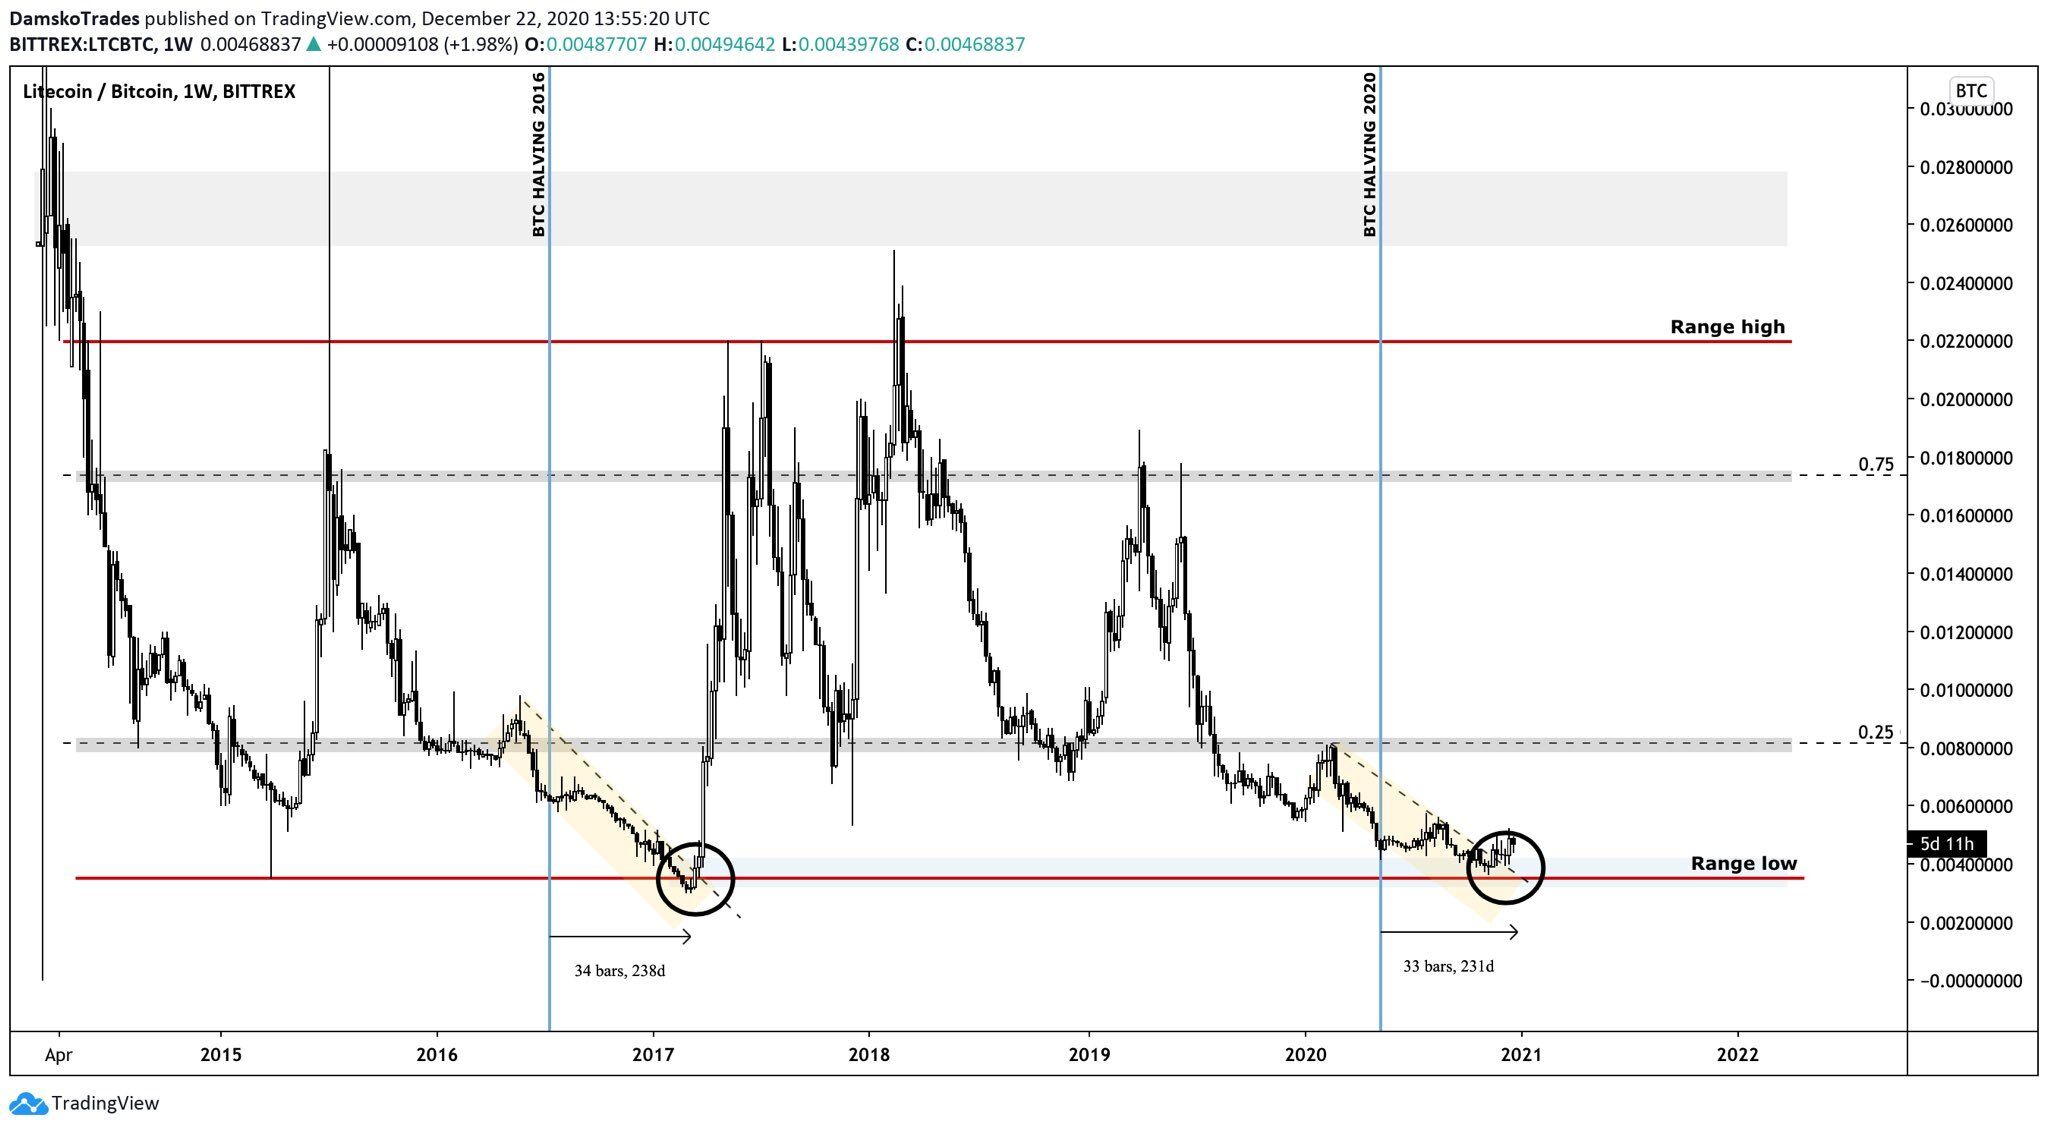
The weekly LTC/BTC chart looks quite bullish.
First, LTC has broken out from a descending resistance line that had previously been in place since the beginning of the year. Also, there is significant bullish divergence in both the MACD and the RSI, the latter having just crossed above 50. Finally, the Stochastic Oscillator has just made a bullish cross.
Therefore, LTC should continue increasing towards ₿0.0095 and possibly ₿0.011
Conclusion
To conclude, the LTC/USD pair is likely to continue increasing towards $149 and possibly $187.
On the other hand, LTC/BTC looks macro bullish and should slowly move towards ₿0.0095 and possibly ₿0.011
For BeInCrypto’s latest Bitcoin (BTC) analysis, click here!
Disclaimer: Cryptocurrency trading carries a high level of risk and may not be suitable for all investors. The views expressed in this article do not reflect those of BeInCrypto.


