


The Litecoin (LTC) price was rejected by an important resistance area and has fallen back below it since.
Despite the drop, Litecoin is expected to find support soon and move towards the resistance areas outlined below.
Litecoin Rejected from Long-Term Resistance
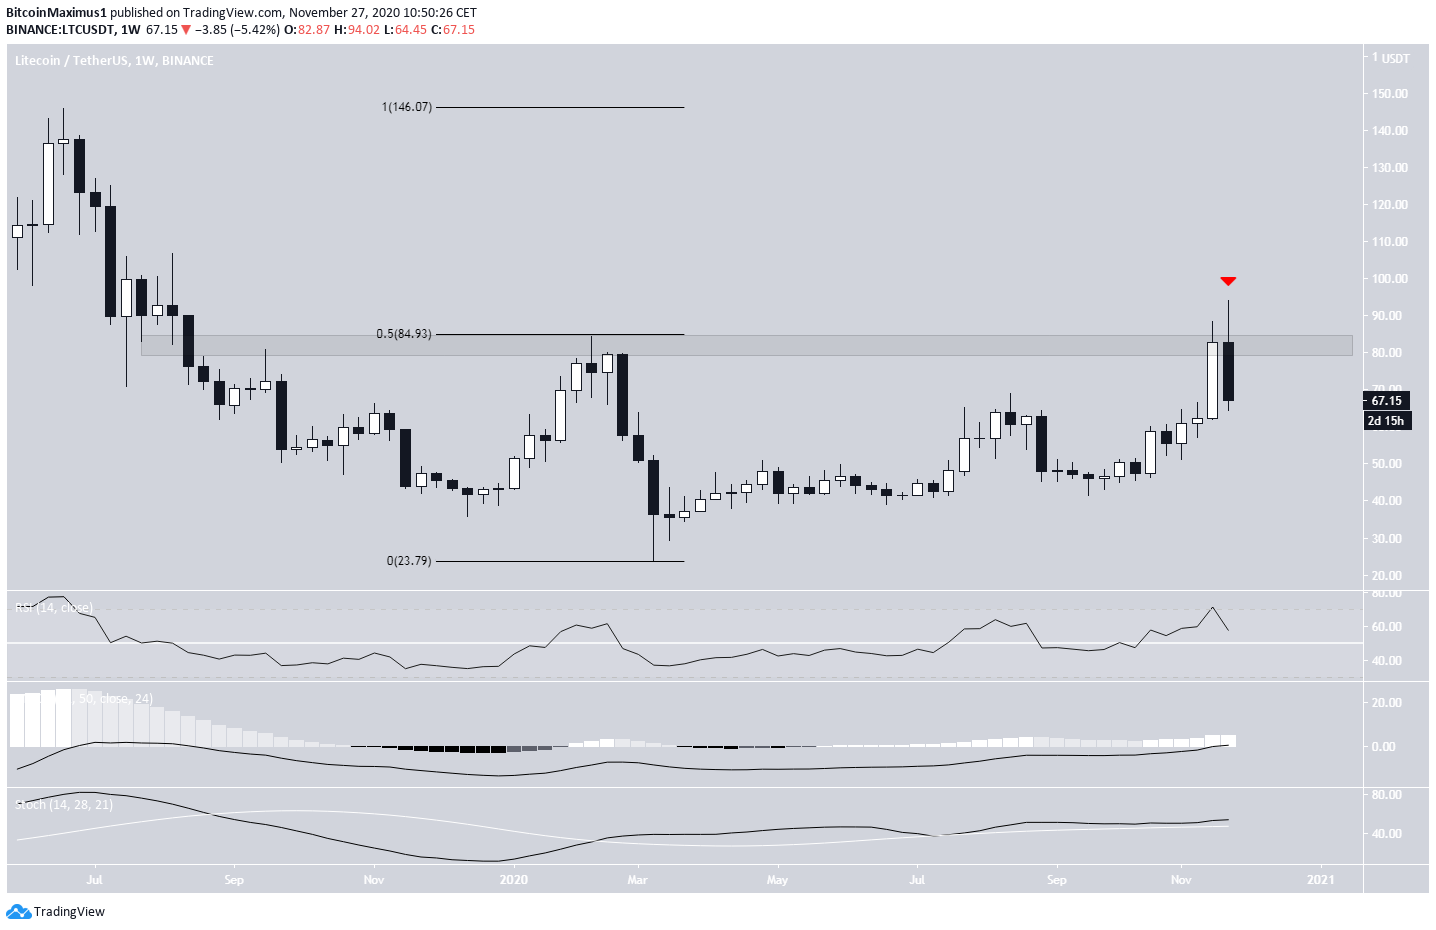
During the week of Nov. 16-23, the LTC price increased considerably, creating a bullish candlestick that took the price to the $85 resistance area.
While LTC seemingly broke out from this area at the start of the following week after reaching a high of $94.02, it was rejected shortly afterward and has now fallen back below the area once again.
Despite the drop, long-term technical indicators are still bullish. Both the MACD and Stochastic Oscillator are increasing, The former is above 0 and the latter having made a bullish cross. While the RSI is decreasing, it is still above 50.
A weekly close above $85 would likely mean that LTC Is heading higher, possibly towards the June 2019 highs of $146.
LTC Looks for Support
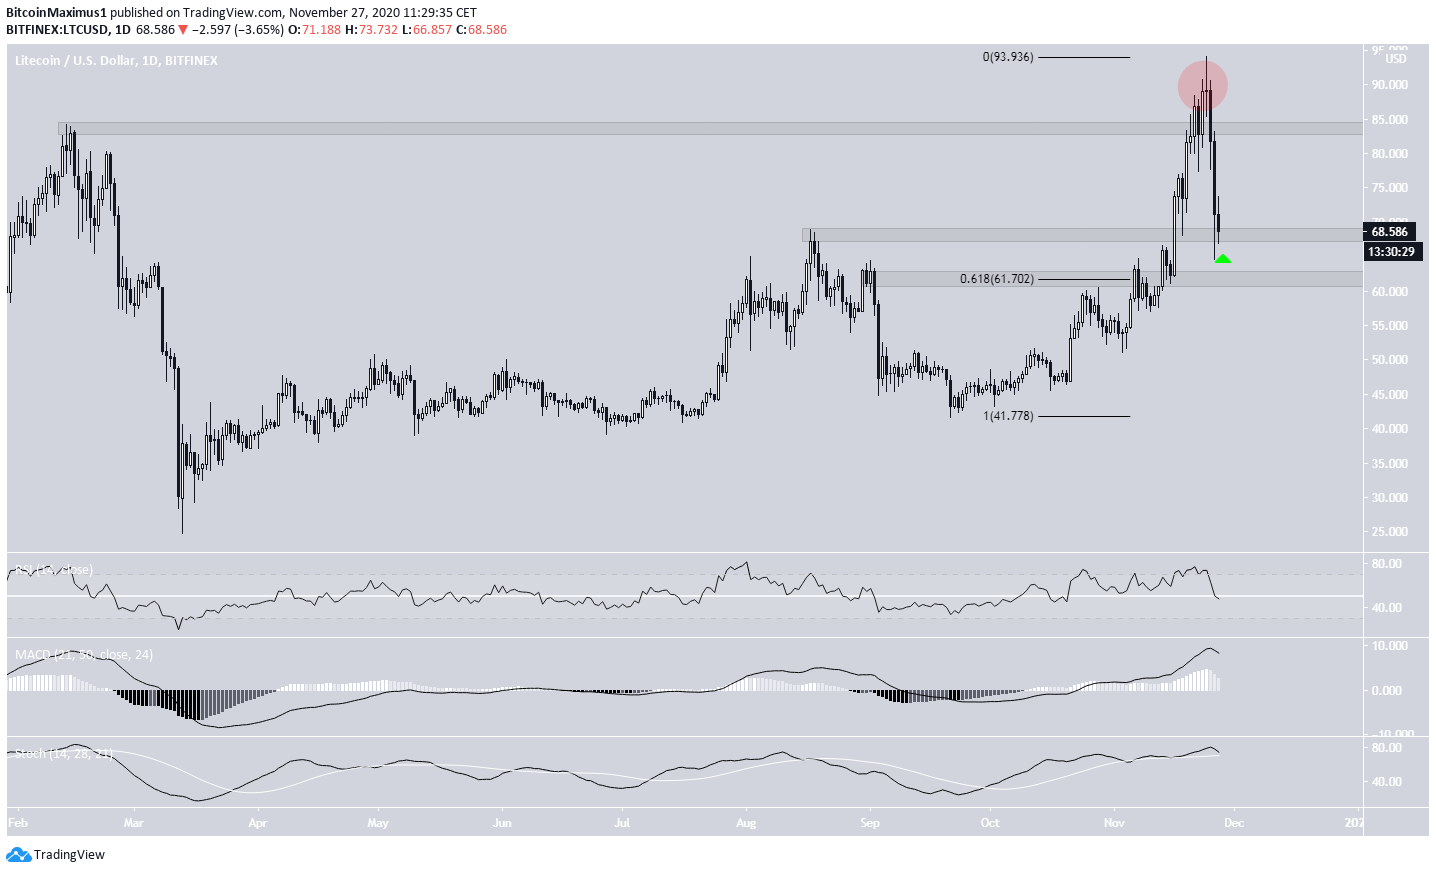
The daily chart shows that despite the sharp drop, LTC has managed to hold on above the $68 support area, which had previously acted as a resistance.
Even if the price were to decrease below it, the $60 level is also likely to provide support, being both a horizontal support level and the 0.618 Fib retracement level of the entire upward move.
Technical indicators are still leaning bearish but at risk of going down.
An interesting occurrence is a deviation above the $85 resistance area, which was followed by a sharp drop back below.
However, as long as the LTC price is trading above one of these two support levels, it is expected to eventually make another attempt at breaking out above $85.
Wave Count
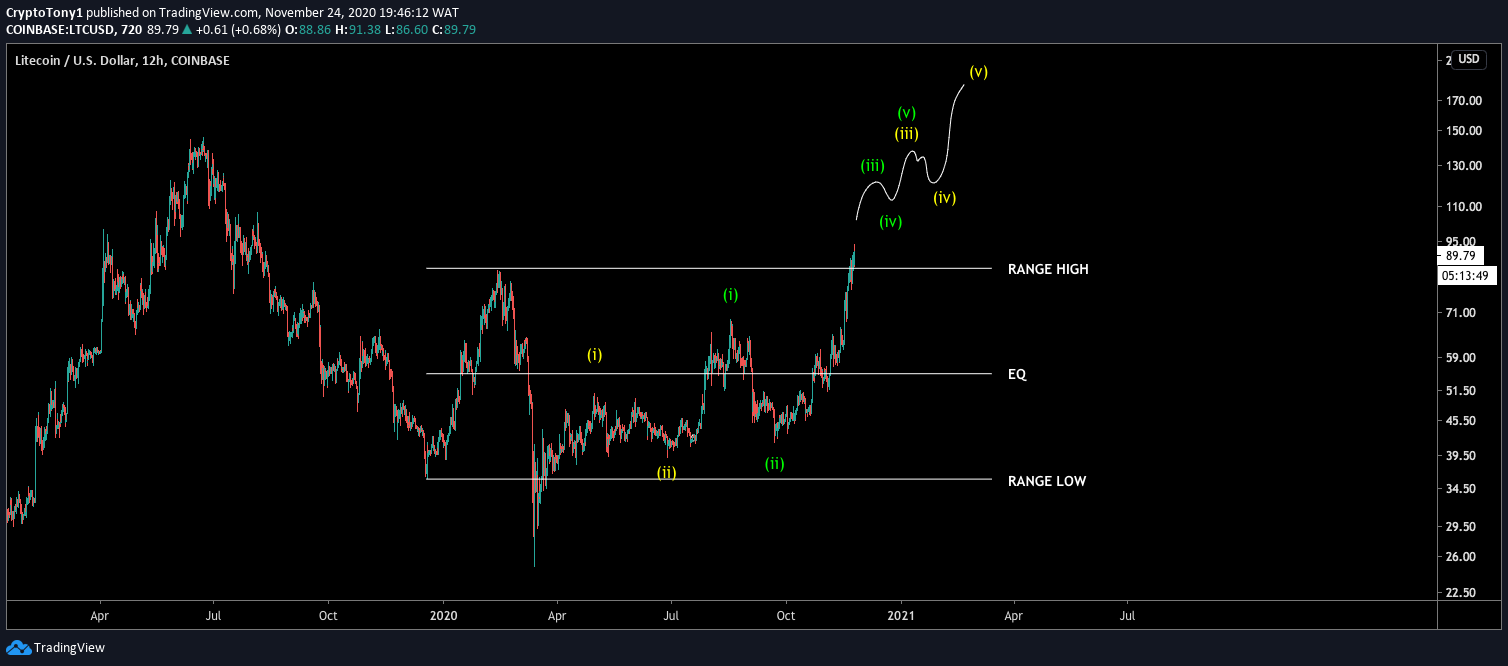
Cryptocurrency trader @Crypto_Tony outlined a wave count for LTC, showing that the price is in an extended third wave that has transpired after a 1-2/1-2 wave formation.
Tony suggests that the price could increase all the way to $200.
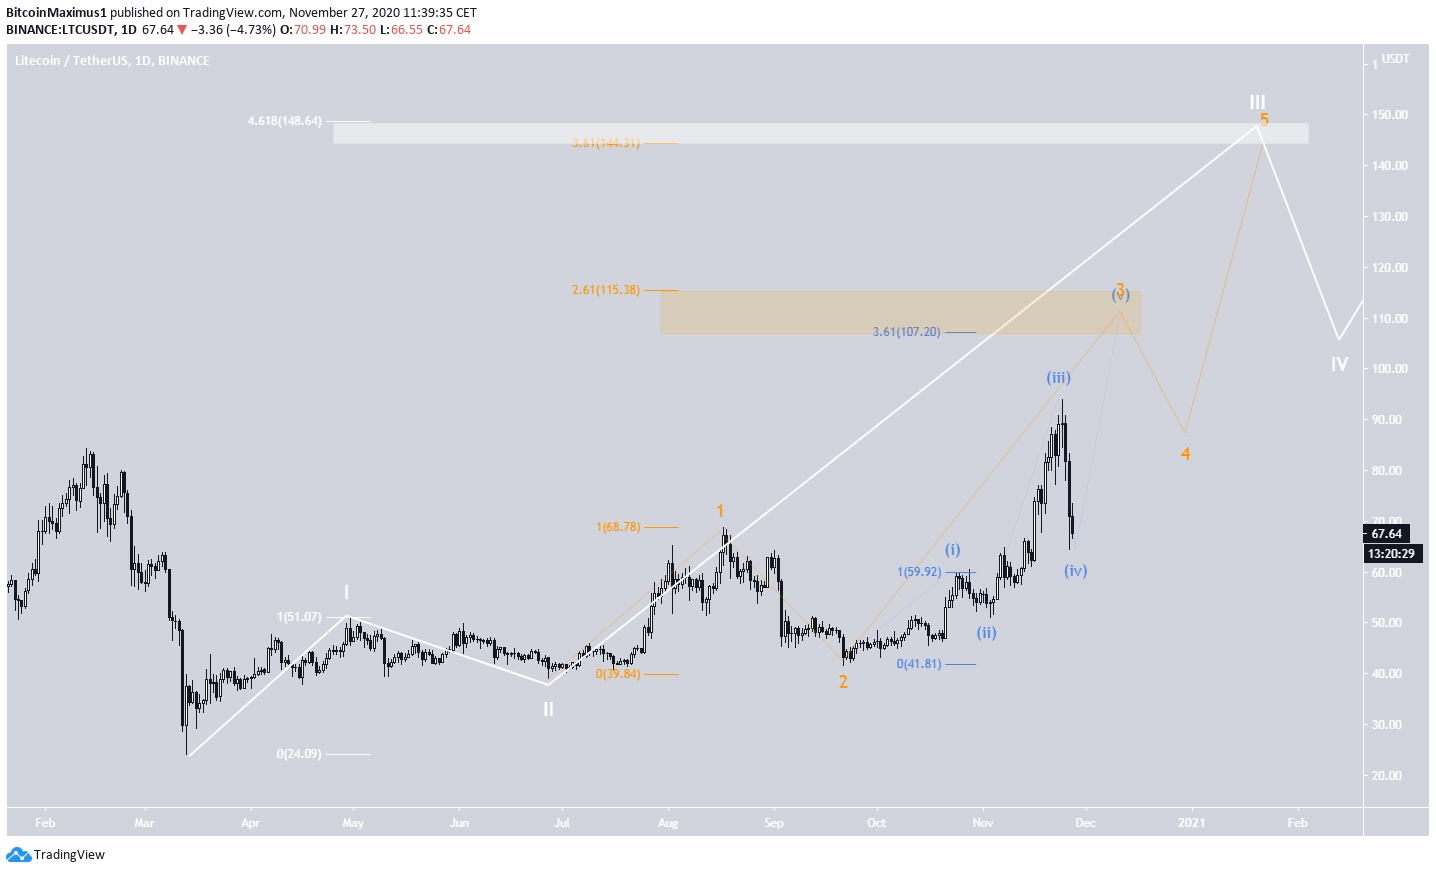
The most likely wave count is indeed a 1-2/1-2 wave formation, in which the price is currently in an extended third wave (white). The most likely target for the top of this move would be between $144-$148, the 4.618 Fib extension of wave 1 and the 3.61 Fib extension of sub-wave 1 (orange). This would also fit with the resistance area outlined in the first section.
Litecoin also appears to be in sub-wave 3 (orange), which is expected to end between $107-$115. The minor sub-wave count is shown in blue.
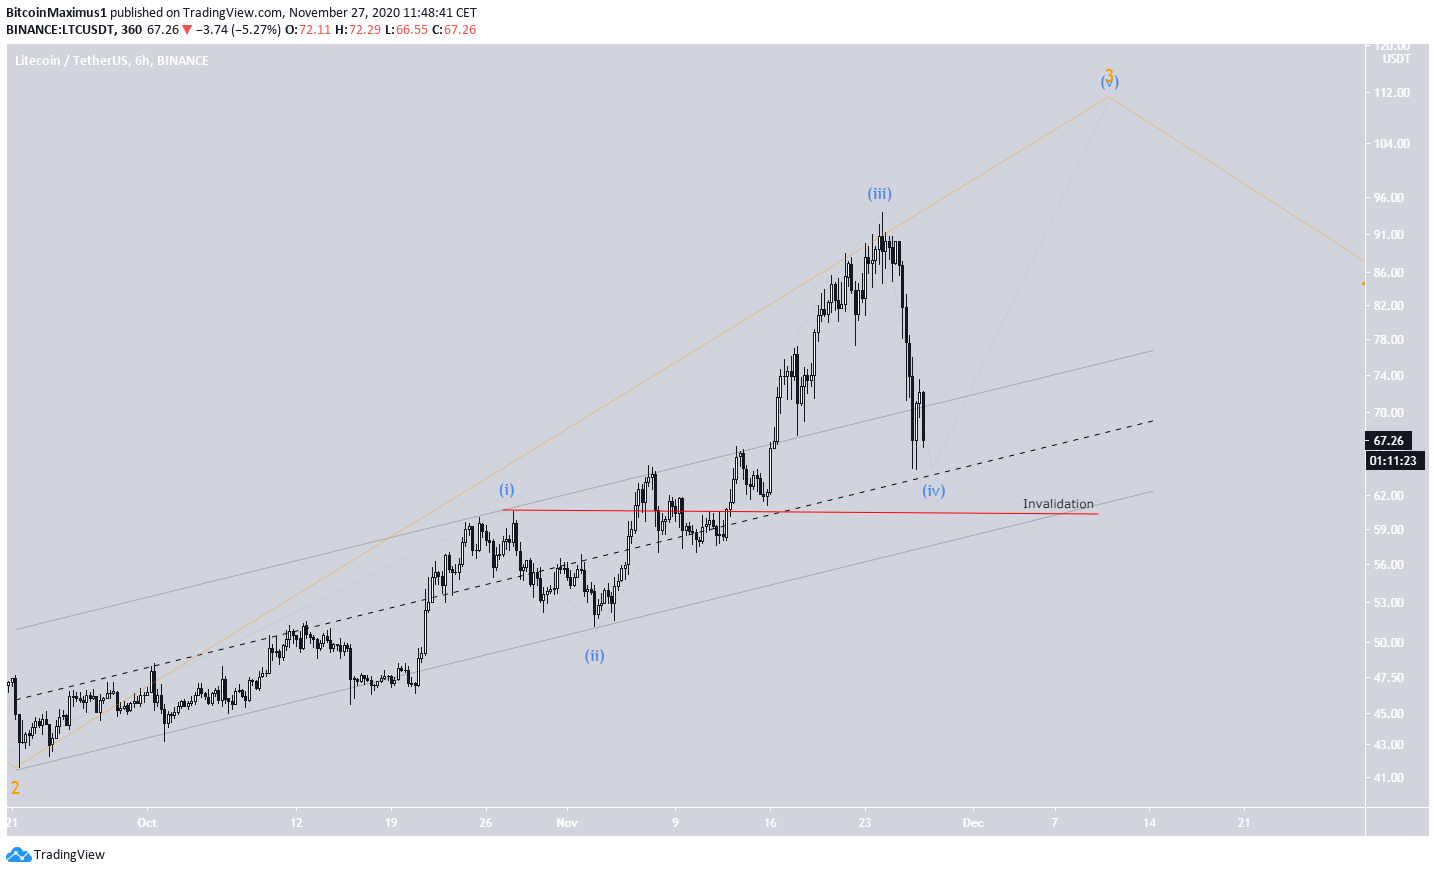
(In the chart below, the Fib and wave colors correspond with each other)
The six-hour chart shows that the price has broken out from a parallel ascending channel and is in the process of returning back inside, in what looks like a possible fourth wave pullback before the price resumes its upward movement.
A decrease below the minor sub-wave 1 high at $60.55 (red line) would invalidate the fourth wave pullback possibility.
Conclusion
Litecoin is expected to find support between $60-$65 and eventually resume its upward movement, possibly reaching a high near $145.
For BeInCrypto’s latest Bitcoin analysis, click here!
Disclaimer: Cryptocurrency trading carries a high level of risk and may not be suitable for all investors. The views expressed in this article do not reflect those of BeInCrypto


