


Litecoin’s (LTC) price is stuck in a bearish pattern that could halt its ongoing rally and push the altcoin downward.
To make this worse, LTC is currently witnessing no support from its investors, which could extend the losses.
Will Litecoin Lose to the Bears?
Litecoin’s price has been in an uptrend for the past two weeks. However, this Silver to Bitcoin’s Gold path could change soon. Even LTC holders do not seem very bullish at the moment.
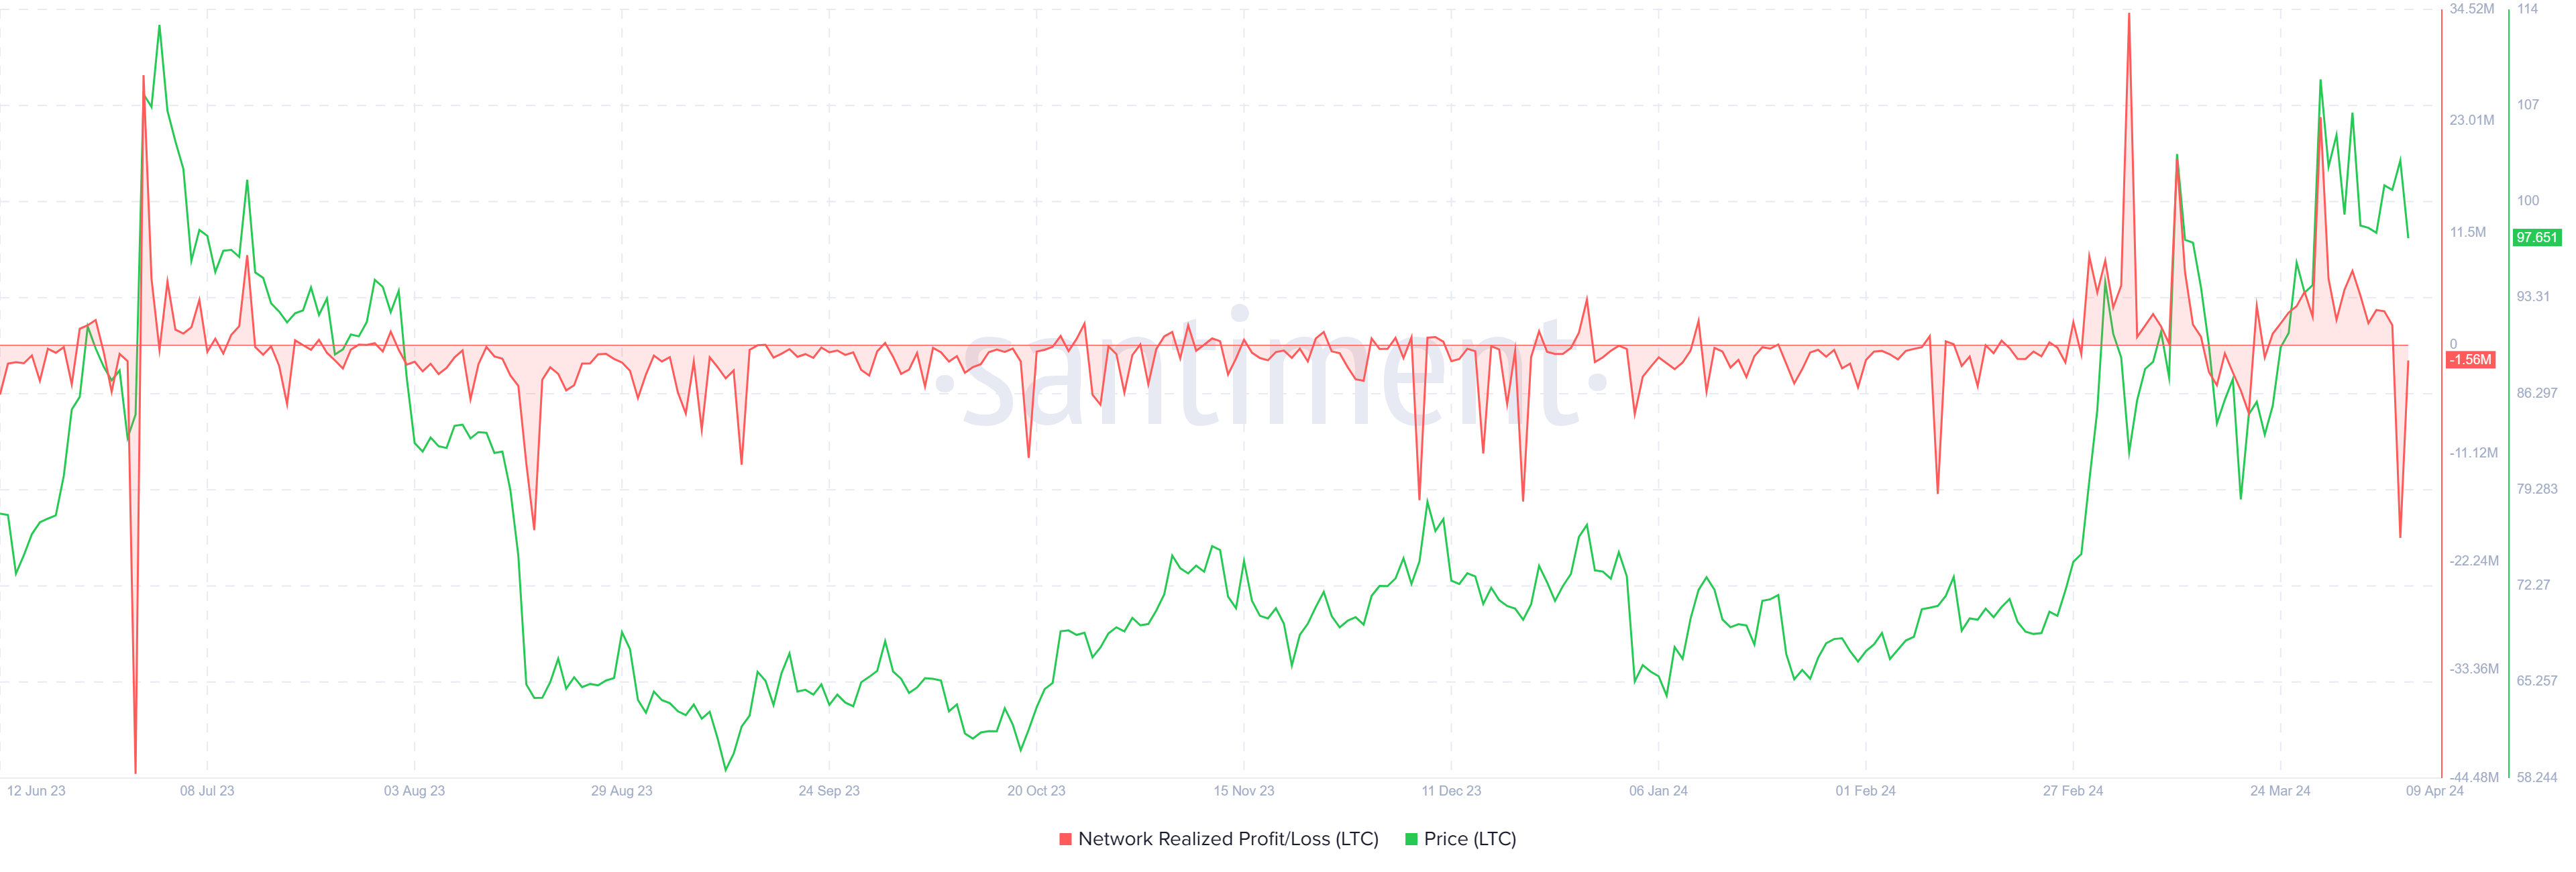
The reason behind this is the lack of incentive among investors. As noted on the Network Realized Profit/Loss metric, LTC holders have observed the largest single-day losses since June 2023.
These losses in the last 24 hours are considered a preliminary signal of potential selling. Since investors want to offset their losses, they will likely opt to sell their assets, resulting in a decline in the price.
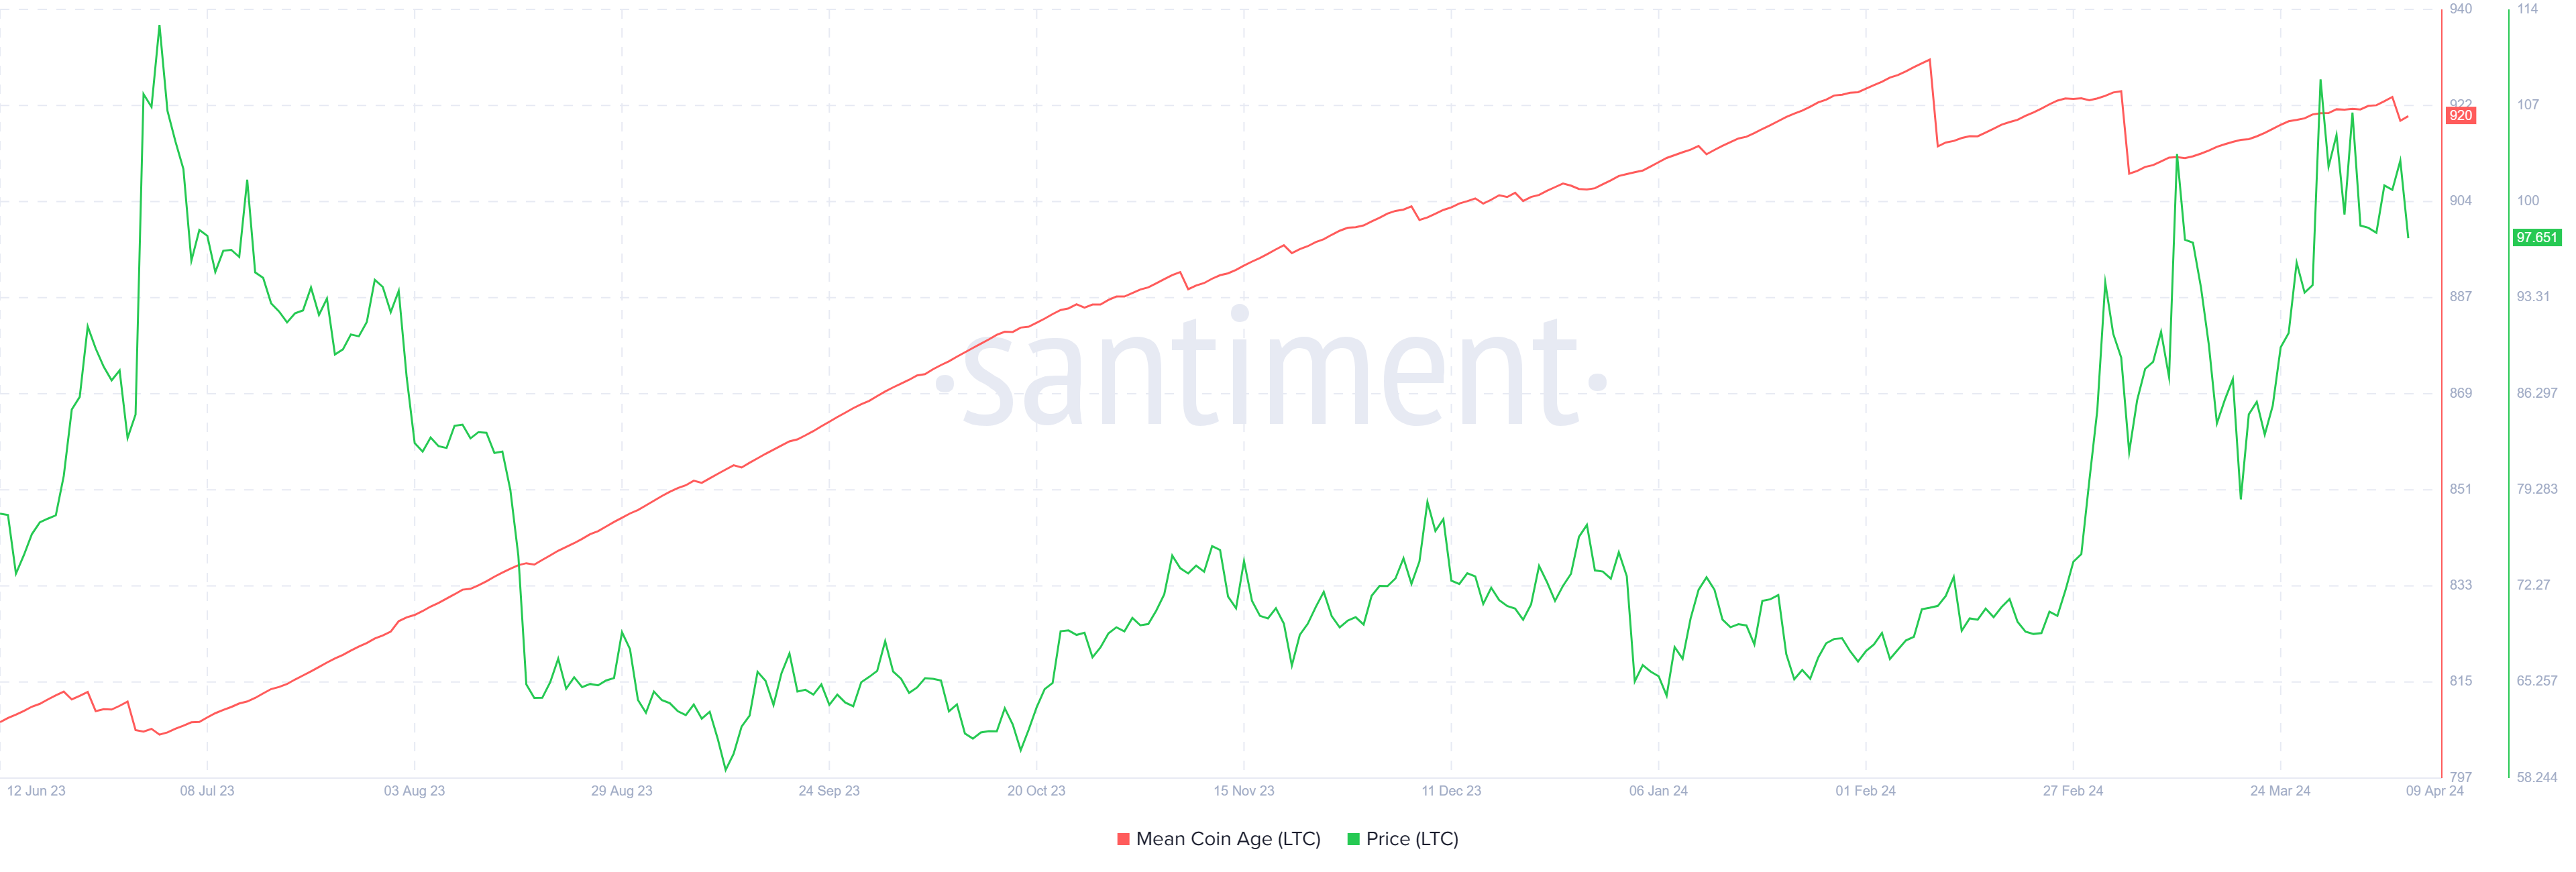
This sentiment is further substantiated by the downtick in the Mean Coin Age of Litecoin tokens. This metric measures the average age of all circulating coins within a network. It helps gauge the level of hodling or circulating activity among investors.
Instances of uptick align with holding on to supply, while downtick suggests an increase in circulation of supply among investors. Thus, without the support of investors, Litecoin’s price could witness a correction.
Read More: 7 Best Litecoin (LTC) Wallets for 2024
LTC Price Prediction: Pullback
Litecoin’s price is currently moving within a rising wedge. This pattern is a bearish formation characterized by converging trendlines slanting upwards, indicating a weakening bullish trend. It typically suggests an impending price reversal with potential downward movement.
Based on the target predicted by the pattern, Litcoin could observe a 30.77% correction over the coming days, bringing its price down to $69. The consistent volume decline further supports the bearish thesis, as Litecoin’s price is already falling through the pattern.
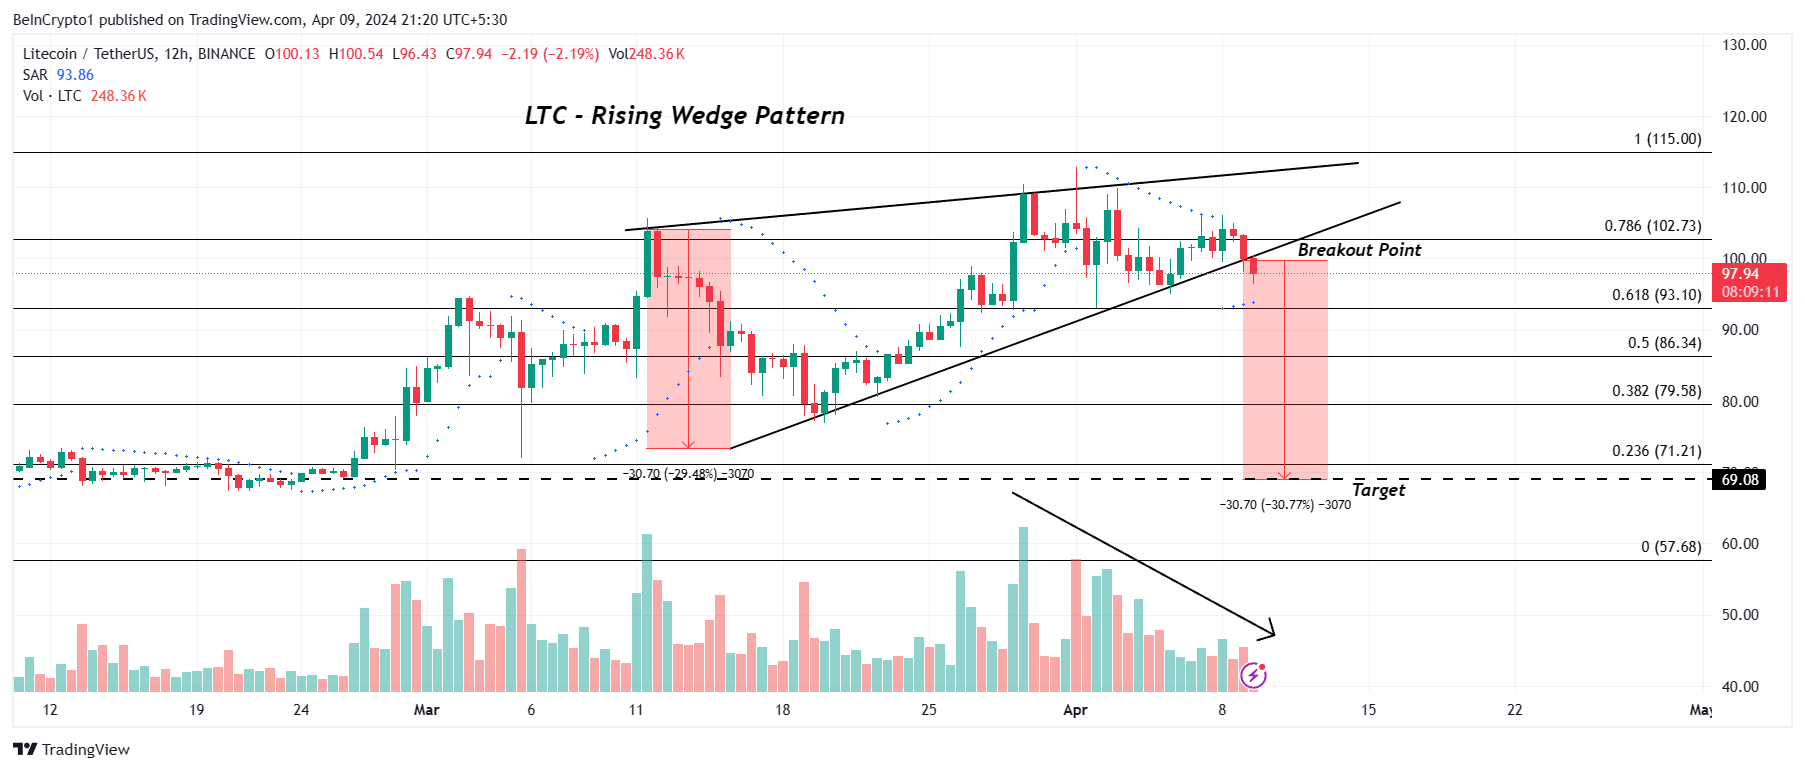
However, LTC is bound to witness support at $93, which marks the 61.8% Fibonacci Retracement. Bouncing off this support floor, marked at $93, would allow the altcoin to reclaim $100 and potentially invalidate the bearish outlook.


