


Litecoin (LTC) has been increasing since completing a bullish pattern on Feb 24 but has yet to confirm whether the trend is bullish or bearish.
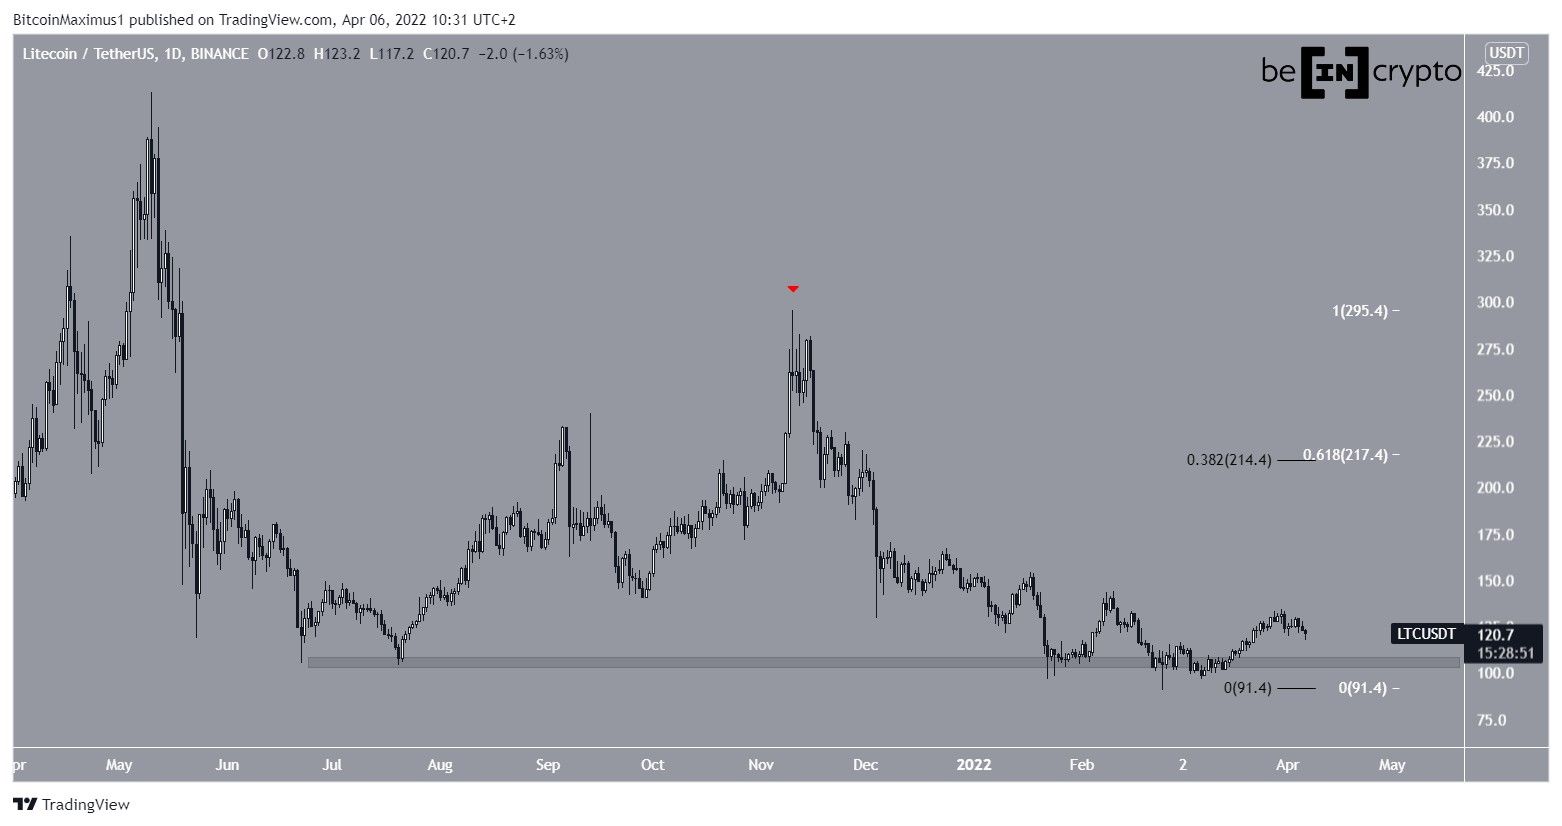
LTC has been falling since May 10, when it reached a high of $414.3. More recently, it created a lower high of $295.7 on Nov 10 (red icon) before resuming its downward movement once more.
So far, the descent has led to a low of $90 on Feb 24.
However, LTC bounced immediately afterward and has been increasing since.
The bounce served to validate the $105 area as support. The area has been in place since June 2021.
If the upward movement continues, there is a crucial resistance at $215. This is the 0.382 long-term Fib retracement resistance (black) and the 0.618 short-term Fib resistance (white).
Triple bottom pattern
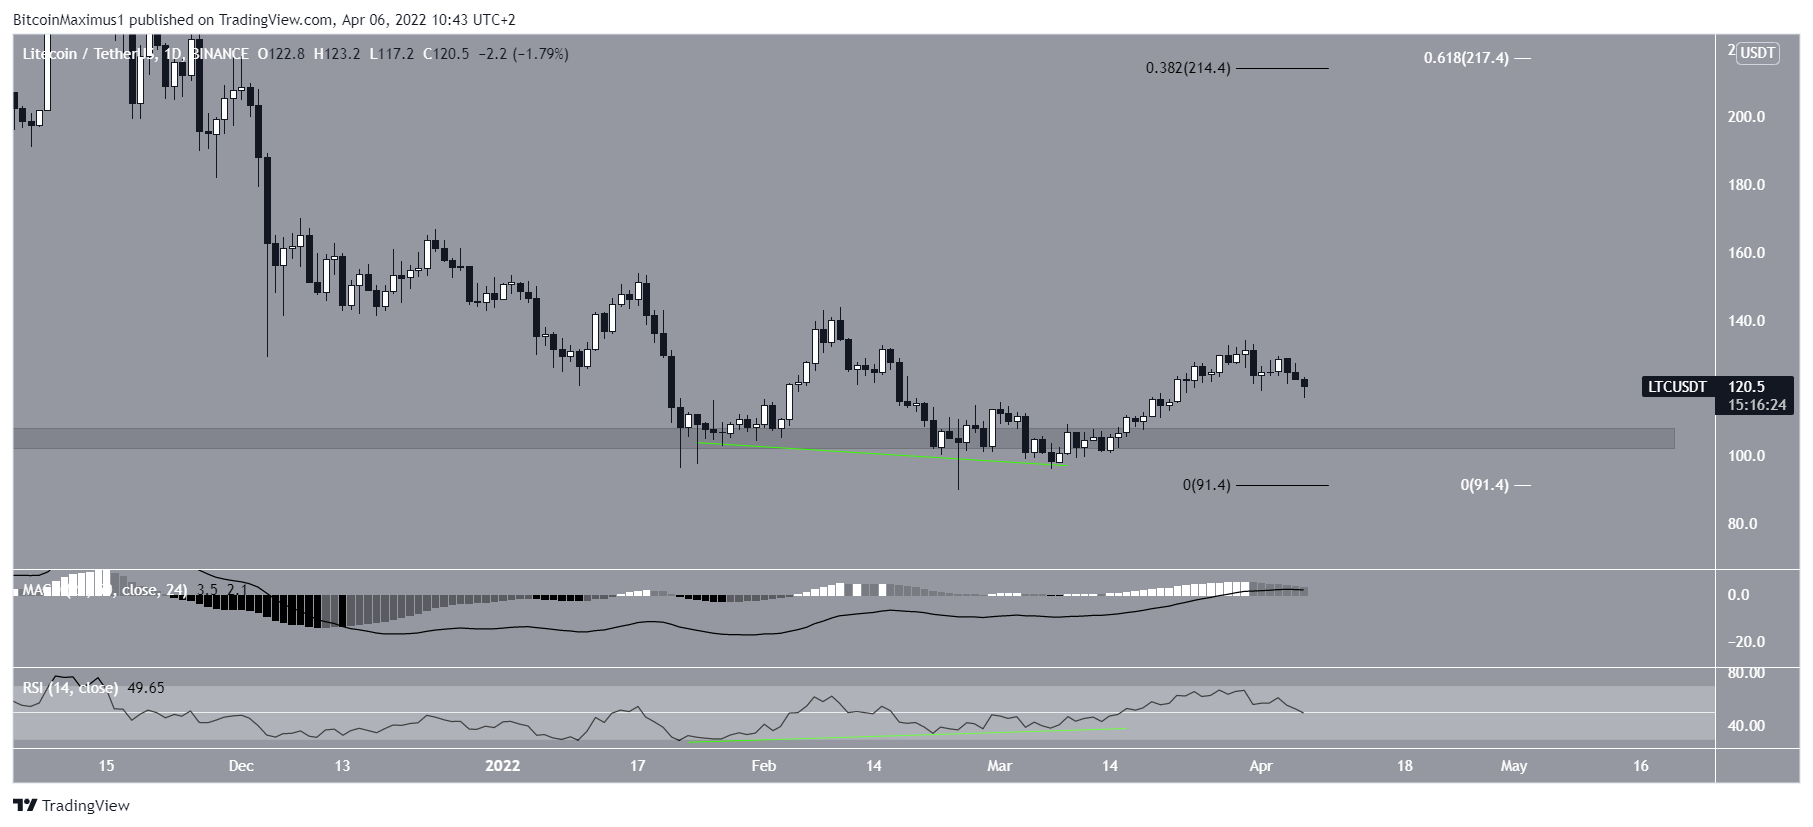
A closer look at the daily movement shows that LTC has created a triple bottom, which is considered a bullish pattern.
In addition to this, the pattern was combined with bullish divergences in both the RSI and MACD (green lines). Such divergences usually precede bullish trend reversals, as was the case in LTC.
However, both indicators are now at make-or-break levels for their bullish structures. The MACD is approaching the 0 line from above while the RSI is at risk of breaking down below 50. Whether these descents continue or a bounce transpires will likely determine if the trend is bullish or bearish.
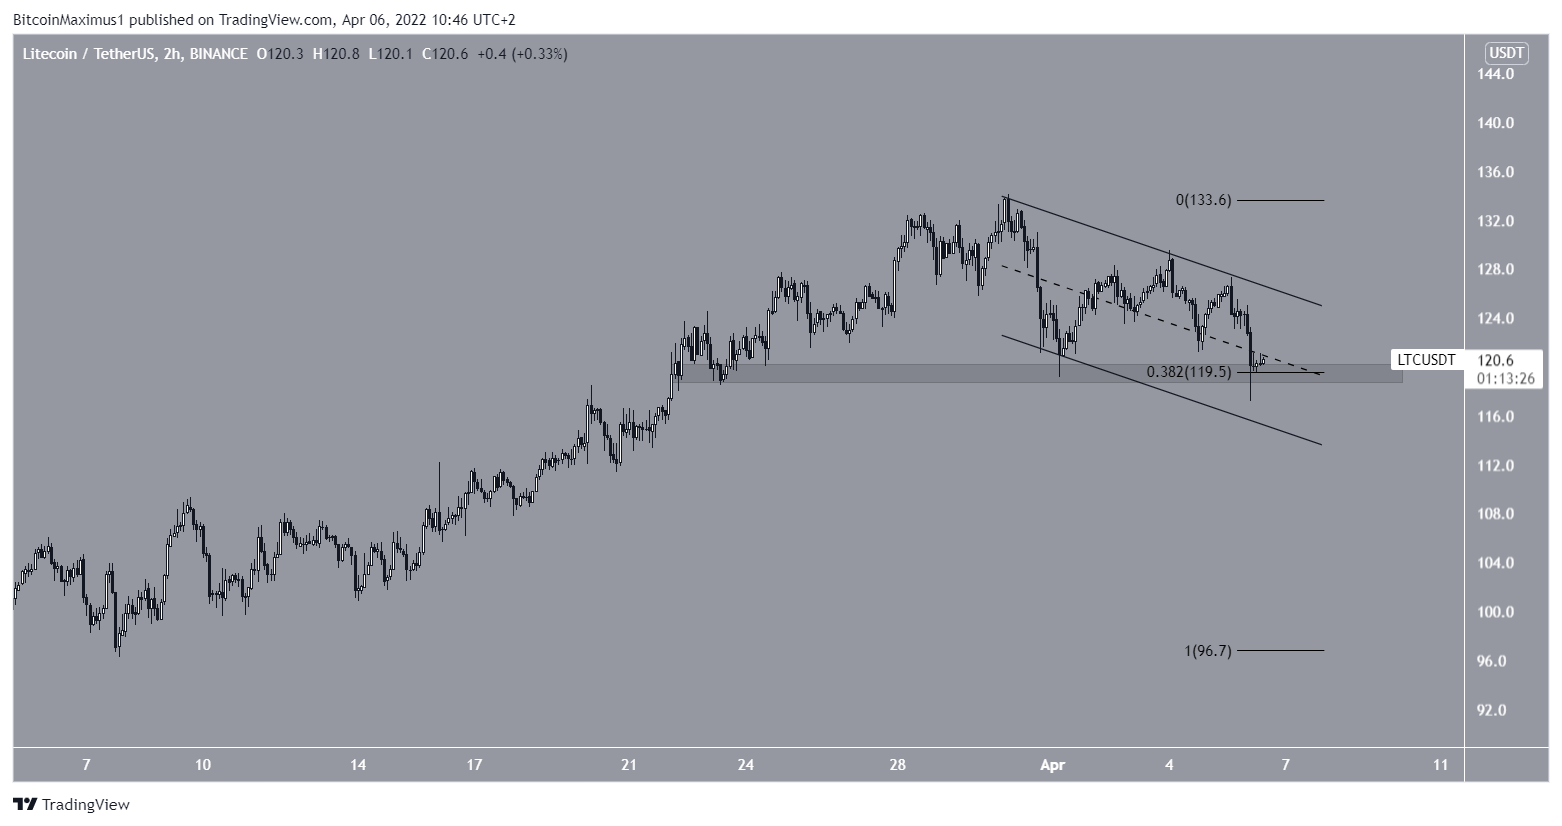
The two-hour chart shows that LTC is trading inside a descending parallel channel. Additionally, it has bounced at the $120 support, which is both a horizontal support area and the 0.382 Fib retracement support channel.
Due to the confluence of these support levels and the fact that parallel channels are usually corrective patterns, a breakout from this channel seems to be the most likely scenario.
LTC/BTC
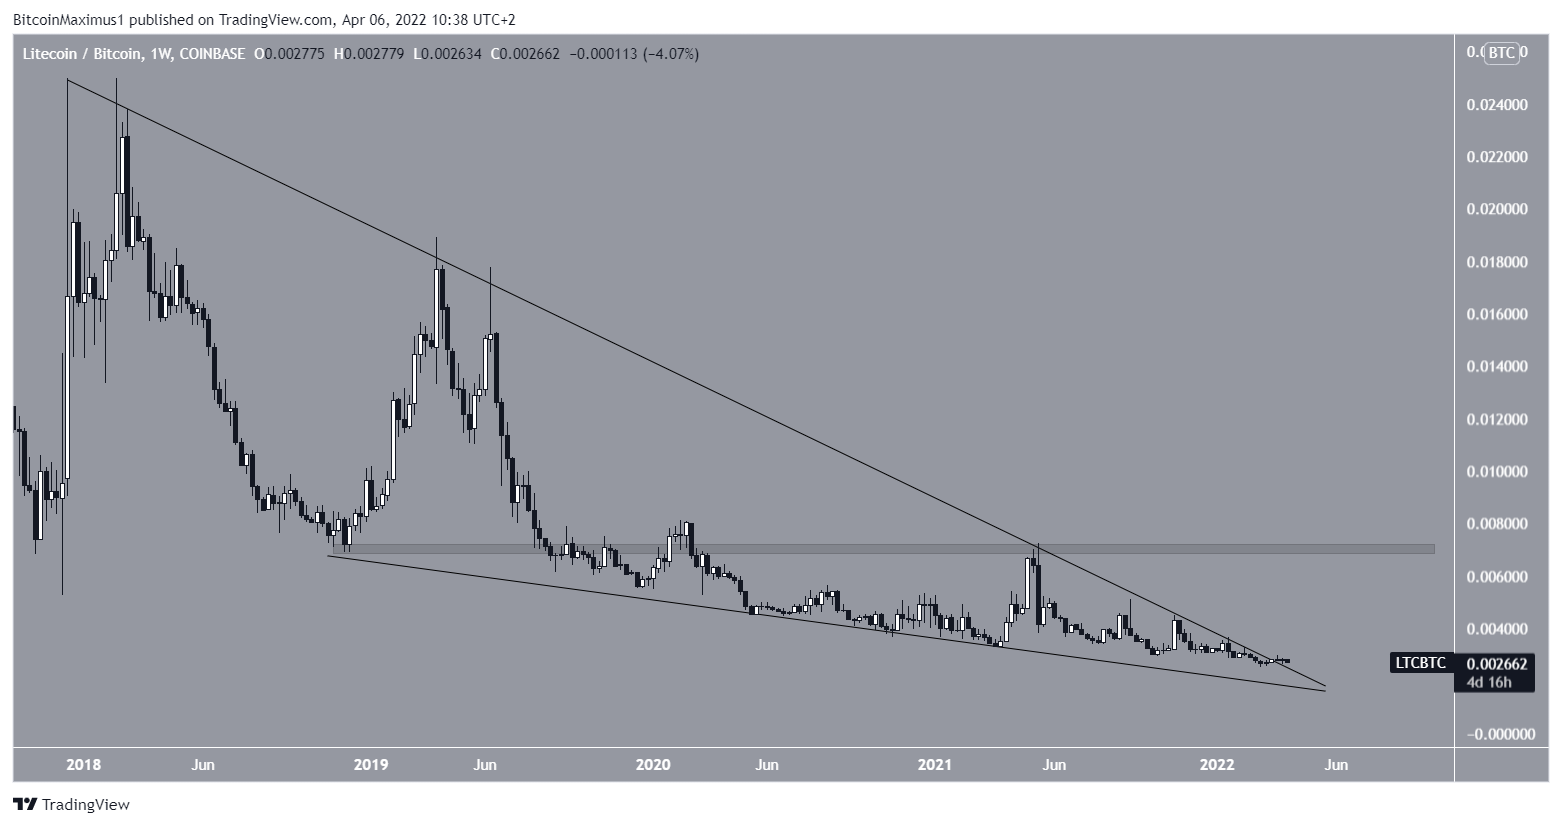
Cryptocurrency trader @Mesawine1 tweeted a chart of LTC, stating that the price has broken out from a long-term descending wedge.
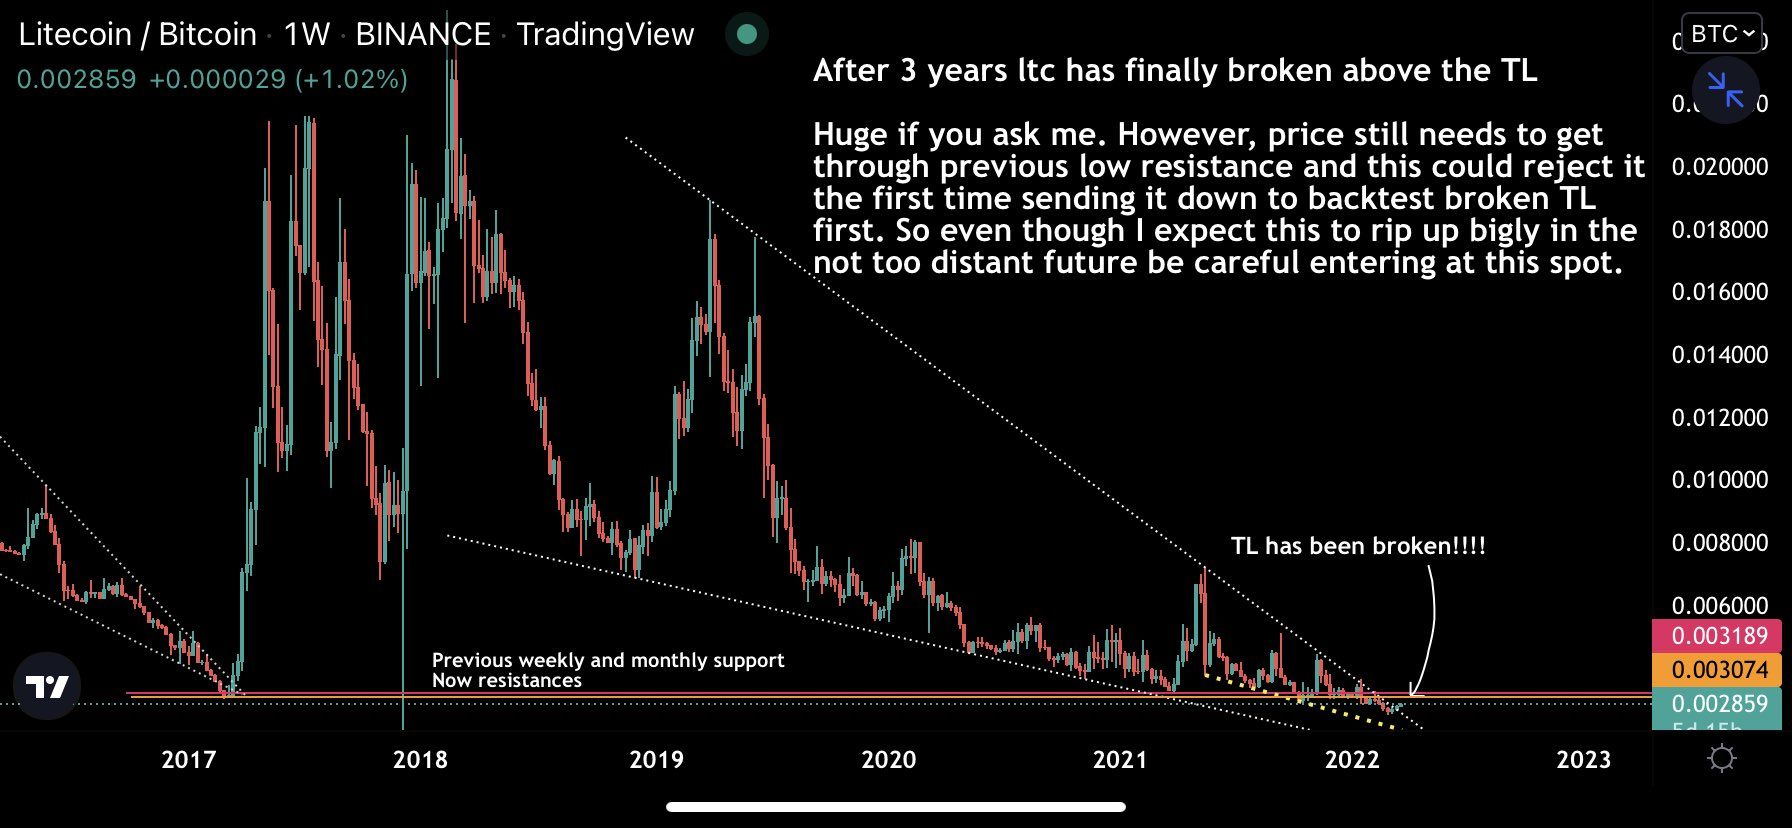
The LTC/BTC chart shows that the price has potentially broken out from a descending wedge, which had previously been in place since the beginning of 2018.
This is considered a bullish development since breakouts from such long-term patterns usually lead to sustained upward movements.
However, LTC has yet to begin moving upwards, casting some doubt on the validity of the breakout.
The closest resistance area is at ₿0.007.
For BeInCrypto’s latest Bitcoin (BTC) analysis, click here


