The Litecoin (LTC) price has been decreasing since it reached a high of $185 on Jan. 10.
The short and long-term time-frames suggest that LTC is still correcting, having not yet reached a low.
Litecoin Drops After Rejection
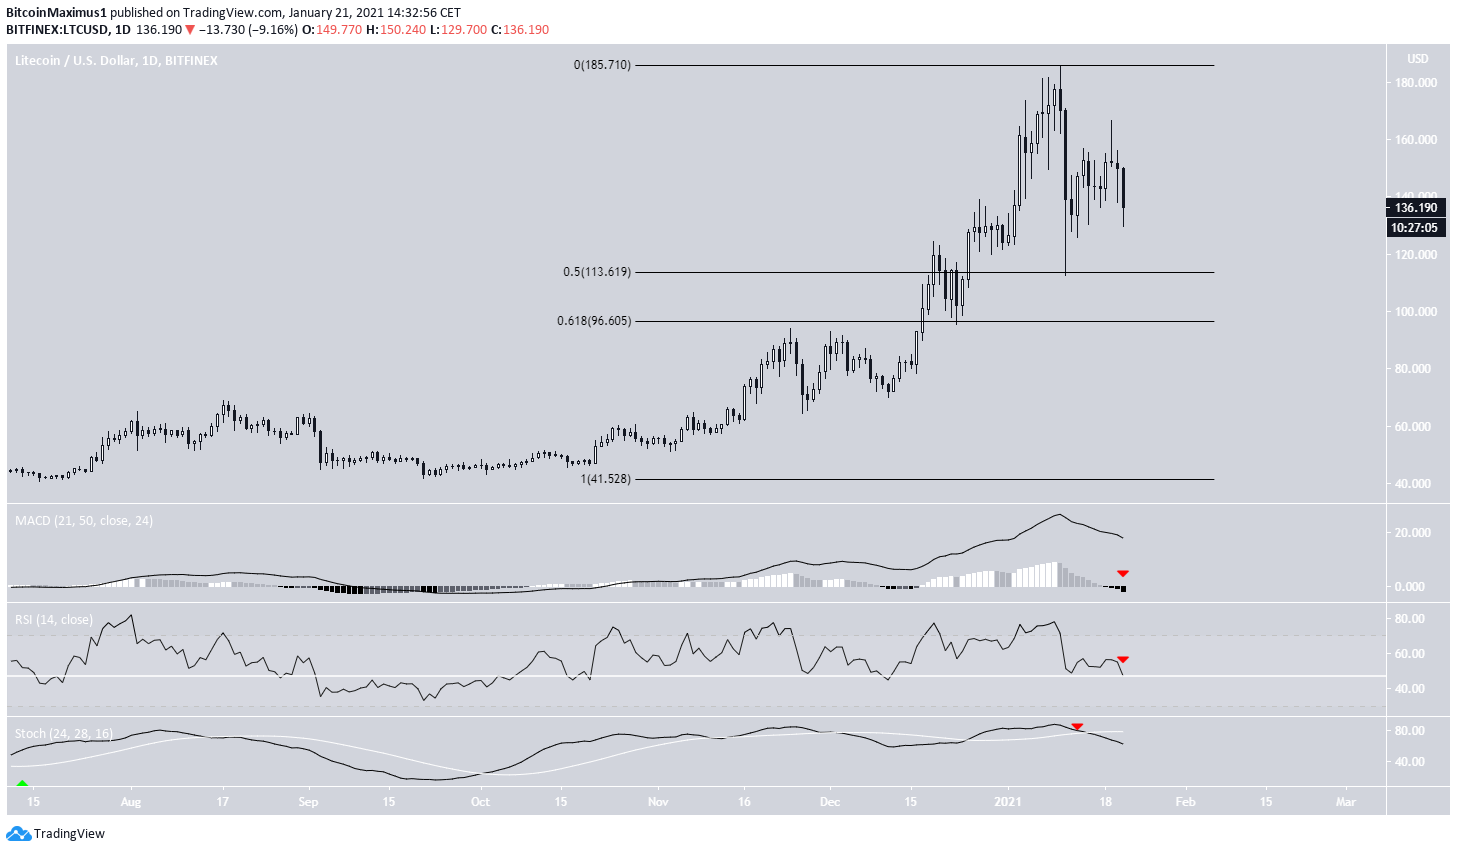
LTC has been moving downward since Jan. 10, when it reached a high of $185. LTC dropped sharply the following day but gradually moved upwards before another drop on Jan. 21.
Technical indicators are decisively bearish since the MACD has crossed into negative territory, the Stochastic Oscillator has made a bearish cross, and the RSI has dropped below 50.
If LTC continues falling, the closest support areas are $113 and $96, the 0.5 and 0.618 Fib retracement levels of the entire upward movement beginning from Sept. 2020. This is the portion of the move that hasn’t yet retraced.
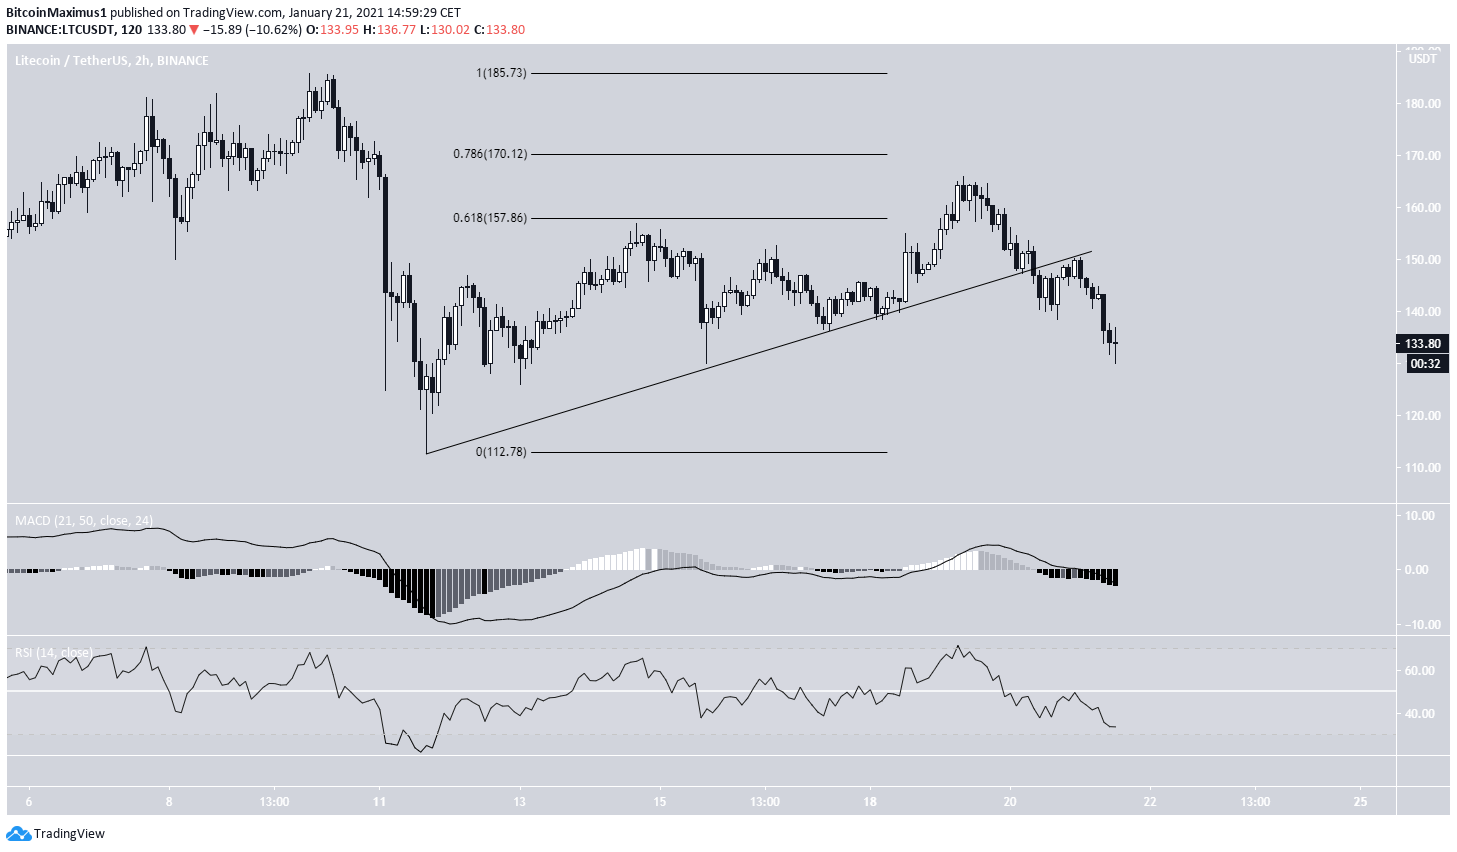
The shorter-term chart supports the continuation of the downward move since it shows a breakdown from an ascending support line and then validating it as resistance.
This move occurred after a rejection at the 0.618-0.786 Fib retracement area, common in corrections. Technical indicators are also bearish, suggesting that LTC is likely to test the $112 region and possibly go lower.
LTC Wave Count
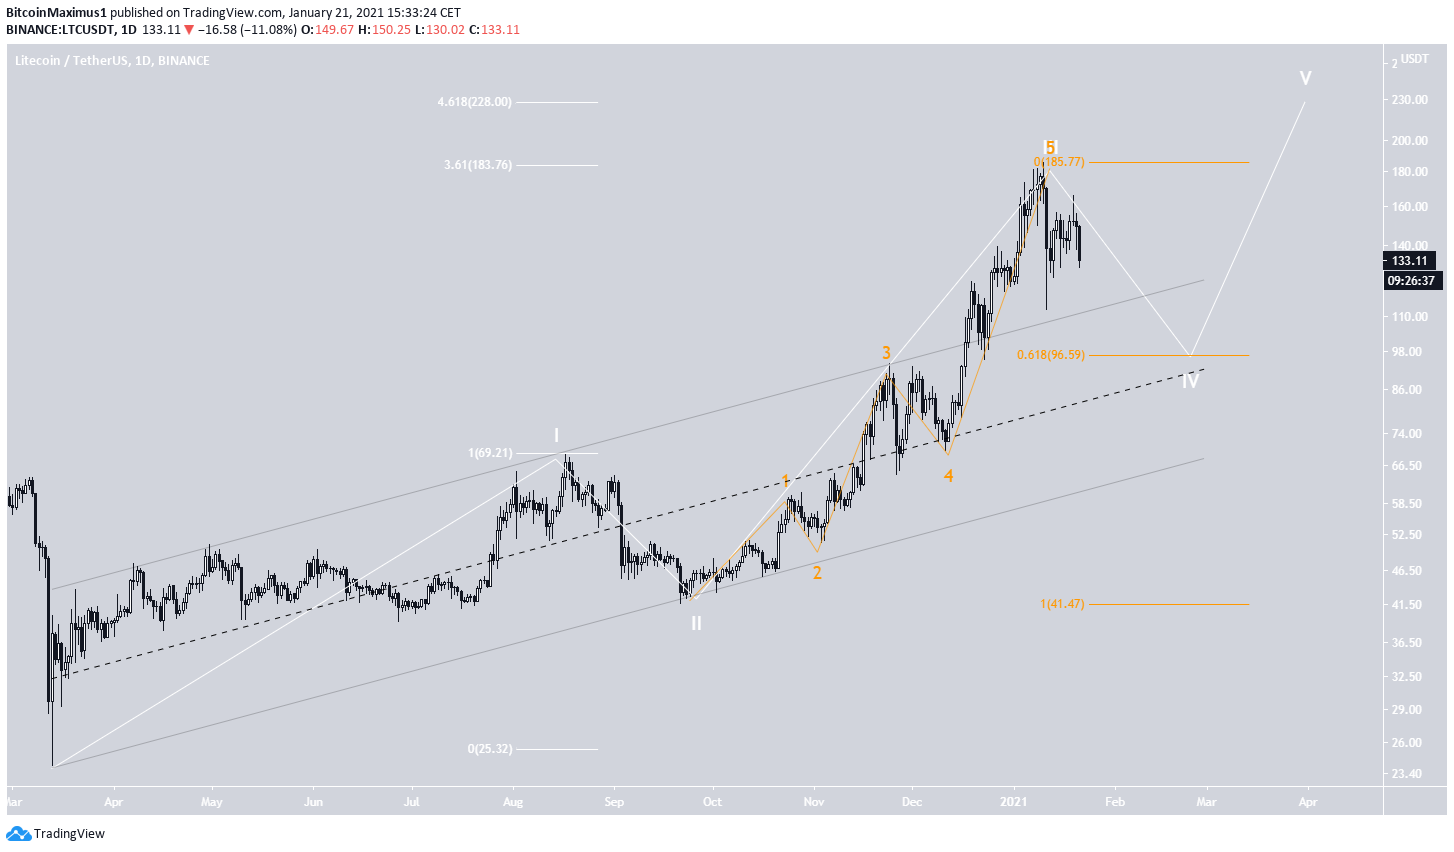
The wave count suggests that LTC completed wave 3 with the previous $185 high (shown in white below). This is part of a bullish impulse that began in March. The sub-wave count is shown in orange.
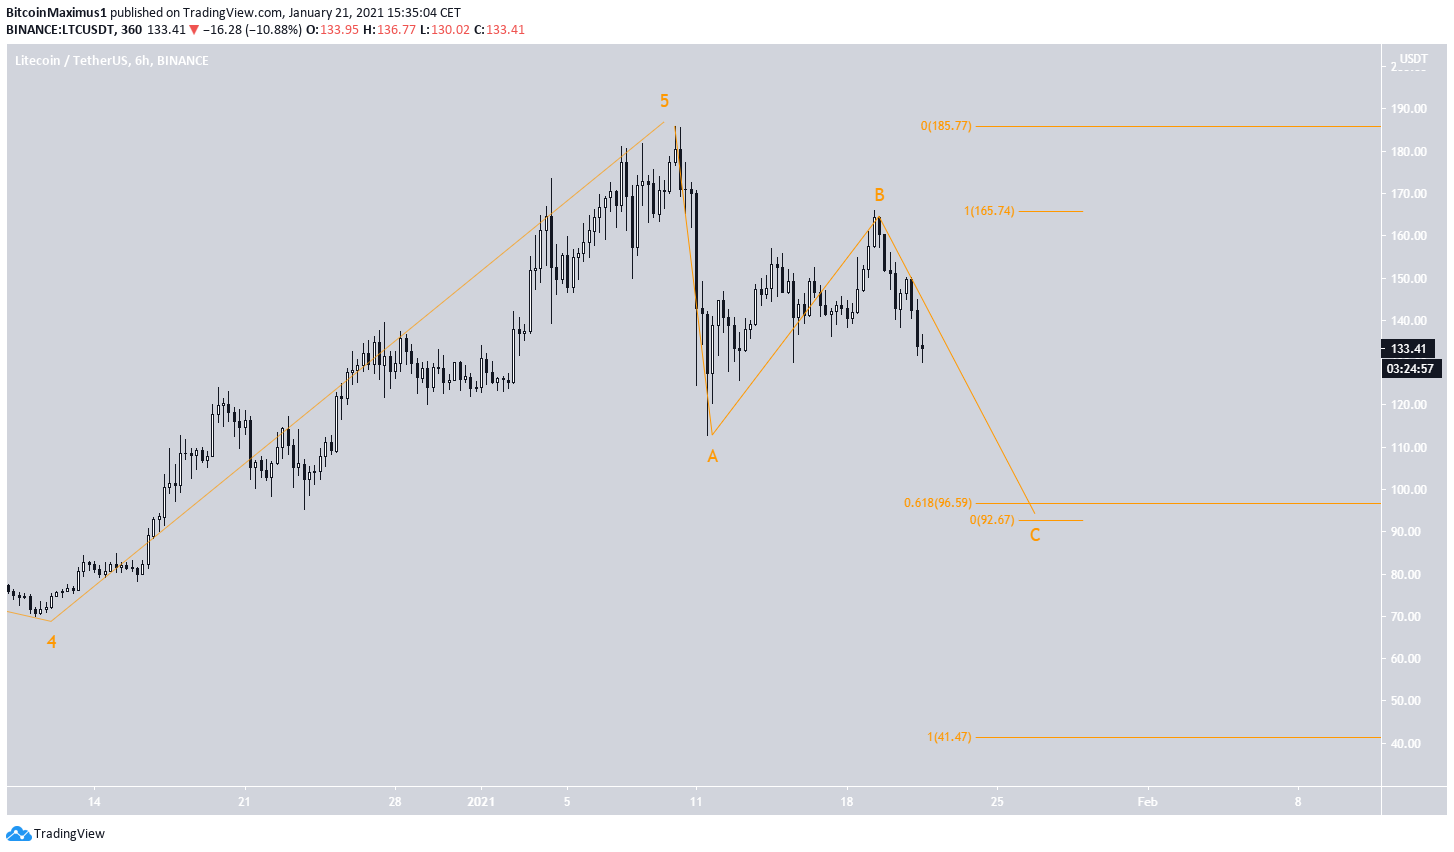
Currently, LTC is in wave 4, which should end at one of the previous support levels at $113 and $96, respectively. The latter would complete a fourth wave pullback.
The shorter-term chart supports a drop towards $96 since that would give waves A:C a 1:1 ratio, making this the most likely target for the bottom of the move.
LTC/BTC
Cryptocurrency trader @Damskotrades outlined an LTC/BTC chart, stating that the price is close to its all-time lows and could eventually begin a significant upward movement.
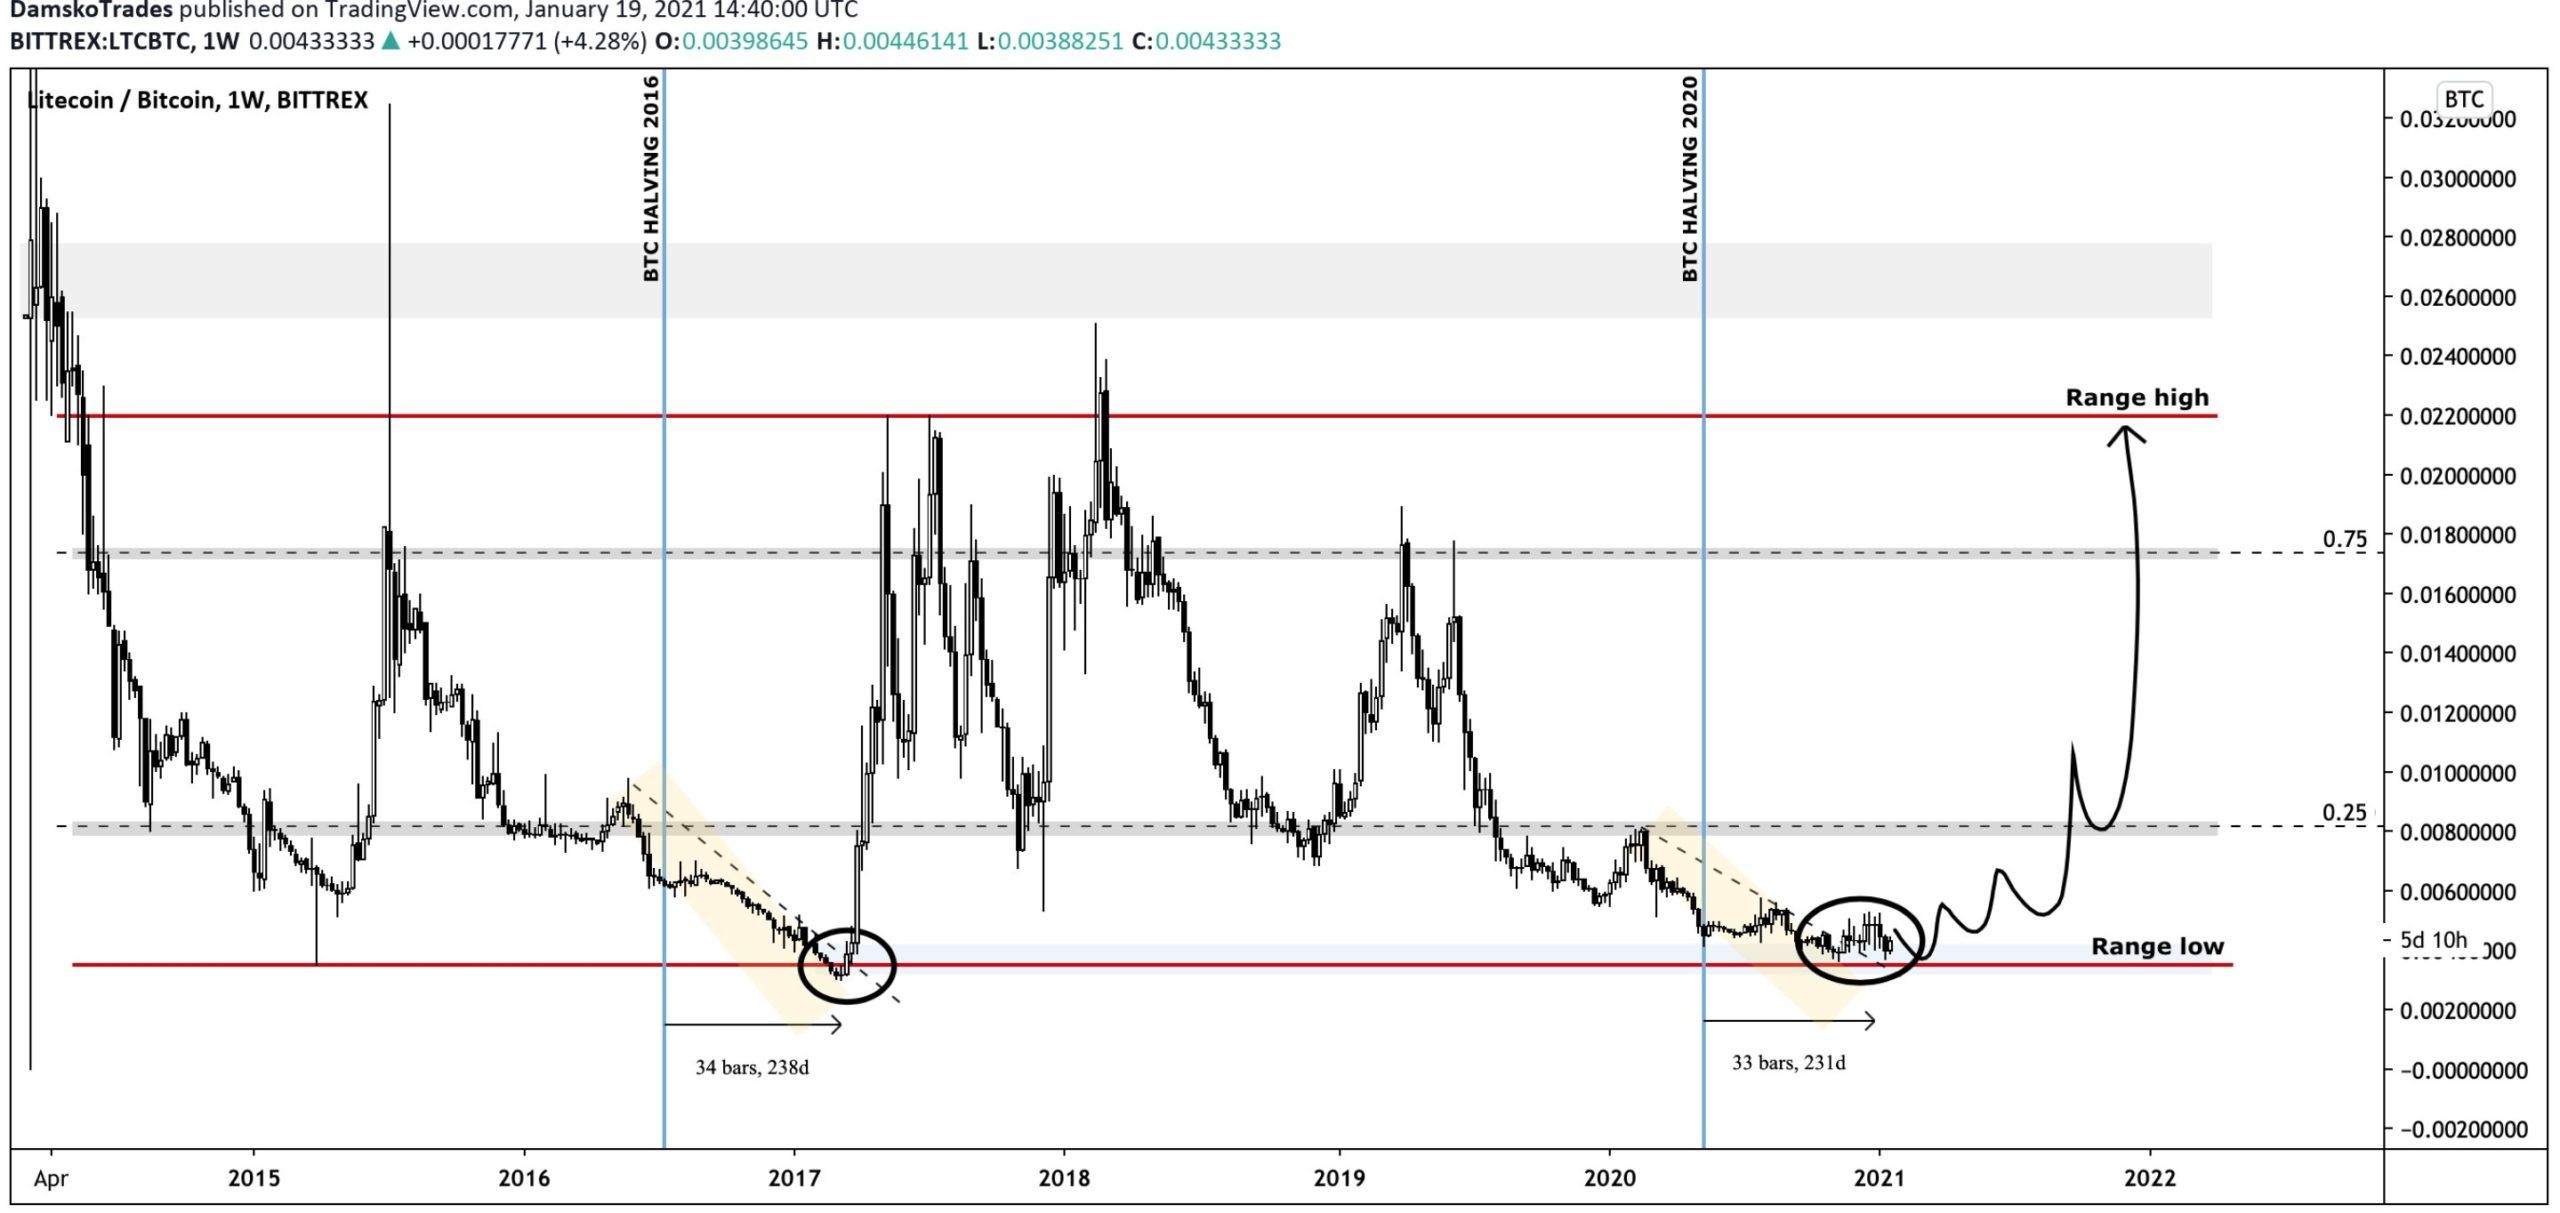
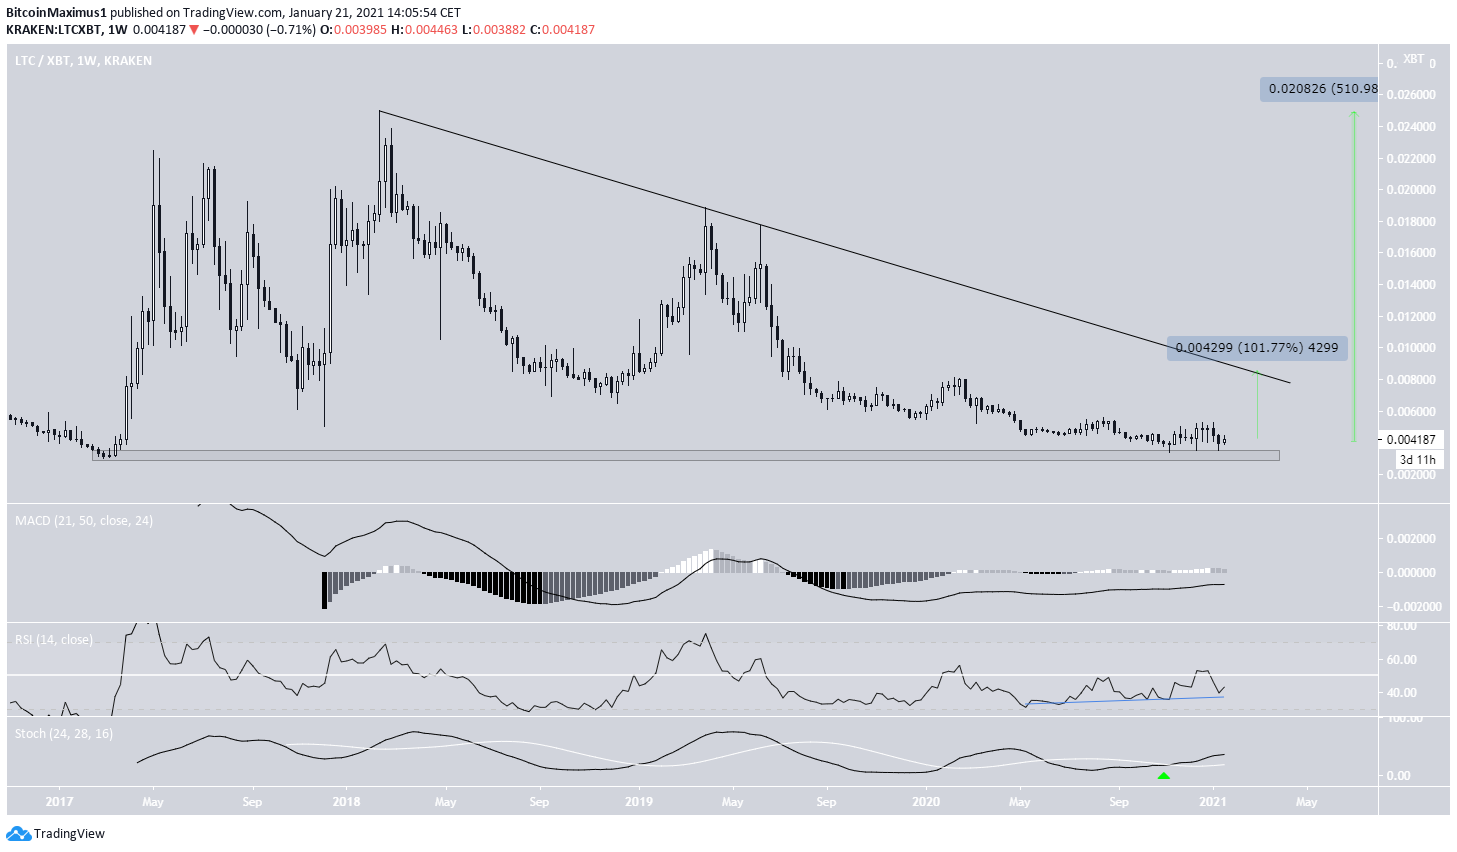
The LTC/BTC pair has been following a descending resistance line since reaching an all-time high in 2018. It has made three unsuccessful attempts to break out, occurring between April and May 2019.
Since then, it hasn’t come close to the descending resistance line. However, LTC has bounced near the all-time low support area of ₿0.004 and initiated a slight upward movement.
Technical indicators are also bullish, supporting the possibility of an LTC/BTC upward move. A rally that takes it to the resistance line would amount to 100%, while one that takes it to an all-time high would be a move of around 510%.
Conclusion
To conclude, LTC is likely still correcting and should continue doing so until $112 and possibly $96. LTC/BTC is close to an all-time low price and could soon begin a long-term bullish cycle.
For BeInCrypto’s latest Bitcoin (BTC) analysis, click here!
Disclaimer
In line with the Trust Project guidelines, this price analysis article is for informational purposes only and should not be considered financial or investment advice. BeInCrypto is committed to accurate, unbiased reporting, but market conditions are subject to change without notice. Always conduct your own research and consult with a professional before making any financial decisions. Please note that our Terms and Conditions, Privacy Policy, and Disclaimers have been updated.

