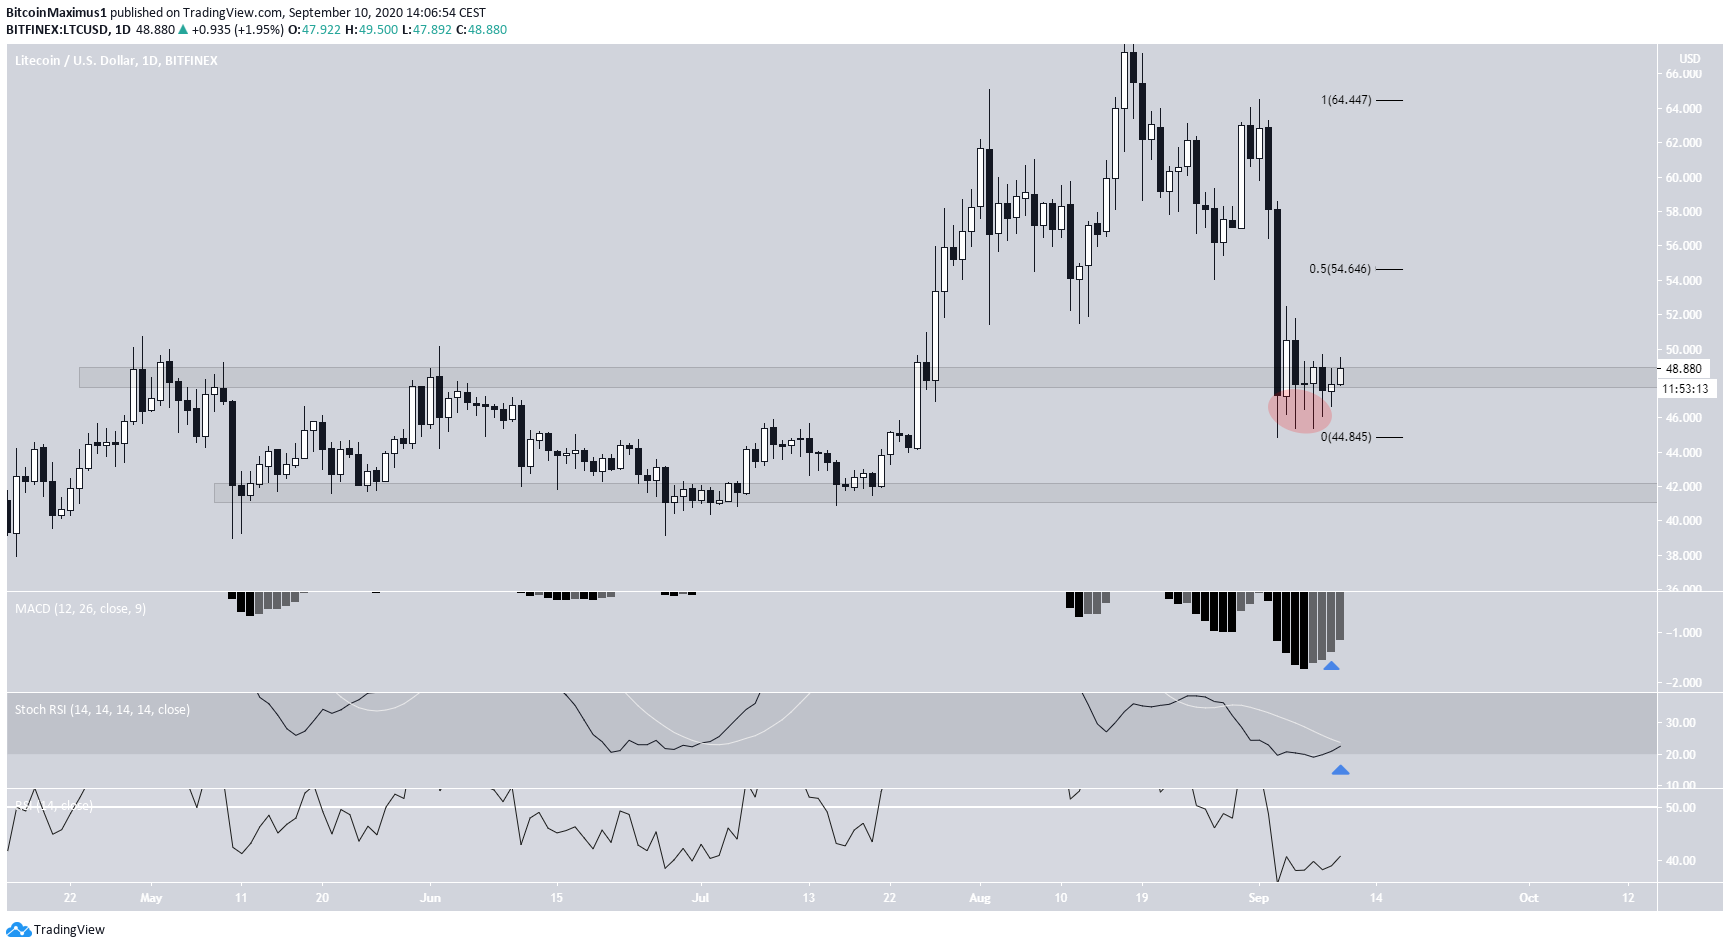
Despite the rapid decline on September 2, the long-term bullish structure for Litecoin (LTC) is still intact. As long as the price is trading above the $42 support area, the possibility of bullish continuation remains valid.
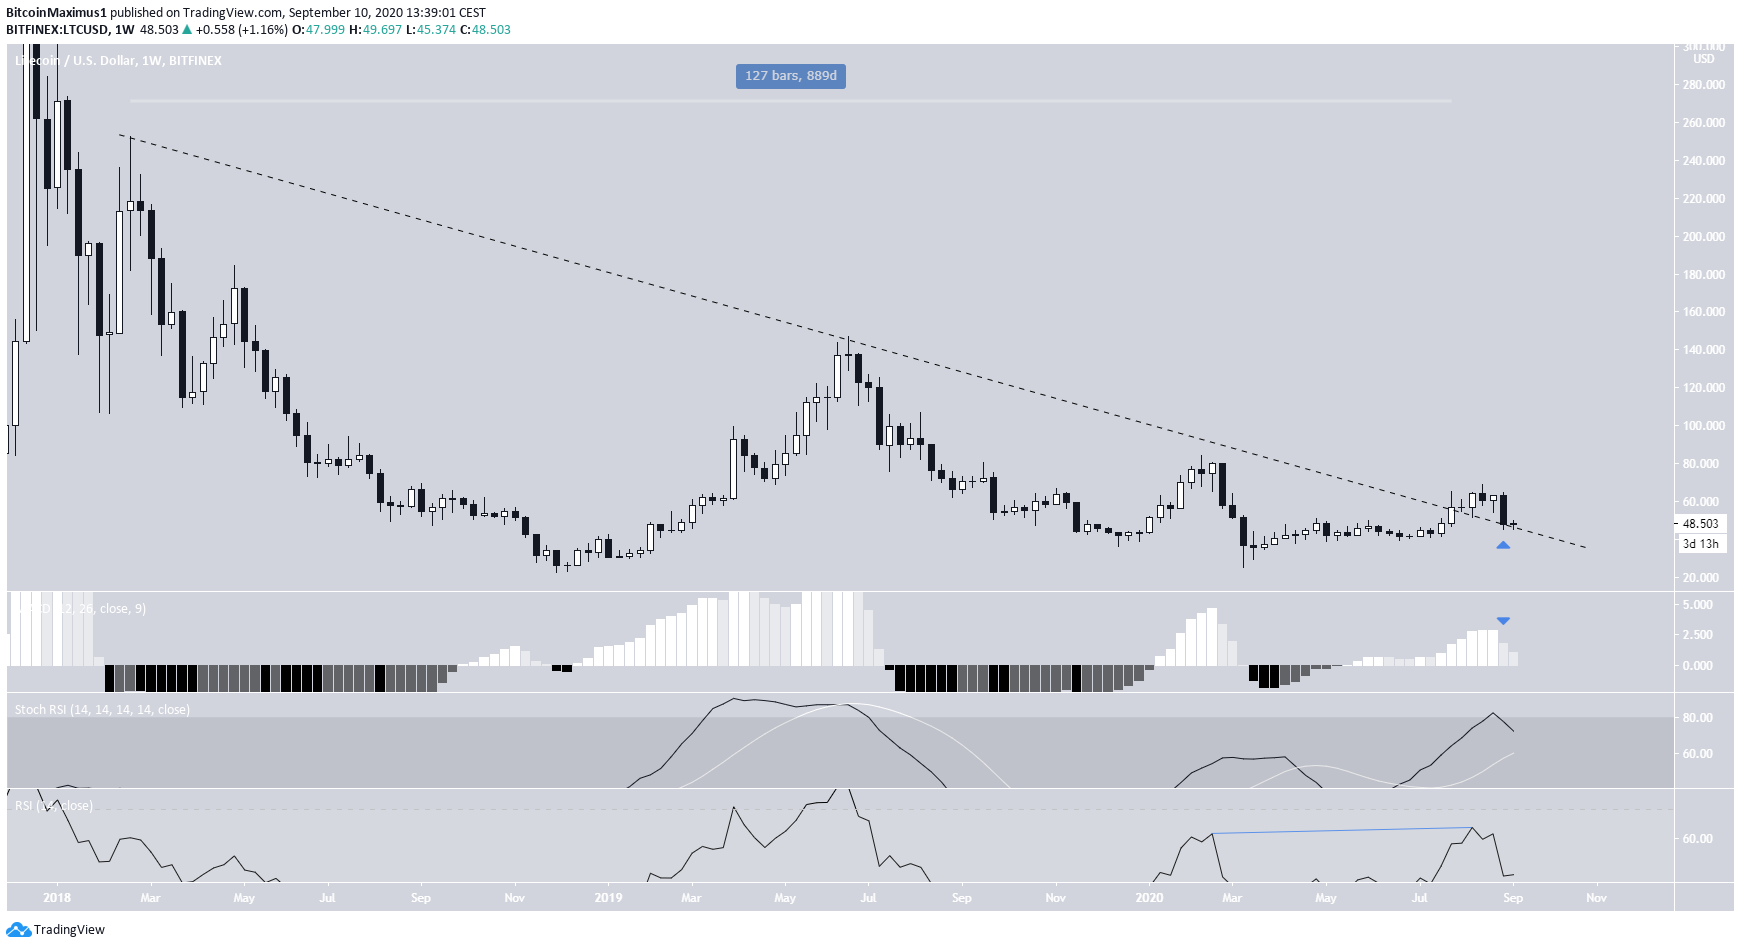
Breakout From Long-Term Resistance
At the beginning of August, the Litecoin price broke out from a descending resistance line that had been in place for 889 days. Afterward, the price validated the same line as support. This is a bullish sign in the long-term since a bearish structure in place for nearly three years has been broken.
However, technical indicators are not bullish. There is a hidden bearish divergence on the weekly RSI, and both the stochastic RSI and MACD are rolling over.
Possible LTC Bounce
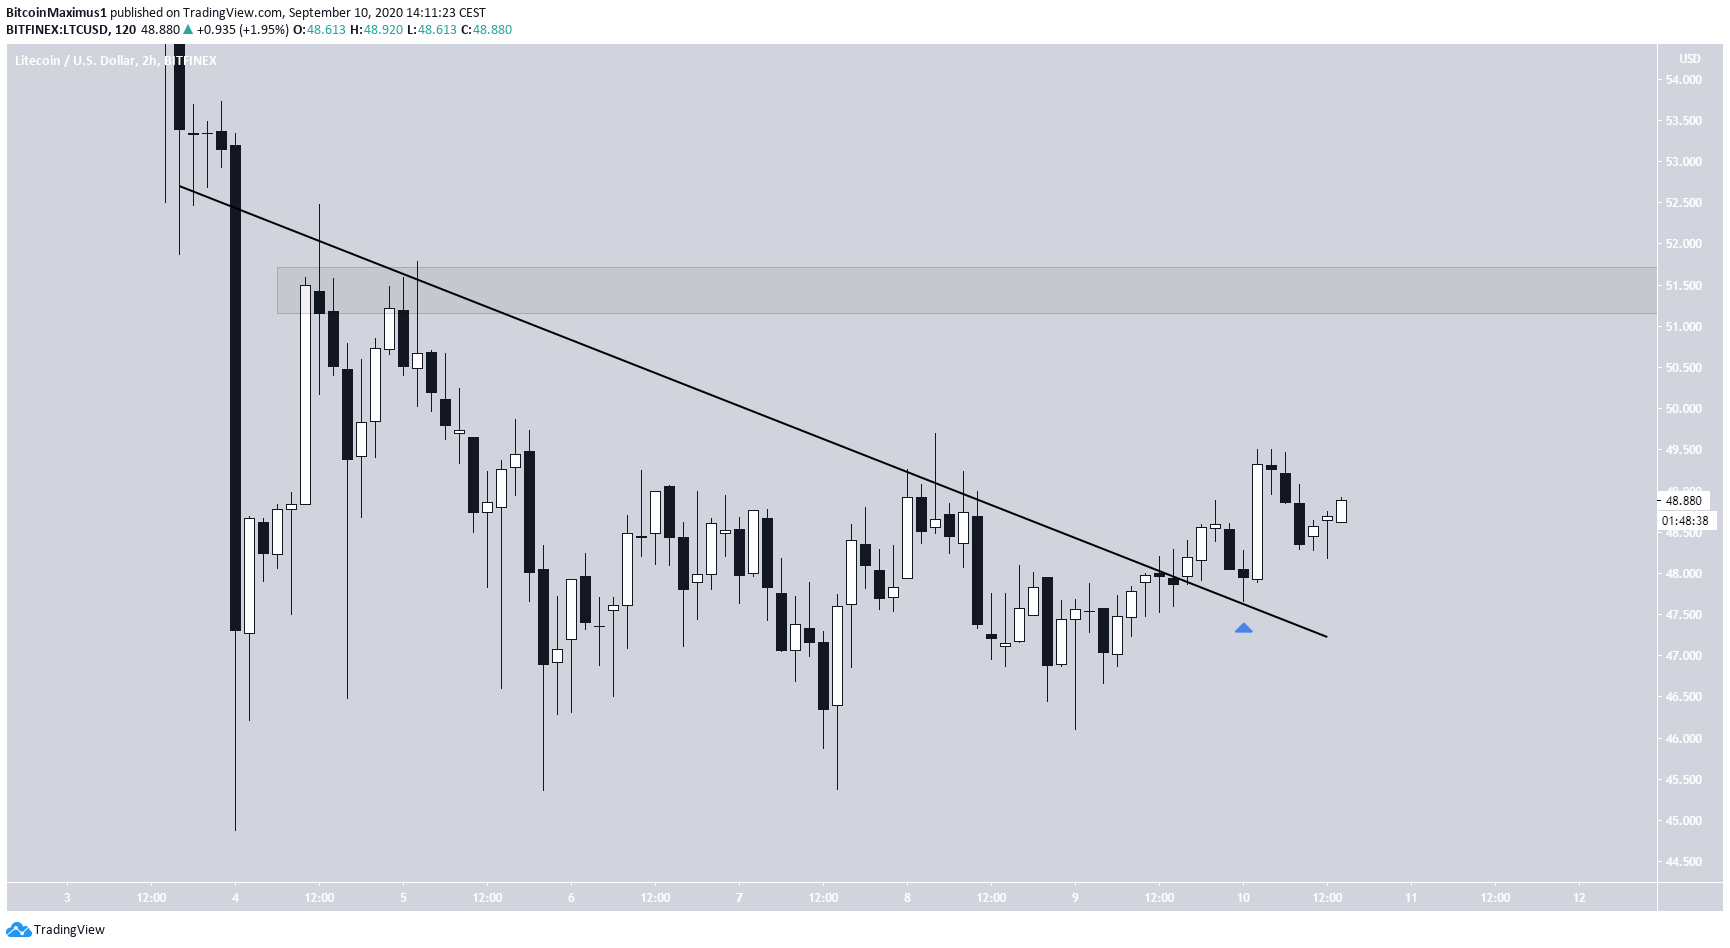
The daily chart supports the possibility of a bounce. Litecoin has been trading very close to the $48 area, which previously acted as the range high. While the price has deviated below these lows, it’s in the process of reclaiming the area as support.
If it does so successfully, it could rally to at least $54, the 0.5 Fib level of the previous decline.
Technical indicators support a bounce. The Stochastic RSI is in the process of making a bullish cross, and the MACD is also increasing. A continued rally would give a bullish reversal signal. However, there is no bullish divergence on the RSI.
Cryptocurrency trader @glowto1994 shared a similar thought, outlining an increase above $50, which would complete the current upwards correction, followed by another downward movement.
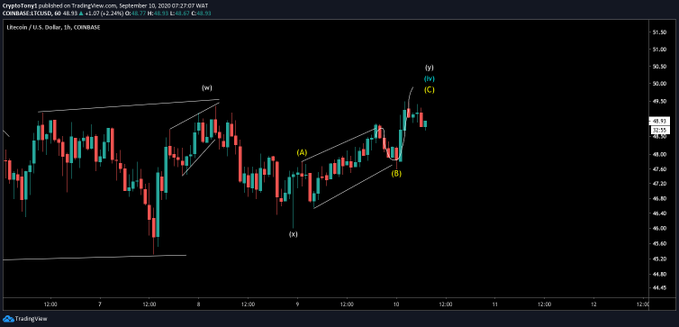
The rise is also supported by the breakout and re-test of the short-term descending resistance line. On the hourly chart, the closest resistance area is found at $52.
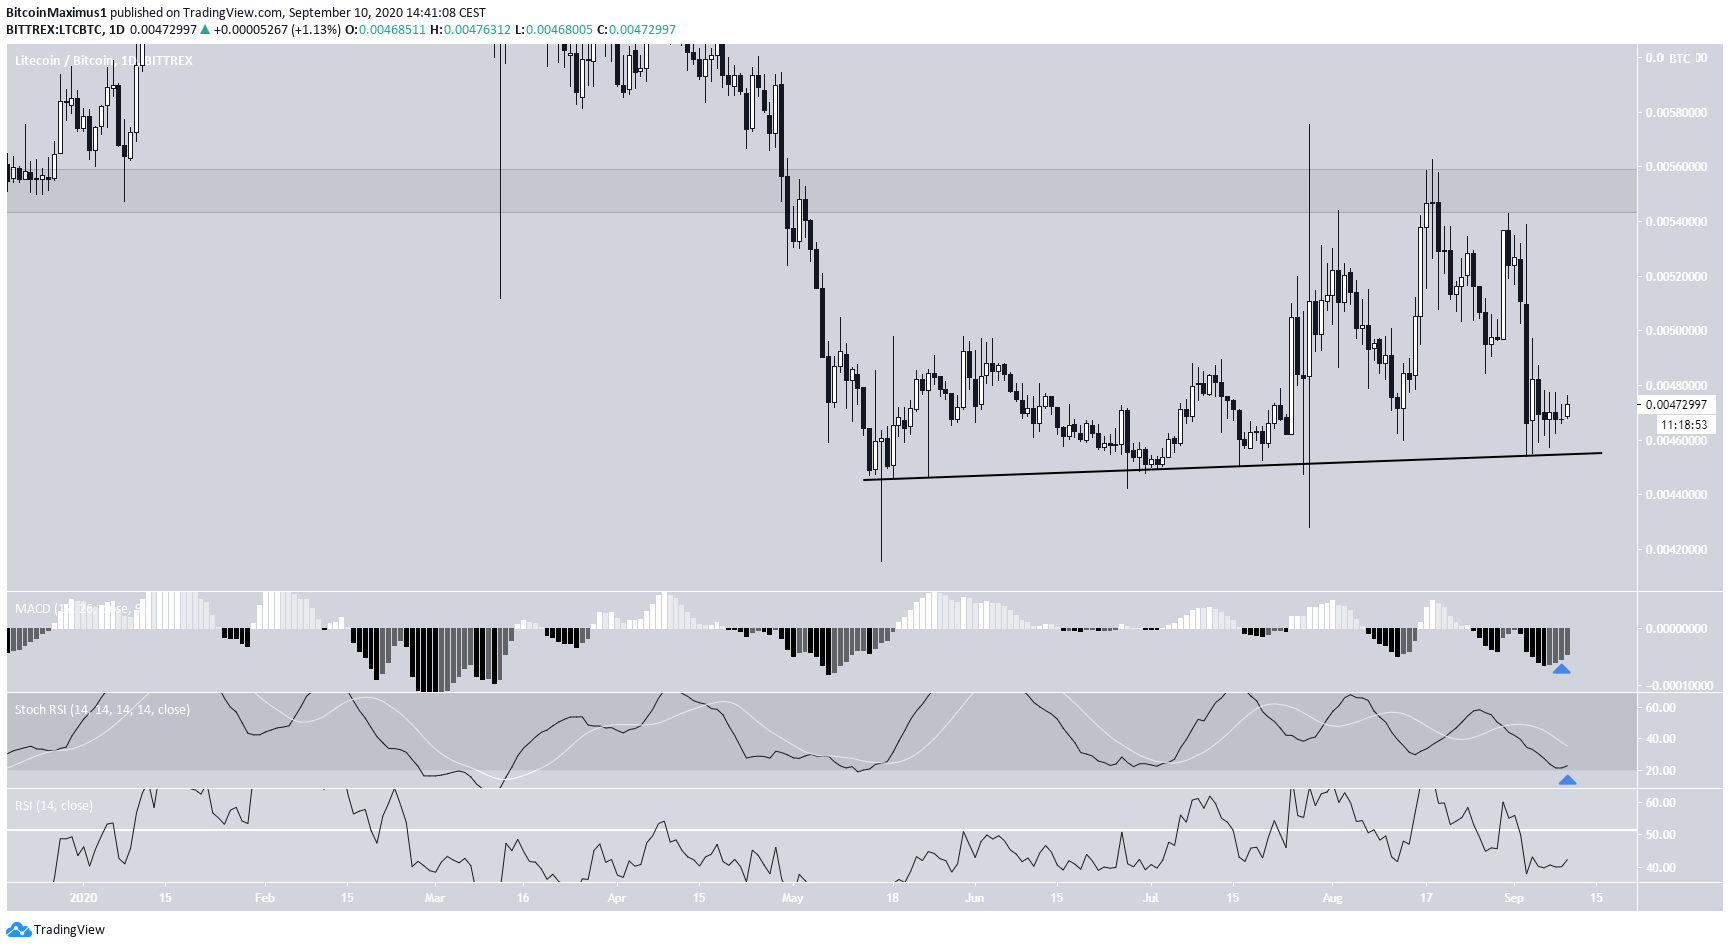
LTC/BTC
The LTC/BTC chart is similarly undecided. The price has been rejected by the long-term resistance area at ₿0.0055 and has been decreasing since.
However, the bullish structure is still intact, since the price has been following an ascending support line since the middle of May.
Technical indicators are neutral, leaning bullish. Both the MACD and the Stochastic RSI are moving upwards, but the latter has not made a bullish cross. The RSI is neutral.
Until the price either breaks out above the resistance area or breaks down from the ascending support line, the direction of the trend is not clear.