On July 25, the Litecoin (LTC) price broke out from a descending resistance line and has been increasing at an accelerated rate since.
This is a sign that the price has begun a bullish trend and could continue increasing towards the resistance areas outlined below.
Litecoin’s Breakout
The Litecoin price has been following a descending resistance line since April 30, when it reached a high of $50.73. On July 25, the price broke out from this line and has rallied considerably since.
Besides the descending resistance line, LTC also broke out above the $49 area, created by the April 30 highs. This area should act as support in the future. Furthermore, the same area is supported by the 200-day moving average (MA), above which the price is also trading.
Other technical indicators are also bullish. While the RSI is overbought, it has not formed any bearish divergence and is still going up. The momentum of the MACD is also growing.
The closest resistance area is found at $64.
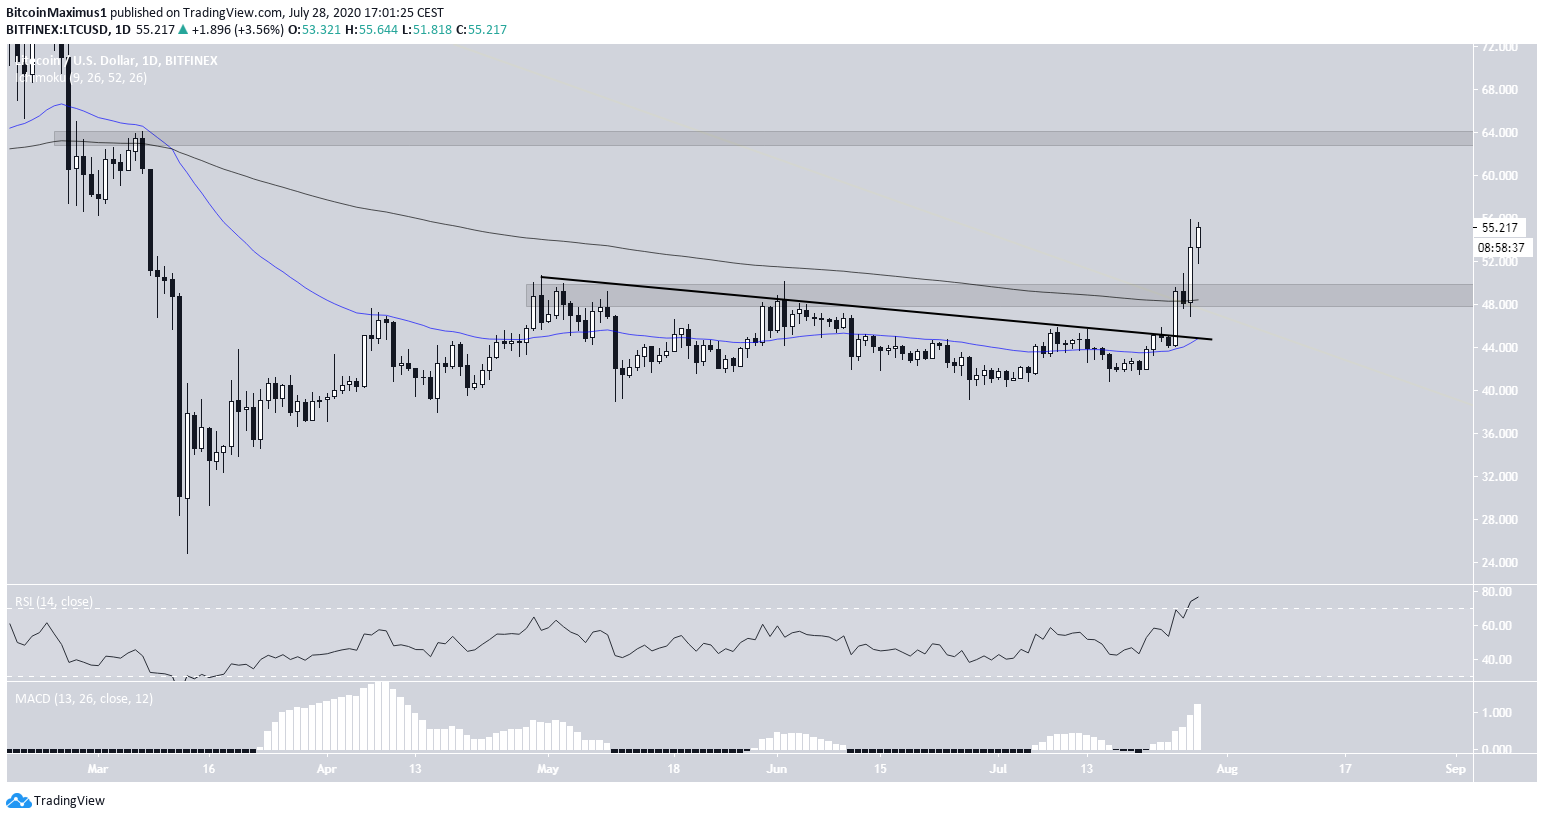
Cryptocurrency trader @Walter_Wyckoff outlined a Litecoin chart, which shows the price ready to move upwards. The previous resistance level he outlined is found at $49, corresponding with the April 30 high. This area should now act as support.
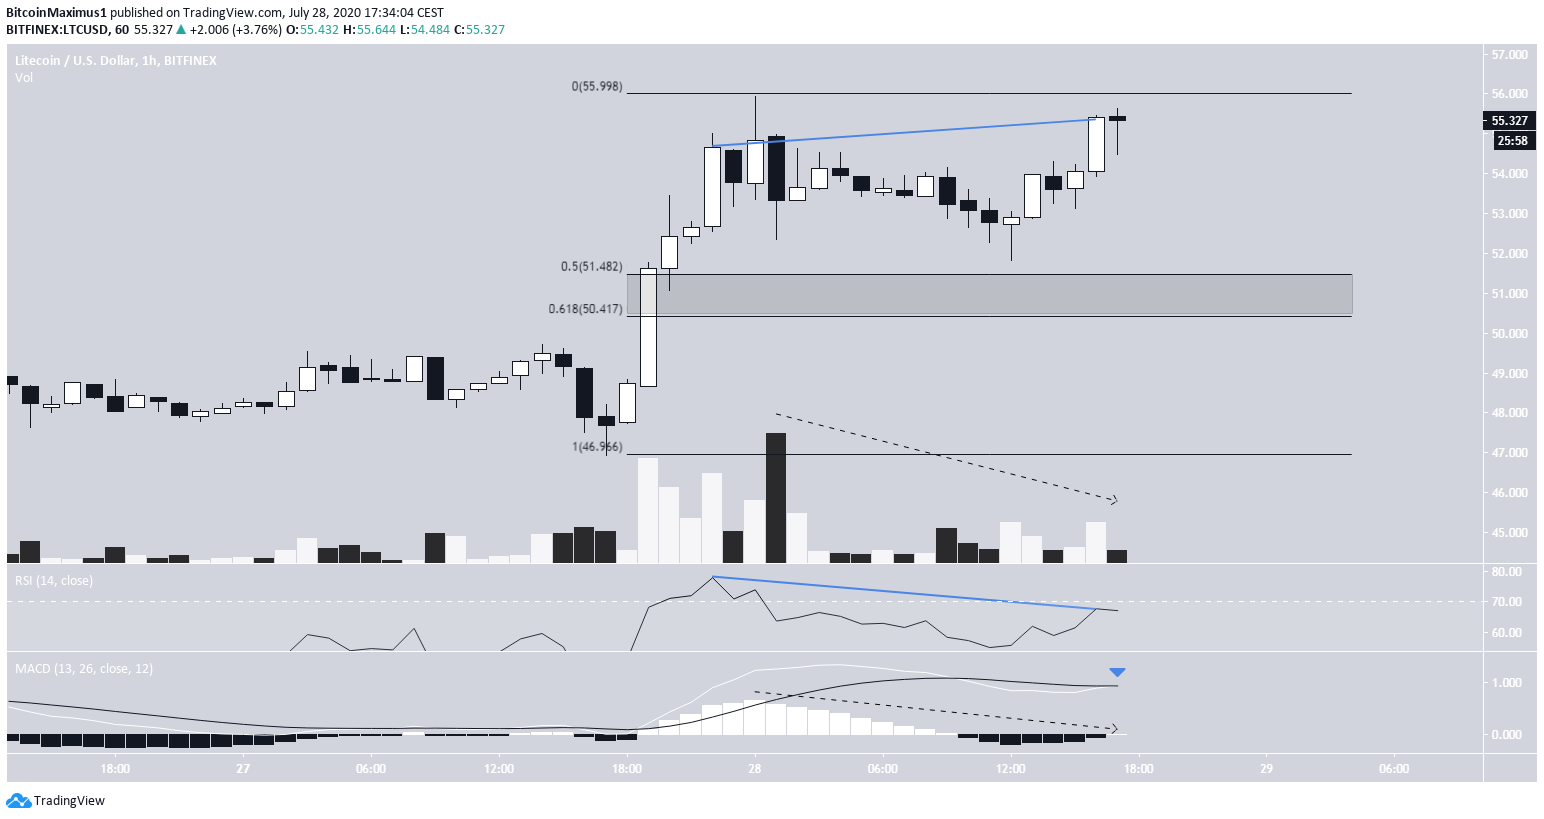
Double Top
The short-term chart reveals weaknesses. LTC has created a double top at $55, which is known as a bearish reversal pattern. The first top also coincides with a bearish engulfing pattern, which took place on high volume.
Furthermore, the volume has been declining and there is bearish divergence present in both the RSI & the MACD, the latter of which is close to making a bearish cross.
Therefore, a retracement toward $50-$51 would be expected.
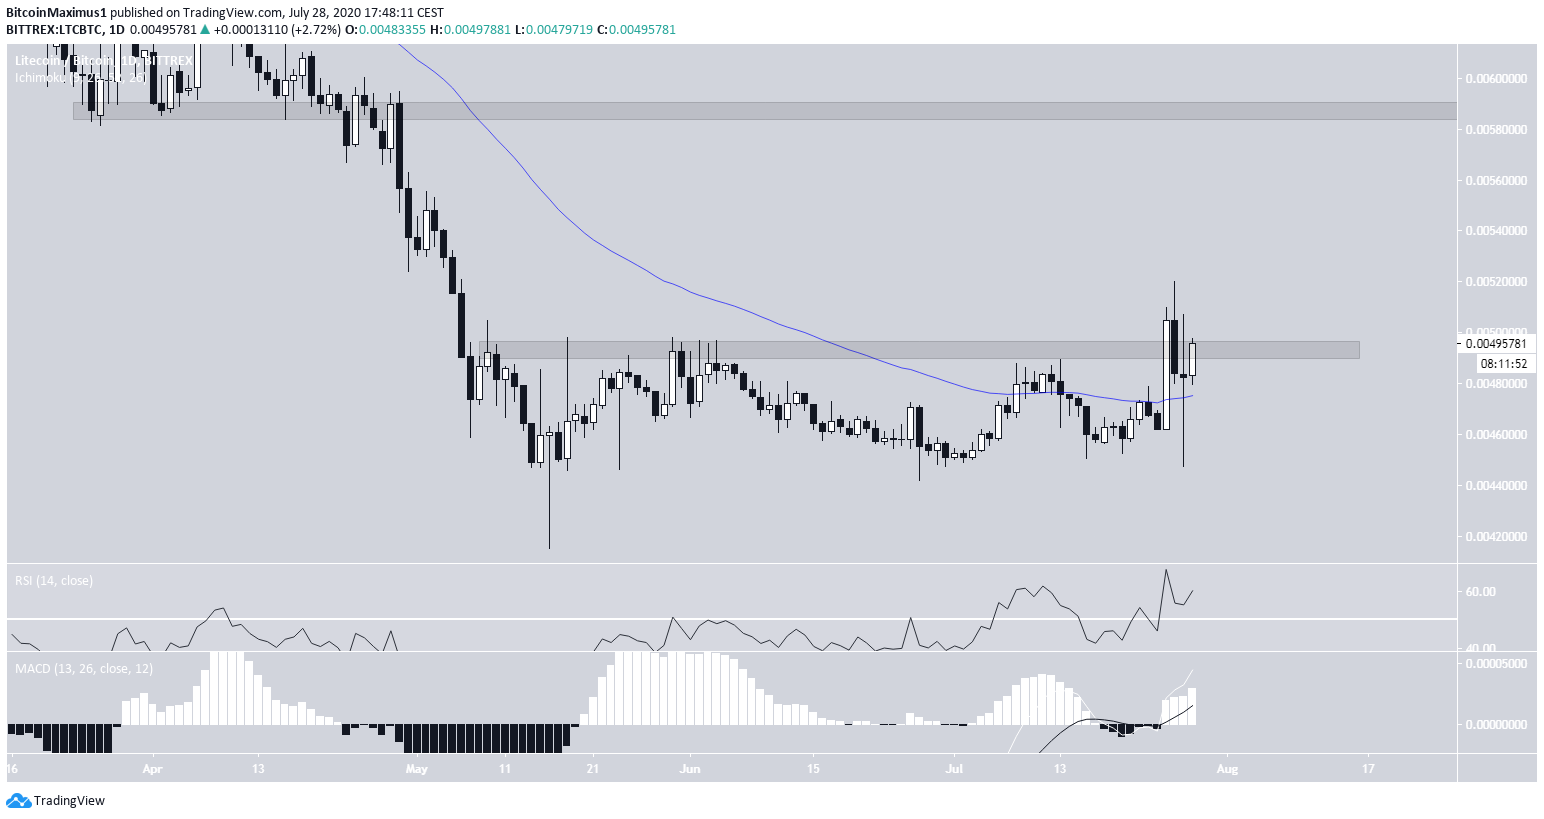
Litecoin/Bitcoin
The movement for the LTC/BTC pair is not as clear. The price is trading inside the ₿0.0050 area, which previously acted as a resistance. While it moved above it three days ago, it has since fallen back inside and is currently making another attempt to break out.
Technical indicators are bullish. The MACD is growing, and while the RSI is overbought, it has not formed any type of bearish divergence. Furthermore, the price moved above the 50-day MA and validated it as support afterward.
If successful in breaking out, the next resistance area would be found at ₿0.0059.